

Abstract
Objectives. We examined differential effects of overt and subtle forms of racial discrimination on 2 dimensions of mental health—positive affect and depressive symptoms, and explored the mediating roles of emotional arousal and cognitive appraisal.
Methods. Cross-sectional survey data were collected through face-to-face interviews with a sample (N=180) of adult Korean immigrants living in Toronto, Ontario. Maximum likelihood estimates of path coefficients were obtained using structural equation models.
Results. Perceived racial discrimination was associated with both the erosion of positive affect and depressive symptoms. Overt discrimination was associated with the erosion of positive affect, and subtle discrimination was associated with depressive symptoms. Effects of subtle discrimination on depressive symptoms were mediated through cognitive appraisal.
Conclusions. The results emphasize the salience of subtle discrimination for the mental health of Asian immigrants. Experiences of overt racial bias seemed to be of little importance for the levels of depressive symptoms among those in our sample, although the experience of blatant discrimination tended to reduce positive mood.
The recent surge of interest in racial disparities in health has stimulated numerous empirical investigations of the contributions of racism to the creation of these disparities. Many mainstream journals and monograph series, in a variety of scientific and professional fields, have published special editions dealing with the topic. The literature identifies the potential pathways through which racial discrimination may contribute to observed racial disparities in morbidity, mortality, and mental health.1–9 Further, a large body of epidemiological and experimental research demonstrates the influence of racial discrimination on both physical and emotional health among minority populations.1,4,10–12 However, many authorities have pointed to the need for further research in the area that would enhance the validity of these findings and extend them to more minority groups. The main focus of the research thus far has been on African Americans; studies examining the experiences of Asians and immigrants who belong to other racial/ethnic groups are scarce.12–17 In addition, the literature is limited as to explaining how perceived discrimination is linked to health status.11,14,15
Using data from a survey of Korean immigrants, we explored 3 key issues not yet addressed in empirical analyses. First, data are consistent in showing that overt racial discrimination has been replaced by more covert and subtle forms of prejudicial attitudes toward racial minorities and immigrants.16–29 In fact, subtle discrimination and prejudice have been the focus of social and psychological research for some decades; however, few epidemiological studies have examined how different forms of discrimination are related to health. We examined the associations of overt and subtle forms of discrimination with mental health.
Second, although most health theories accept the conceptual definition of health as consisting of both positive and negative affects or domains,30,31 research that reports the effects of discrimination rarely includes positive health outcomes and instead reports solely on negative outcomes or distress. Perceived discrimination as a determinant of mental health can be assessed more fully by incorporating both negative and positive outcomes.32 Our study employed models that allowed the contrast of 2 forms of discrimination as they related to 2 dimensions of mental health—positive affect and depressive symptoms.
Third, to make an advance in our understanding of how perceived discrimination is related to mental health, we examined the emotional and cognitive processes that may mediate the connection between discrimination and mental health. We hypothesized that when perceived unfairness is subtle, the uncertainty of the situation might call for a more active and difficult appraisal of the event or situation, causing psychological distress; direct blatant discriminations might involve less cognitive demands to appraise the nature of the situation as a threat because the message is unambiguous. Yet, being treated unfairly in a clear manner is still an unpleasant experience, and repeated exposure to such unpleasant situations may wear down positive feelings about oneself and life in general.
METHODS
Data for this study were drawn from the Korean Mental Health Study (KMHS), a survey of 860 Korean immigrant families in Toronto, Ontario.14,15,32 Of the 860 KMHS families, 243 families had at least 1 child aged 3 to 18 years. In 1997, we surveyed these children, who were then aged 10 to 25 years. We interviewed the children of 199 of the 243 families in their homes. After the completion of child interviews, interviewers left a questionnaire for the parent to fill out and then mail back to us. The primary purpose of the parent questionnaire was to obtain parental reports of their child’s adjustment. The questionnaire also included a scale of perceived racial discrimination. Of the 187 parents (49% men, 51% women) who participated in the survey, 7 were excluded because of missing data. Most of the parent participants were married (94.6%), currently employed (82.8%), and had lived in Canada for longer than 2 decades, and 58% of men and 39.1% of women had completed postsecondary education. The median annual household income (Can $57 000) of participants was substantially higher than the average household income for Korean Canadians in the greater Toronto area (Can $36 000) as reported in the 1996 census.
Measurements
Perceived discrimination.
On a Likert scale from 1 (never) to 5 (all the time), respondents indicated how often they had been discriminated against in the following ways: (1) hit or handled roughly, (2) insulted or called names, (3) treated rudely, (4) treated unfairly, (5) threatened, (6) refused services in a store or restaurant or had service delayed, (7) excluded or ignored, and (8) anyone in your family had ever been discriminated against in any way. They were given the following instructions when completing this scale: “When people insult other people, make fun of them, or treat them unfairly because they belong to a certain racial/ethnic group, this is called discrimination. This may happen to people who are not born in Canada, or who speak another language, or who look different. The next few questions are about this type of discrimination.”
Emotional arousal and cognitive appraisal.
We also included a scale of emotional reactions. All respondents who experienced at least 1 incident of discrimination were asked to indicate how such perceptions of discrimination made them feel. Three variables that measured forms of emotional arousal were sadness (sad), anger (angry, upset), and aggression (wanted to hit someone, wanted to get revenge). Four variables measured various forms of cognitive appraisal of discrimination, and they were exclusion (unwanted, rejected), powerlessness (helpless, weak, intimidated, puzzled), shame (stupid, foolish, ashamed), and discouragement (frustrated, discouraged, humiliated). Each item was coded on a 3-point scale: 0 (rarely or never); 1 (sometimes); 2 (most of the time). Based on an exploratory factor analysis (maximum likelihood extraction with oblique rotation), data were reduced to 7 variables by taking means of corresponding items.
As shown in earlier analyses,13–15 the 7 variables of emotional arousal (emotion) and cognitive appraisal were conditionally relevant variables. That is, the emotion and cognitive appraisal variables were applicable only to those participants who reported at least 1 incident of discrimination; the variables were not applicable to those respondents who reported no experiences of discrimination. In the simplest form, these variables were used as an interaction between the dummy variable of being ever discriminated against (0 if reporting no discrimination) and deviation scores of each emotion–cognitive appraisal measure.
Positive affect and depressive symptoms.
The Centre for Epidemiological Studies–Depression Scale (CES-D) was used to assess depressive symptoms and positive affect.33 The CES-D consists of 16 items of psychological distress: depressive mood, social withdrawal, and somatic symptoms. It also includes 4 positive-affect items (happy, hopeful, high self-esteem, and joy in life). Previous research found that the responses to positive-affect items cannot be simply reverse coded for measuring distress in Asian Americans34 or Asian Canadians.35,36 A Korean version of the CES-D was standardized by the authors35,36 and has been used in a number of studies.14,15,32,37
Statistical Analysis
The study involved analyses of measurement and structural models among discrimination, emotions, and mental health outcomes. For both measurement model and structural associations, structural equation models were used to examine the proposed theoretical model. Maximum likelihood estimates of the model coefficients were obtained with the covariance matrix as input into LISREL 8 (Scientific Software International, Chicago, Ill). Sample size limitations did not allow us to incorporate measurement models when estimating our theoretical models. Thus, we primarily constructed composite scales (e.g., overt and subtle discrimination) by summing up the scores of corresponding items. Similarly, we constructed positive-affect and depression scales with corresponding CES-D items. The theoretical models were evaluated with these composite scales as single indicators. These were inherent limitations of our study.
We used the χ2 test, goodness-of-fit index, adjusted goodness-of-fit index, and root mean squared error of approximation (RMSEA) to evaluate model fit. Evidence for adequate model fit exists if the goodness-of-fit index and adjusted goodness-of-fit index are greater than 0.90 and the RMSEA is less than 0.05.38 The χ2 test divided by degrees of freedom can provide a guideline for overall fit, such that a value less than 3.0 is indicative of good model fit.39 Descriptive statistics of variables are not shown (available from authors upon request).
RESULTS
Measurement Models
Perceived discrimination.
Following our earlier findings,40 we estimated a measurement model that included 2 latent factors: subtle and overt discrimination. As shown in Figure 1 ▶, the items that reflected subtle or indirect forms of discrimination captured 1 dimension, and the items that reflected direct and overt discrimination captured another. The factor loadings ranged from 0.54 to 0.90 and were statistically significant (P<.05). The fit indices indicated a good fit of the 2-factor model with the data (goodness-of-fit index = 0.97; RMSEA = 0.031). Crossfactor loadings were not statistically significant, and thus, fixed to zero in the final model shown in Figure 1 ▶; relaxing the constraints did not improve the fit of the measurement model. Measurement errors of the “treated rudely” and “treated unfairly” items were correlated. It is plausible that the responses to rude and unfair treatments may have represented variations in common or similar experiences in different forms, where the former represented experiences of more explicit situations and the latter represented exposures to situations less clear in implications.
FIGURE 1—
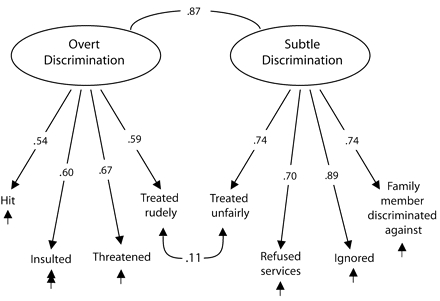
Measurement model of perceived discrimination: adult Korean immigrants in Toronto, Ontario, 1997.
Note. Down arrows indicate causation; curved lines indicate correlations. Up arrows indicate measurement error. χ2 = 19.16 (P = .32); root mean squared error of approximation = 0.031; goodness-of-fit index = .97.
The correlation between the 2 latent factors (0.87) was quite high, indicating that a single-factor model might fit the data. To test whether these dimensions were unique, we constrained the factor correlation to 1.00 and examined the reduction in model fit. The χ2 change (with 1 degree of freedom) for this test showed that the correlation between the 2 factors was significantly different from 1.00; thus, the 2 sets of items were sufficiently unique to form separate factors or domains.
Emotional arousal and cognitive appraisal.
Factor loading of emotional arousal ranged from 0.52 to 0.89 (Figure 2 ▶). The loading of the cognitive appraisal indicators ranged from 0.63 to 0.94. Although there was a moderate correlation between emotional arousal and cognitive appraisal, allowing crossfactor loadings made little change in the overall fit of the model. The model showed strong fit with the data (e.g., goodness-of-fit index = 0.96; RMSEA = 0.00).
FIGURE 2—
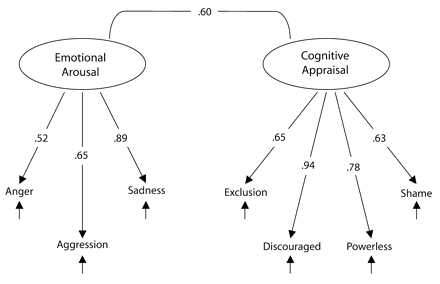
Measurement model of emotional arousal and cognitive appraisal: adult Korean immigrants in Toronto, Ontario, 1997.
Note. Down arrows indicate causation; curved lines between factors and variables indicate correlations. Up arrows indicate measurement error. χ2 = 11.21 (P = .43); root mean squared error of approximation = 0.00; adjusted goodness-of-fit index = .96.
Mental health.
The results from a confirmatory measurement model of the 20-item CES-D scale provided evidence for the existence of 2 underlying dimensions for mental health. The items that reflected positive feelings captured 1 dimension (happy, hopeful, high self-esteem, and joy in life), whereas items that reflected depressive feelings captured the other. Factor loadings ranged from 0.40 to 0.94, and all were statistically significant (P<.05). Fit indices indicated that this measurement model fit the data (e.g., goodness-of-fit index = 0.90; RMSEA = 0.038). Loadings for all items across factors were not significant and fixed to zero, and when these parameters were freed, model fit did not improve. The correlation between the 2 factors (–0.29) indicated that positive affect and depressive symptoms were separate factors.
Structural Equation Models
Maximum likelihood estimates of structural equations were estimated to address the research question about the associations of overt and subtle forms of discrimination with mental health. As explained earlier, because of the limited sample size, we could not incorporate measurement models when estimating the fit of our theoretical models. Instead, we used composite scale scores as single indicators of overt and subtle discrimination, and positive affect and depressive symptoms.
As shown in Figure 3 ▶, overt discrimination was significantly related to positive affect in the hypothesized direction (B = −0.34; t = −3.70); however, the structural equation coefficient between overt discrimination and depressive symptoms was not significant (B = 0.04; t = 0.50). Subtle discrimination was related to depressive symptoms in the hypothesized direction (B = 0.35; t = 3.92). However, subtle discrimination was not related to positive affect (B = 0.07; t = 0.61). There was also a correlation between the 2 forms of perceived discrimination (r = 0.62) and the 2 dimensions of mental health, positive affect and depressive symptoms (r = −0.20).
FIGURE 3—
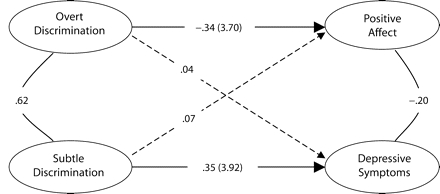
Maximum likelihood estimates of standardized coefficients of factor loadings and structural associations among perceived discrimination and mental health: adult Korean immigrants in Toronto, Ontario, 1997. Note. Straight lines indicate significant associations; curved lines indicate significant correlations; dotted lines indicate no significant associations. χ2 = 48.73 (P = .02); root mean squared error of approximation = 0.05; goodness-of-fit index (GFI) = .95; adjusted GFI = .91.
Next, the model was extended to examine our question of whether emotional arousal and cognitive appraisal mediated the linkage between discrimination and mental health. In the Structural Equation Model, we defined a latent construct of emotional arousal with 3 computed variables (anger, aggression, and sadness) and another latent construct of cognitive appraisal with 4 variables (exclusion, frustration, powerlessness, and shame). The results show that all factor loadings for the emotion and cognition constructs were statistically significant and substantial, ranging from 0.52 to 0.92 (Figure 4 ▶).
FIGURE 4—
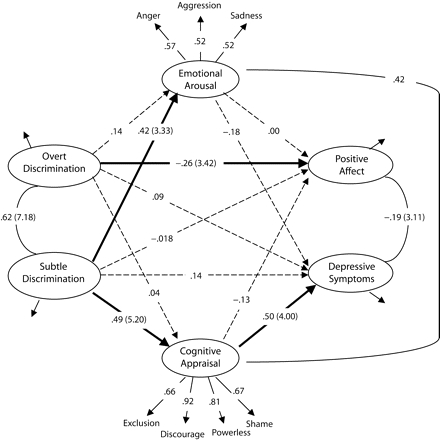
Maximum likelihood estimates of standardized coefficients of factor loadings and structural associations among perceived discrimination, emotion, cognitive appraisal, and mental health: adult Korean immigrants in Toronto, Ontario, 1997.
Note. Thin arrows indicate factor loadings; curved lines indicate significant correlations; thick lines show significant structural associations; dotted lines show nonsignifcant structural associations. T-test values are in parentheses. χ2 = 43.09 (P = .09); root mean squared error of approximation = 0.04; goodness-of-fit index (GFI) = .95; adjusted GFI = 0.92.
Overt discrimination significantly was related to positive affect (B = −0.26; t = −3.42) but was not related to emotional arousal (B= 0.14; t = 1.52) or cognitive processes (B = −0.04; t = −0.50). Emotional arousal and cognitive appraisal were not related to positive affect (B = −0.13; t = −1.07 and B = 0.00; t = 0.03, respectively). Subtle discrimination was related to cognitive appraisal (B = 0.49; t = 5.25), which in turn was associated with depressive symptoms (B = 0.50; t = 4.00). The direct influence of subtle discrimination on depressive symptoms (Figure 3 ▶) was reduced to 0.14, not statistically significant (t = 1.54). Subtle discrimination predicted emotional arousal (B = 0.42; t = 4.33); however, emotional arousal was not related to depressive symptoms or positive affect. Coefficient estimates and overall fit of the tested model were strong; χ2 (divided by degrees of freedom) was 1.33, and the other tests of the model showed a good fit of the model (RMSEA = 0.04; goodness-of-fit index = 0.95; adjusted goodness-of-fit index = 0.92).
DISCUSSION
Consistent with our proposed model, both overt and subtle discrimination seemed to influence mental health through different intraindividual processes. The experience of overt discrimination seemed to be directly related to an erosion of positive affect, and this association appeared to be independent of emotional or cognitive mediators. Experiences of subtle bias resulted in greater complexity of emotional and cognitive appraisal of the experiences that produce distress symptoms. Minority immigrants may question whether they are fully accepted members of society and its social networks, or whether they are unfairly treated at individual and structural levels. For example, it is highly plausible that subtle and ambiguous behaviors are more often observed in interactions with close members of social networks (e.g., coworkers, supervisors, neighbors), rather than strangers, which may also contribute to the stressfulness of the event. In addition, these behaviors may often be experienced within clearly defined social systems (such as recruitment and promotion policies). Moreover, it is more difficult to determine objectively whether others are acting according to objective social conscience or they are exercising unfairness based on personal bias. Thus, subtle racial bias may provoke significant stress by creating ambiguities in terms of social identity.
Indeed, we found that the link between subtle discrimination and depressive symptoms was almost entirely mediated by cognitive appraisal of the experiences: frustrating and intimidating, and powerless and helpless. Attributional ambiguity41,42 in the appraisal process may help to explain this finding. Uncertainty may exist about whether unfair treatment was experienced because of a personal characteristic (internal attribution), and is therefore a threat to personal identity, or because of a prejudice of the perpetrator toward the ethnic group (external attribution), and is therefore discrimination. Although we did not measure attributions in this study, it is possible that attributing others’ behavior to discrimination may serve as a protective factor.
Our study advances the literature of perceived racial discrimination and its salience for minority health in 4 important ways. First, previous research has focused primarily on the case of African Americans,1,4,10 and information regarding other minorities is scarce.12 Our study provides information about the experiences of Asian immigrants in Canada. Second, our study contributes to the development of social–psychological explanations of how racial/ethnic interactions may affect health. Third, our study is the first to examine the functions of 2 forms of perceived discrimination (overt and subtle) and, at the same time, to consider both mental health and 2 domains of emotion. Separating the major constructs (discrimination, emotion, and mental health) into meaningful domains has helped us to explore some critical, albeit unaddressed, issues. Fourth, our study provides the rationale for investigating the individual experiences of racial relations in such pluralistic societies as Canada.
These findings must be considered with caution. The study sample provided limited power to handle the statistical methods required to address the research questions. We therefore made several adjustments to both measurement and structural models. Even so, caution is particularly required in the interpretation of negative findings (e.g., reporting no significant associations). For example, we reported that overt discrimination was not significantly related to depressive symptoms and subtle discrimination was not related to positive affect. In principle, these observations may have been caused by the lack of statistical power, and thus, a Type II error. However, the estimated effects of the negative findings, which are less likely to be affected by sample size, were very small. For example, the B coefficient estimates for discrimination–depressive symptom and subtle discrimination–positive affect were 0.04 and 0.07, respectively. Further, we examined models of positive affect and depressive symptoms with ordinary least squares regression, control for the effects of a few confounders (age, gender, marital status, and years of residence in Canada). Results were almost identical to those shown in Figure 4 ▶, providing some confidence in our findings.
Other limitations of the study were the use of cross-sectional data and the measurement of positive affect. Some findings and implications should be verified with longitudinal analyses. Finally, the study used a single health outcome measure. The most central issue is the extent to which future investigations should consider diverse measures of health including positive affect, physical and mental health, and addiction.
In light of the study’s findings and limitations, there is an urgent need to develop better ways of assessing racism and discrimination, as well as emotions and coping as they relate to racial discrimination. As suggested elsewhere,13–15 future research should not only employ better measures10 but should also be based on theories that take into account racial, ethnic, cultural, and social contexts.
Acknowledgments
This study was supported the Social Sciences and Humanities Research Council of Canada (grant 410-96-1526), the Medical Research Council of Canada (grant MA-13752), the Canadian Institute of Health Research (grants MOP-15695, MOP-53250, and CIC-42726).
The authors wish to thank F. Wu for her assistance.
Peer Reviewed
Contributors The authors contributed equally to all aspects of the research and preparation related to this article, including conceptions of the research questions and hypotheses, data analysis and interpretations of results, and writing.
References
- 1.Krieger N. Discrimination and health. In: Kawachi B, ed. Social Epidemiology. New York, NY: Oxford University Press; 2000:36–75.
- 2.Krieger N, Smith K, Naishadham D, Hartman C, Barbeau EM. Experiences of discrimination: validity and reliability of a self-report measure for population health research on racism and health. Soc Sci Med. 2005;61:1576–1596. [DOI] [PubMed] [Google Scholar]
- 3.Taylor J, Turner RJ. Perceived discrimination, social stress, and depression in the transition to adulthood: racial contrasts. Soc Psychol Q. 2002;65:213–225. [Google Scholar]
- 4.Williams DR, Neighbors HW, Jackson JS. Racial/ethnic discrimination and health: findings from community studies. Am J Public Health. 2003;93:200–208. [DOI] [PMC free article] [PubMed] [Google Scholar]
- 5.Anderson NB, Bulatao RA, Rodolfo A, Cohen B, eds. Critical Perspectives on Racial and Ethnic Differences in Health in Late Life. Washington, DC: National Academies Press; 2004. [PubMed]
- 6.Caughy MO, O’Campo PJ, Muntaner C. Experiences of racism among African American parents and the mental health of their preschool-aged children. Am J Public Health. 2004;94:2118–2124. [DOI] [PMC free article] [PubMed] [Google Scholar]
- 7.Mustillo S, Krieger N, Gunderson EP, Sidney S, McCreath H, Kiefe CI. Self-reported experiences of racial discrimination and Black–White differences in pre-term and low-birthweight deliveries: the CARDIA Study. Am J Public Health. 2004;94:2125–2131. [DOI] [PMC free article] [PubMed] [Google Scholar]
- 8.Bennett GG, Wolin KY, Robinson EL, Fowler S, Edwards CL. Perceived racial/ethnic harassment and tobacco use among African American young adults. Am J Public Health. 2005;95:238–240. [DOI] [PMC free article] [PubMed] [Google Scholar]
- 9.Bhui K, Stansfeld S, McKenzie K, Karlsen S, Nazroo J, Weich S. Racial/ethnic discrimination and common mental disorders among workers: findings from the EMPIRIC Study of Ethnic Minority Groups in the United Kingdom. Am J Public Health. 2005;95: 496–501. [DOI] [PMC free article] [PubMed] [Google Scholar]
- 10.Blank RM, Dabady M, Citro CF, eds. Measuring Racial Discrimination—A Panel on Methods for Assessing Discrimination. Washington, DC: National Academies Press; 2004.
- 11.Krieger N. Does racism harm health? Did child abuse exist before 1962? On explicit questions, critical science, and current controversies: an ecosocial perspective. Am J Public Health. 2003;93:194–199. [DOI] [PMC free article] [PubMed] [Google Scholar]
- 12.Bulatao RA, Anderson NB. Understanding Racial and Ethnic Differences in Health in Late Life: A Research Agenda. Washington, DC: The National Academies Press; 2004. [PubMed]
- 13.Noh S, Beiser M, Kaspar V, Hou F, Rummens J. Perceived racial discrimination, depression, and coping: a study of Southeast Asian refugees in Canada. J Health Soc Behav. 1999;40:193–207. [PubMed] [Google Scholar]
- 14.Noh S, Kaspar V. Immigrant and refugee health: a review of current knowledge and policy. In: Anisef P, Lanphier M, eds. World Within a City. Toronto, Ontario: University of Toronto Press; 2003:316–353.
- 15.Noh S, Kaspar V. Perceived discrimination and depression: moderating effects of coping, acculturation, and ethnic support. Am J Public Health. 2003;93: 232–238. [DOI] [PMC free article] [PubMed] [Google Scholar]
- 16.Spencer MS, Chen J. Effect of discrimination and mental health service utilization among Chinese Americans. Am J Public Health. 2004;94:809–814. [DOI] [PMC free article] [PubMed] [Google Scholar]
- 17.Wu FH. Yellow: Race in America Beyond Black and White. New York, NY: Basic Books; 2002.
- 18.Tougas F, Desruisseaux JC, Line-Pierre AD, De La Sablonniere R. Two forms of racism and their related outcomes: the bad and the ugly. Can J Behav Sci. 2004; 36:177–189. [Google Scholar]
- 19.Katz I, Hass RG. Racial ambivalence and American value conflict: correlational and priming studies of dual cognitive structures. J Pers Soc Psychol. 1988;55: 893–905. [Google Scholar]
- 20.Dovidio JF. On the nature of contemporary prejudice: the third wave. J Soc Issues. 2001;57:829–849. [Google Scholar]
- 21.Dovidio J, Gaertner S. Prejudice, Discrimination and Racism. Orlando, Fla: Academic Press; 1986.
- 22.Monteith MJ. Contemporary forms of prejudice related conflict: in search of a nutshell. Pers Soc Psychol Bull. 1996;22:461–473. [Google Scholar]
- 23.Henry PJ, Sears DO. The symbolic racism 2000 scale. Political Psychol. 2002;23:253–283. [Google Scholar]
- 24.Sears DO. Symbolic racism. In: Katz PA, Taylor DA, eds. Eliminating Racism: Profiles in Controversy. New York, NY: Plenum Press; 1988:53–84.
- 25.Sears DO, Sidanius J, Bobo L. Racialized Politics: The Debate About Racism in America. Chicago, Ill: Chicago University Press; 2000.
- 26.Williams D, Spencer MS, Jackson J. Race, stress, and physical health: the role of group identity. In: Contrada RJ, Ashmore RD, eds. Self and Identity: Fundamental Issues: New York, NY: Oxford University Press; 1998:71–100.
- 27.McConahay JB. Self-interest versus racial attitudes as correlates of anti-busing attitudes in Louisville: is it the buses or the blacks? J Polit. 1982;44:692–720. [Google Scholar]
- 28.McConahay JB. Modern racism, ambivalence, and the modern racism scale. In: Dovidio JF, Gaerter SL, eds. Prejudice, Discrimination and Racism. Orlando, Fla: Academic Press; 1986:91–125.
- 29.Pettigrew TF, Meertens RW. Subtle and blatant prejudice in Western Europe. Eur J Soc Psychol. 1995; 25:57–75. [Google Scholar]
- 30.Horwitz AV. Outcomes in the sociology of mental health and illness: where have we been and where are we going? J Health Soc Behav. 2002;43:143–151. [PubMed] [Google Scholar]
- 31.Keyes CL. The mental health continuum: from languishing to flourishing in life. J Health Soc Behav. 2002;43:207–222. [PubMed] [Google Scholar]
- 32.Aneshensel CS. Commentary: answers and questions in the sociology of mental health. J Health Soc Behav. 2002;43:236–246. [PubMed] [Google Scholar]
- 33.Radloff LS. The CES-D scale: a self-report depression scale for research in the general population. Appl Psychol Meas. 1977;1:385–401. [Google Scholar]
- 34.Lin N. Measuring depressive symptomatology in China. J Nerv Ment Dis. 1989;177:121–131. [DOI] [PubMed] [Google Scholar]
- 35.Noh S, Avison W, Kaspar V. Depressive symptoms among Korean immigrants: assessment of a translation of the Centre for Epidemiologic Studies-Depression Scale. Psychol Assess. 1992;4:84–91. [Google Scholar]
- 36.Noh S, Kaspar V, Chen X. Measuring depression in Asian populations: assessing validity of the translated version of CES-D scale. Cross-Cultural Res. 1998; 32:358–377. [Google Scholar]
- 37.Noh S, Speechley M, Kaspar V, Wu Z. Depression in Korean immigrants in Canada: I. Method of the study and prevalence of depression. J Nerv Ment Dis. 1992;180:573–577. [DOI] [PubMed] [Google Scholar]
- 38.Yoder KA. Alternative Indices for Testing Goodness-of-Fit in Structural Equation Modeling. Ames: Department of Statistics, Iowa State University; 1998.
- 39.McIver JP, Carmines EG. Unidimensional Scaling. Beverly Hills, Calif: Sage Publications; 1981.
- 40.Noh S, Beiser M, Hou F, Kaspar V. Experiences of racism among Southeast Asian refugees. In: Roth R, ed. Global Culture With Human Rights and Mental Health. Scottsdale, Ariz: Pabst Science Publishers; 1998: 503–515.
- 41.Crocker J, Major B, Steele C. Social stigma. In: Gilbert DT, Fiske ST, Kindzey G, eds. The Handbook of Social Psychology. Vol 2. 4th ed. Boston, Mass: McGraw Hill; 1998:504–553.
- 42.Snyder ML, Wicklund RA. Attribute ambiguity. In: Harvey JH, Ickes WJ, Kidd RF, eds. New Directions in Attribution Research. Hillsdale, NJ: Erlbaum; 1976: 197–221.