Abstract
Muscle acetylcholine receptors are synaptic ion channels that “gate” between closed- and open-channel conformations. We used Φ-value analysis to probe the transition state of the diliganded gating reaction with regard to residues in the M3, membrane-spanning helix of the muscle acetylcholine receptor α-subunit. Φ (a fraction between 1 and 0) parameterizes the extent to which a mutation changes the opening versus the closing rate constant and, for a linear reaction mechanism, the higher the Φ-value, the “earlier” the gating motion. In the upper half of αM3 the gating motions of all five tested residues were temporally correlated (Φ ≈ 0.30) and serve to link structural changes occurring at the middle of the M2, pore-lining helix with those occurring at the interface of the extracellular and transmembrane domains. αM3 belongs to a complex and diverse set of synchronously moving parts that change structure relatively late in the channel-opening process. The propagation of the gating Brownian conformational cascade has a complex spatial distribution in the transmembrane domain.
INTRODUCTION
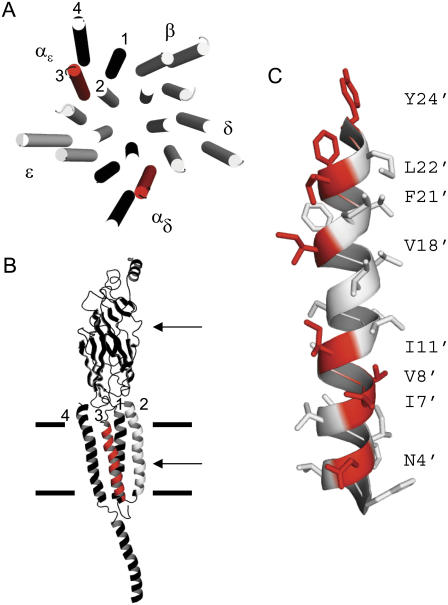
Muscle acetylcholine receptors (AChRs) are allosteric proteins that generate membrane currents by “gating” between nonconducting (closed; C) and ion-conducting (open; O) conformations. At the adult vertebrate neuromuscular synapse the AChR is large (∼290 kD) and composed of two α-subunits and one each of homologous β, δ, and ɛ-subunits (1–5). The transmembrane domain of each subunit has four membrane-spanning segments. M2 lines the channel, M4 faces the lipid bilayer, and in the ∼4 Å Torpedo AChR structure (6,7), M1 and M3 form an intermediate ring that is interposed between M2 and M4 (Fig. 1 A). The focus of this report is the relative timing of the gating motions of α-subunit M3 residues. Elsewhere we describe the timing of the gating motions of nearby regions in the α-subunit, the M2 helix (8), the linker between M2 and M3 (A. Jha, D. J. Cadugan, P. Purohit, and A. Auerbach, unpublished data) and between strand β10 and M1 (P. Purohit, and A. Auerbach, unpublished data).
FIGURE 1.
M3 of the α-subunit. (A) Torpedo AChR transmembrane domain, viewed from the synapse (PDB code 2bg9 (7)). M3 in the two α-subunits is red. In all subunits M2 lines the channel and M4 is at the periphery. (B) αɛ-subunit, viewed from the membrane. The upper and lower arrows mark the transmitter binding site and the presumptive gate at the M2 equator; the thick horizontal lines mark approximately the membrane. (C) The M3 helix of the αɛ-subunit, viewed from the membrane. The residues that were mutated (red) mostly face the membrane. In mouse, the αM3 sequence (24′–1′) is YMLFTMVFVIASIIITVIVINTHH (Table 1). In Torpedo αM3 has two differences, at 7′ (I→V) and 14′ (A→S).
Affinity labeling (9) and structural studies (6,7,10) indicate that in all subunits the M3 segment is α-helical, although in the α-subunit M3 may be less organized at its limits (10). With regard to function, mutations of M3 residues in the α, β, and γ-subunits have been shown to change the macroscopic current response (11–16), most likely by altering the diliganded gating equilibrium constant (Keq). Single-channel studies of AChRs with M3 mutations indicate that such changes in Keq arise mainly from changes in the channel-closing rate constant (18,19). Together, these studies demonstrate that M3 moves during C↔O gating because a side-chain substitution that changes Keq must differentially alter the C versus O energy, and this difference in sensitivity implies a difference in structure, which implies motion. Recently, a “tilted-spring” model was proposed for the specific gating motion of αM3 in mouse muscle AChRs (16).
The relative timing of the motion of a residue may be inferred from the diliganded opening (ko) and closing (kc) rate constants of the AChR gating reaction. The fraction Φ, obtained from the slope of a log-log plot of ko versus the equilibrium constant (Keq = ko/kc), may reflect relative temporal information, with higher values reflecting earlier motions (20,21). Extensive Φ-value analyses show that in the transmembrane domain of the α-subunit most of M2 has a Φ ≈ 0.64, which suggests that it moves relatively early in the diliganded gating reaction, followed by αM4 (Φ ≈ 0.54) along with several residues near the middle of αM2 (Φ ≈ 0.54 and 0.31) (8). Here, we describe Φ for eight residues in αM3.
METHODS
Mutagenesis and expression
The mutants were constructed using the QuickChange site-directed mutagenesis kit (Stratagene, La Jolla, CA). The mutated amino acid was verified by nucleotide sequencing. Human embryonic kidney fibroblast cells (HEK 293) were transiently transfected using calcium phosphate precipitation. HEK cells were treated with 0.875 mg of DNA per 35 mm culture dish in the ratio of 2:1:1:1 (α/β/δ/ɛ) for ∼16 h. Most electrophysiological recordings were made ∼24 h later.
Electrophysiology
Recordings were performed in cell-attached patch configuration at 22°C. The bath and pipette solutions were Dulbecco's phosphate-buffered saline containing (mM): 137 NaCl, 0.9 CaCl2, 2.7 KCl, 1.5 KH2PO4, 0.5 MgCl2, and 8.1 Na2HPO4 (pH 7.3). Choline was added to the pipette solution at a concentration (20 mM), that is, >5 times the equilibrium dissociation constant (22), so all currents were generated by fully liganded AChRs. Pipettes made from borosilicate capillaries were coated with Sylgard (Dow Corning, Midland, MI). The average pipette resistance was 10 MΩ. The pipette potential was held at +70 mV, which corresponds to a membrane potential of ∼−100 mV. Single-channel currents were recorded using a PC-505 amplifier (Warner Instrument, Hamden, CT) with low-pass filtering at 20 kHz. The currents were digitized at a sampling frequency of 50 kHz using a SCB-68 acquisition board (National Instruments, Austin, TX) and QuB software (www.qub.buffalo.edu).
Rate constant determination
At 20 mM choline, openings occur in clusters with long gaps between clusters reflecting epochs when all of the AChRs in the patch are desensitized. Clusters of individual channel closed-open activity were selected by eye or by using a critical closed-interval duration (tcrit) of 50–100 ms. Clusters were idealized into noise-free intervals without additional filtering by using the segmental k-means algorithm (SKM) with a C↔O model (starting rate = 100 s−1) (23). The opening and closing rate constants were estimated from the interval durations by using a maximum-interval likelihood algorithm (MIL) after imposing a dead time of 75 μs (24,25). Usually, closed/open intervals within clusters were fitted by a single exponential and the rate constants were estimated by using a two-state, C↔O model. In some cases, a second closed state was connected to the O state to accommodate a short-lived desensitized state (26). The openings were prolonged approximately twofold because of channel block by choline.
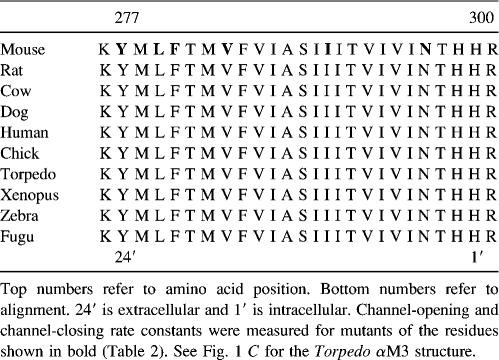
At 24′ most of the mutations decreased Keq to such an extent that single-channel cluster analysis was not possible. We therefore expressed the 24′ mutational series in AChRs having an additional background mutation (δS268V) that by itself increases Keq mainly by decreasing the closing rate constant (22,27) (Table 1). We reasoned that if the two distant (∼36 Å) mutations have independent effects then the decrease in Keq (increase in closing rate constant) caused by 24′ mutations would be offset by a similar increase in Keq (decrease in closing rate constant) caused by the background mutation. As shown by the clusters of current from constructs having both αM3 and the background mutations (Fig. 2 A), the two substitutions did indeed compensate. As was the case with the other αM3 mutants, side-chain substitutions at Y24′ that decreased Keq did so mainly by increasing the channel closing rate constant (Table 1).
TABLE 1.
Sequence alignment (N to C) of vertebrate αM3 segments
FIGURE 2.
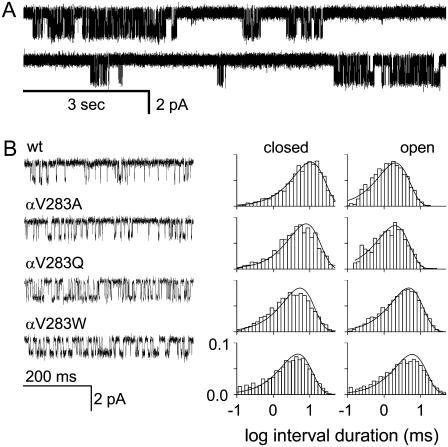
A single-channel kinetic analysis of V283 (18′). (A) Example clusters of V18′W single-channel openings elicited by 20 mM choline (open is down; recording is continuous). Open and closed intervals within clusters reflect diliganded gating, and closed intervals between clusters reflect desensitization. (B) Expanded view of individual clusters and interval duration histograms for four V18′ constructs. The mutations all increase the open probability (by increasing the gating equilibrium constant), mainly by increasing the open channel lifetime (i.e., by decreasing the channel closing rate constant).
REFER analysis
The extent to which a change in Keq consequent to a point mutation arises from a change in the opening, C→O rate constant (ko) versus the closing, O→C rate constant (kc) is given by Φ, a fraction between 1 (only ko changes) and 0 (only kc changes). Φ was estimated as the slope of the rate-equilibrium free energy relationship (REFER), which is a plot of log (ko) versus log (ko/kc) (28,29). For some reactions, Φ provides relative temporal information regarding the movement of the perturbed side chain in the gating reaction (1 is “early”, 0 is “late”, and the same is “synchronous”) (21). In the REFERs, each point represents the mean of the parameters from at least three patches. The Y277F construct is not shown in Fig. 3 A because all other constructs of this position were measured on a δS268V background.
FIGURE 3.
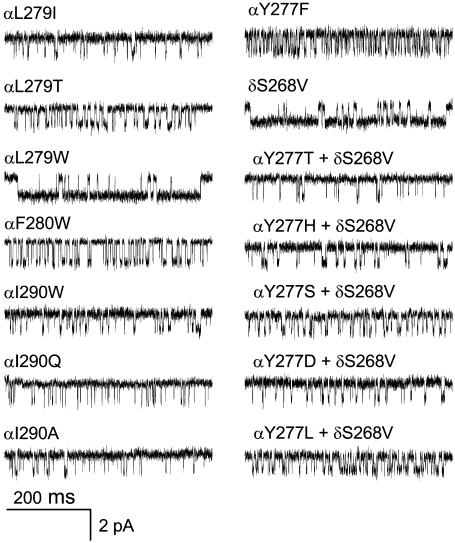
Single-channel currents of αM3 mutants. Example clusters from AChRs activated by 20 mM choline. The 24′ position is shown both on the wt and the δS268V background. Open is down.
Hybrid generation and analysis
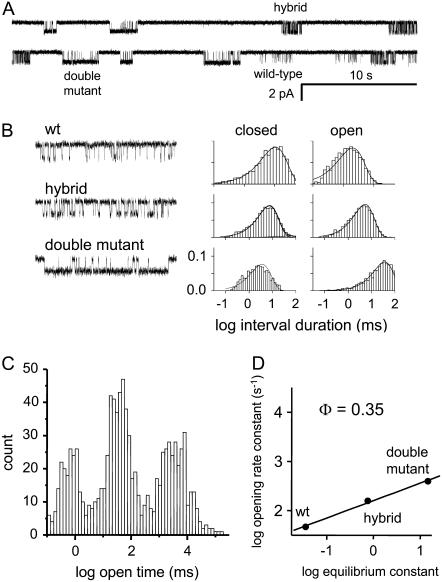
HEK cells were transfected with both wild-type and mutant (L279W, 21′) α-subunit cDNA in the ratio 1:3 ratio, together with wild-type β, ɛ, and δ cDNAs. Recordings showed three kinetically distinct populations of clusters that could be distinguished according to their mean open times. Clusters were selected by eye and idealized by using SKM. The clusters were then separated into populations by using the SKM algorithm with the mean open time as the only selection criterion. Subsequent estimation of the rate constants was done on each cluster subpopulation.
RESULTS
The αM3 helix is composed of 24 residues that can be numbered sequentially from the C-terminus at the intracellular end of the membrane (1′; residue H300) to the N-terminus at the interface with extracellular domain (24′; residue Y277; Table 1). We measured ko and kc for AChRs having mutations at eight different αM3 positions, most of which face the lipid membrane (Fig. 1 C). Previously it was shown that Trp substitutions of many of these same residues shift the EC50 of the dose-response curve (13), which suggests that these amino acids move during C↔O gating.
Mutations of three αM3 positions (4′, 7′, and 8′) yielded AChRs that had wild-type (wt) gating kinetic and equilibrium constants (Table 2). This indicates that these side-chain substitutions did not differentially alter the relative energy of diliganded C versus O, perhaps because these residues do not move (relative to their local environments) during the course of the gating reaction. At five αM3 positions one or more of the mutations caused a significant change in Keq. As was observed in αM4 (30) and αM2 (8), the changes in Keq for αM3 were larger for positions in the extracellular half of the helix. The greatest effects were for L22′W and Y24′T where the range of Keq for the mutant series was >100-fold.
TABLE 2.
Rate and equilibrium constants for αM3 mutant AChRs activated by 20 mM choline
| Opening rate constant (ko)
|
Closing rate constant (kc)
|
Equilibrium constant (Keq)
|
|||||
|---|---|---|---|---|---|---|---|
| Mean | SE | Mean | SE | Mean | SE | Keq ratio | |
| Wt | 120 | 1000 | 0.12 | ||||
| δS268V | 141 | 19 | 53 | 6 | 2.66 | 0.47 | |
| αY277D (24′)+ δS268V | 67 | 8 | 278 | 15 | 0.24 | 0.03 | 0.09 |
| αY277L (24′) + δS268V | 138 | 12 | 314 | 35 | 0.44 | 0.06 | 0.17 |
| αY277S (24′) + δS268V | 124 | 22 | 428 | 22 | 0.29 | 0.05 | 0.11 |
| αY277T (24′) + δS268V | 44 | 3 | 667 | 59 | 0.07 | 0.01 | 0.02 |
| αY277H (24′) + δS268V | 51 | 5 | 479 | 19 | 0.11 | 0.01 | 0.04 |
| αY277F (24′) | 448 | 47 | 853 | 40 | 0.53 | 0.06 | 4.38 |
| αL279T (22′) | 198 | 13 | 446 | 30 | 0.44 | 0.04 | 3.7 |
| αL279I (22′) | 120 | 3 | 1005 | 55 | 0.12 | 0.01 | 1 |
| αL279W (22′) | 488 | 131 | 26 | 2 | 18.77 | 5.24 | 156.41 |
| αF280W (21′) | 180 | 8 | 394 | 15 | 0.46 | 0.03 | 3.81 |
| αV283A (18′) | 165 | 11 | 549 | 33 | 0.30 | 0.03 | 2.5 |
| αV283W (18′) | 239 | 27 | 187 | 11 | 1.28 | 0.16 | 10.65 |
| αV283Q (18′) | 221 | 2 | 245 | 28 | 0.90 | 0.10 | 7.52 |
| αI289A (12′) | 89 | 3 | 1019 | 61 | 0.09 | 0.01 | 0.73 |
| αI290W (11′) | 151 | 16 | 568 | 108 | 0.27 | 0.06 | 2.22 |
| αI290Q (11′) | 91 | 7 | 1599 | 301 | 0.06 | 0.01 | 0.47 |
| αI290A (11′) | 87 | 1 | 1945 | 194 | 0.04 | 0.00 | 0.37 |
| αV293W (8′) | 89 | 12 | 945 | 51 | 0.09 | 0.01 | 0.78 |
| αI294W (7′) | 71 | 9 | 970 | 42 | 0.07 | 0.01 | 0.61 |
| αN297W (4′) | 95 | 11 | 1182 | 44 | 0.08 | 0.01 | 0.67 |
| αN297M (4′) | 70 | 9 | 897 | 50 | 0.08 | 0.01 | 0.65 |
Rate constants are s−1 (mean of three patches). Keq = ko/kc. The Keq ratio is mutant/wt, except for the Y277 series, which is mutant/δS268V background. No correction was made for channel block by the agonist so the kc values are approximately half of those of unblocked AChRs. Φ-values were not estimated for positions 4′, 7′, and 8′ because the range of Keq values was less than fivefold.
Fig. 2 shows an analysis of the mutational series for residue V18′. Here, all three mutant side chains (A, Q, and W) increased Keq and, hence, the probability of being open within a cluster. As can been seen in the interval duration histograms, the main effect of these mutations was to decrease the channel closing rate constant (Table 2). Fig. 3 shows example currents for three additional αM3 positions. At 21′ and 22′ all of the side-chain substitutions increased Keq, but at 11′ the mutations either increased or decreased Keq. Similar to the 18′ mutational series, mutations at 11′, 21′, and 22′ changed Keq mainly by changing the channel closing rate constant (Table 1).
There are two α-subunits per AChR. To address the possibility that an M3 mutation in each subunit might contribute unequally to the fold change in Keq we expressed hybrid AChRs having one mutated and one wt α-subunit (Fig. 4). In addition to AChRs having wt or double mutant kinetic patterns, L21′W hybrid patches exhibited a single, new population of clusters in which the fold change in Keq was exactly half of the fold change caused by the double mutation (Fig. 4 D). This indicates that the energetic consequence of L21′W was equal and independent at the two α-subunits. This result is similar to that found for hybrid mutations at other transmembrane positions (αM4-10′ (30) and αM2-17′ (31)), but is different for hybrid mutations near the transmitter binding site where the consequence of the mutation (with regard to Keq) in one subunit can be ∼5 times greater than in the other (32–34).
FIGURE 4.
Analysis of αM3-21′ (L279W) hybrids. Hybrids are AChRs in which only one of the two α-subunits is mutated. (A) Low time-resolution view of a continuous current trace showing wild-type, hybrid, and double mutant clusters. (B) Expanded view of clusters and interval duration histograms. The mutation mainly influences the open channel lifetime (the channel closing rate constant). (C) The mean open channel lifetime of clusters. The three populations correspond to wt, hybrid, and double-mutant AChRs. (D) REFER analysis. The fold change in log equilibrium constant caused by a single mutation is exactly half of that caused by two mutations. The effects of the mutations on the relative energy of C versus O are equal and independent. The slope of the REFER, Φ, is similar for both the single- and double-mutant constructs. The gating motions of M3-21′ in both α-subunits are temporally correlated.
Y277 (24′; Φ = 0.34) is at the top of M3 and, rather than facing the lipid bilayer, is in contact with residues near the base of the extracellular domain, in the β10-M1 and M2-M3 linkers. Five of the six side-chain substitutions at Y24′ decreased Keq to such an extent that it was impossible to identify clusters of openings (as is necessary to estimate the gating rate constants). We therefore expressed these Y24′ loss-of-function constructs in AChRs having a background mutation that increased the opening and decreased the closing rate constant. This background mutation was at a distant location, the 12′ position of the δ-subunit (S268V), and we made the assumption that the effects of the Y24′ and the background mutations were independent, energetically.
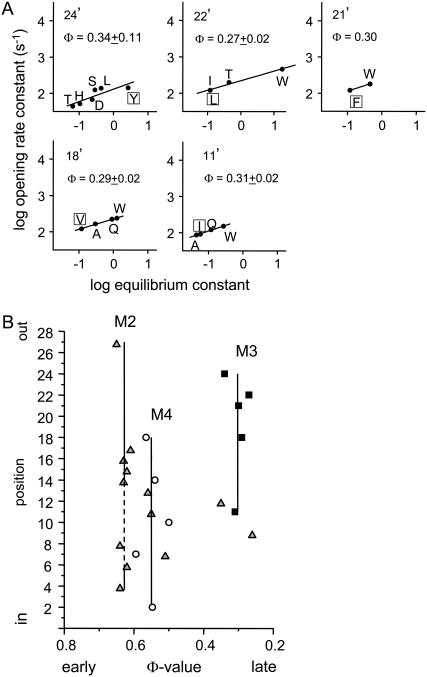
Fig. 5 A shows Φ-value analyses for the five mutation-sensitive positions in αM3. In all cases the REFERs were approximately linear and had a slope, Φ, in the range 0.27–0.34 (mean = 0.30). In addition, the αL21′W hybrid construct had a similar Φ-value as did the double mutant and the other αM3 positions (Fig. 4 D). This suggests that in the two α-subunits the gating motions of M3 are also synchronous.
FIGURE 5.
Φ-values for αM3. (A) Rate-equilibrium free-energy relationships. Each point represents the mean value for at least three patches (Table 2). Φ (±SD) is the slope. Mutation of position 4′, 7′, and 8′ did not change the equilibrium constant significantly and no Φ-value could be estimated. (B) Φ as a function of position for M3 (squares), M2 (triangles) (8), and M4 (circles) (22). 24′ is the top and 1′ the bottom of the M3 helix (see Fig. 1). Φ is constant through the upper half (11′–24′) of αM3, with an average value of 0.30. Other regions of the AChR having Φ ∼ 0.3 include αM2 (9′ and 12′), ɛM2-9′, βM2-9′, ɛM4-14′, and δM2 (12′–18′).
DISCUSSION
The observation that positions 11′, 18′, 21′, 22′, and 24′ in αM3 all have Φ ≈ 0.30 suggests that the movements of the upper half of this helix are temporally correlated and occur relatively late in the diliganded gating reaction. Fig. 5 B compares the Φ-values of residues in the M2, M3, and M4 helices of the α-subunit. In general, the sequence is M2 > M4 > M3. Mutations below in the lower third of αM3 had little or no effect on Keq, which is consistent with previous studies showing that there is little gating movement in this region of GABA receptor channels (35). However, we sampled only eight different side chains at positions ≤12′ (Table 2), and it is possible that other substitutions may cause larger changes in Keq.
The topmost αM3 residue, Y277 (24′), is located in a region of the protein where the map of Φ-values is complex. In the Torpedo AChR structure (Protein Data Bank (PDB) code 2bg9), Y277 is within 4 Å of residue F135 in the “cys-loop” (Φ = 0.78), residue I274 in the M2-M3 linker (Φ = 0.64), and residue I210 (Leu in the mouse) in the β10-M1 linker (Φ = 0.31). Further, F135 and I274 are members of larger, approximately nanometer-sized domains (“Φ-blocks”) within which many of the constituent amino acids have approximately the same Φ-value. Thus, Y277 is located in a region where three different Φ-blocks (0.78, 0.64, and 0.31) converge. All of the other M3 residues that we examined face the lipid bilayer and are far (>8 Å) from sites for which Φ has been measured. It will be interesting to learn the Φ-values for αM3 residues that are proximal to atoms in M1, M2, and M4.
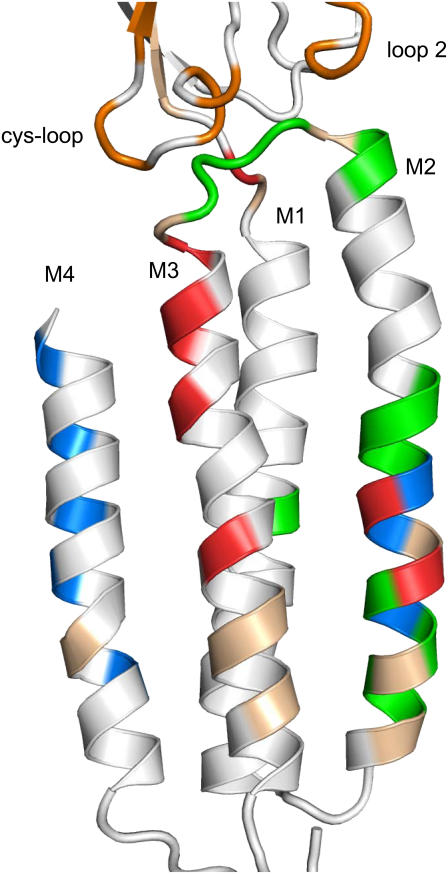
The Φ-values of the αM3 gating residues we have measured can be compared to those in other α-subunit domains (Fig. 6). The transmitter binding site and loop A have the highest Φ-value (∼0.93 (36)), which suggests that these regions move at the outset of the channel-opening process. The next highest Φ-value (∼0.78) belongs to the cys-loop and loop 2 (36), and the next Φ-value (∼0.64) to residues in the M2-M3 linker (A. Jha, D. J. Cadugan., P. Purohit, and A. Auerbach, unpublished data) and most of M2 (8). The Φ-value for F225 in M1 was 0.74 (37); although more M1 positions need to be scanned, this result suggests that this amino acid moves either with the 0.78 or 0.64 Φ-blocks. The sequential movements of the first three Φ-blocks represents an approximately longitudinal, Brownian propagation of the initial steps in channel-opening process, and links conformational changes at the transmitter binding sites with those near the middle of the membrane. We speculate that at this point in the channel-opening reaction some moving parts of the AChR have yet to change their local conformations from C to O.
FIGURE 6.
Map of Φ-values the αɛ-subunit transmembrane domain. Cartoon of the α-subunit transmembrane domain of the Torpedo AChR (PDB code 2bg9), viewed from the membrane (see Fig. 1). M2 lines the pore (right) and M4 is at the periphery (left). The residues are colored according to Φ-value: orange (0.75–0.85), green (0.59–0.74), blue (0.48–0.57), red (0.26–0.35), tan (little or no change in Keq), white (no measurements). The αM3 Φ-block spans from the equatorial region to the interface of the extracellular and transmembrane domains. The gating motions of residues in the upper half of αM3 are correlated temporally and occur late in the channel-opening process. There is a tendency for residues in the bottom third of the transmembrane domain to show small changes in Keq.
The subsequent, transmembrane segment channel-opening motions in the α-subunit are complex in their spatial organization. After the bulk of M2, the next highest Φ-values belong to residues in M4 plus the 13′–11′ and 7′ residues of M2 (∼0.54) (8). Thus, although M3 lies between M2 and M4 the main sequence of motions is M2 > M4 > M3, with residues that are approximately at the same “latitude” having different Φ-values and, perhaps, moving at different times in the opening process. Finally, the lowest Φ-values in the α-subunit belong to residues at the 9′ and 12′ equatorial positions of αM2 plus αM3 and pre-M1. The map of Φ-values is incomplete and at this juncture we cannot fully describe the spread of the gating conformational change through the transmembrane domain of the protein.
The Φ-value analysis of αM3 shows that this helix is a member of a diverse set of moving parts all having Φ ∼ 0.3. This set includes residues at the middle of M2 in the α-, β-, and ɛ-subunits (31,22), the β10-M1 segment of the α-subunit, the upper half of δM2 (38) and ɛM4 (30). We speculate that these collective gating motions, that include action at the M2 equatorial region of all five subunits, are associated with a late conformational event that regulates the conductance of the pore. We do not know why this group of noncontiguous residues, in all five subunits, is so complex or what forces correlate (in time) their gating motions. Moreover, we cannot give reasons why the propagation of the AChR channel-opening conformational cascade, which might simply and directly link the affinity change at the binding site with the conductance change at the gate in three steps, involves outward (M2–M4) and upward (equator to pre-M1) motions in the transmembrane domain. To answer these questions we will need a more complete map of Φ-values, knowledge of which residues interact energetically during gating, and an understanding of the functional consequences of gating motions in all regions of the protein.
Editor: Meyer B. Jackson.
References
- 1.Edelstein, S., and J. P. Changeux. 1998. Allosteric transitions of the acetylcholine receptor. Adv Prot Chem. 51:121–184. [DOI] [PubMed] [Google Scholar]
- 2.Karlin, A. 2002. Emerging structure of the nicotinic acetylcholine receptors. Nat. Rev. Neurosci. 3:102–114. [DOI] [PubMed] [Google Scholar]
- 3.Lester, H. A., M. I. Dibas, D. S. Dahan, J. F. Leite, and D. A. Dougherty. 2004. Cys-loop receptors: new twists and turns. Trend Neurosci. 27:329–336. [DOI] [PubMed] [Google Scholar]
- 4.Sine, S. M., and A. G. Engel. 2006. Recent advances in Cys-loop receptor structure and function. Nature. 440:448–455. [DOI] [PubMed] [Google Scholar]
- 5.Unwin, N. 2000. The Croonian Lecture 2000. Nicotinic acetylcholine receptor and the structural basis of fast synaptic transmission. Philos. Trans. R. Soc. Lond. B Biol. Sci. 355:1813–1829. [DOI] [PMC free article] [PubMed] [Google Scholar]
- 6.Miyazawa, A., Y. Fujiyoshi, and N. Unwin. 2003. Structure and gating mechanism of the acetylcholine receptor pore. Nature. 423:949–955. [DOI] [PubMed] [Google Scholar]
- 7.Unwin, N. 2005. Refined structure of the nicotinic acetylcholine receptor at 4 A resolution. J. Mol. Biol. 346:967–989. [DOI] [PubMed] [Google Scholar]
- 8.Purohit, P., A. Mitra, and A. Auerbach. 2007. A stepwise mechanism for acetylcholine receptor channel gating. Nature. 446:930–933. [DOI] [PubMed] [Google Scholar]
- 9.Blanton, M. P., and J. B. Cohen. 1994. Identifying the lipid-protein interface of the Torpedo nicotinic acetylcholine receptor: secondary structure implications. Biochemistry. 33:2859–2872. [DOI] [PubMed] [Google Scholar]
- 10.Lugovskoy, A. A., I. V. Maslennikov, Y. N. Utkin, V. I. Tsetlin, J. B. Cohen, and A. S. Arseniev. 1998. Spatial structure of the M3 transmembrane segment of the nicotinic acetylcholine receptor alpha subunit. Eur. J. Biochem. 255:455–461. [DOI] [PubMed] [Google Scholar]
- 11.Campos-Caro, A., J. C. Rovira, F. Vicente-Agullo, J. J. Ballesta, S. Sala, M. Criado, and F. Sala. 1997. Role of the putative transmembrane segment M3 in gating of neuronal nicotinic receptors. Biochemistry. 36:2709–2715. [DOI] [PubMed] [Google Scholar]
- 12.Cruz-Martin, A., J. L. Mercado, L. V. Rojas, M. G. McNamee, and J. A. Lasalde-Dominicci. 2001. Tryptophan substitutions at lipid-exposed positions of the gamma M3 transmembrane domain increase the macroscopic ionic current response of the Torpedo californica nicotinic acetylcholine receptor. J. Membr. Biol. 183:61–70. [DOI] [PMC free article] [PubMed] [Google Scholar]
- 13.Guzman, G. R., J. Santiago, A. Ricardo, R. Marti-Arbona, L. V. Rojas, and J. A. Lasalde-Dominicci. 2003. Tryptophan scanning mutagenesis in the alphaM3 transmembrane domain of the Torpedo californica acetylcholine receptor: functional and structural implications. Biochemistry. 42:12243–12250. [DOI] [PubMed] [Google Scholar]
- 14.Navedo, M., M. Nieves, L. Rojas, and J. A. Lasalde-Dominicci. 2004. Tryptophan substitutions reveal the role of nicotinic acetylcholine receptor alpha-TM3 domain in channel gating: differences between Torpedo and muscle-type AChR. Biochemistry. 43:78–84. [DOI] [PubMed] [Google Scholar]
- 15.Reference deleted in proof.
- 16.Otero-Cruz, J. D., C. A. Baez-Pagan, I. M. Caraballo-Gonzalez, and J. A. Lasalde-Dominicci. 2007. Tryptophan-scanning mutagenesis in the alphaM3 transmembrane domain of the muscle-type acetylcholine receptor. A spring model revealed. J. Biol. Chem. 282:9162–9171. [DOI] [PubMed] [Google Scholar]
- 17.Santiago, J., G. R. Guzman, K. Torruellas, L. V. Rojas, and J. A. Lasalde-Dominicci. 2004. Tryptophan scanning mutagenesis in the TM3 domain of the Torpedo californica acetylcholine receptor beta subunit reveals an alpha-helical structure. Biochemistry. 43:10064–10070. [DOI] [PubMed] [Google Scholar]
- 18.De Rosa, M. J., D. Rayes, G. Spitzmaul, and C. Bouzat. 2002. Nicotinic receptor M3 transmembrane domain: position 8′ contributes to channel gating. Mol. Pharm. 62:406–414. [DOI] [PubMed] [Google Scholar]
- 19.Wang, H.-L., M. Milone, K. Ohno, X.-M. Shen, A. Tsujino, A. P. Batocchi, P. Tonali, J. Brengman, A. G. Engel, and S. M. Sine. 1999. Acetylcholine receptor M3 domain: stereochemical and volume contributions to channel gating. Nat. Neurosci. 2:226–233. [DOI] [PubMed] [Google Scholar]
- 20.Grosman, C., M. Zhou, and A. Auerbach. 2000. Mapping the conformational wave of acetylcholine receptor channel gating. Nature. 403:773–776. [DOI] [PubMed] [Google Scholar]
- 21.Zhou, Y., J. E. Pearson, and A. Auerbach. 2005. Phi-value analysis of a linear, sequential reaction mechanism: theory and application to ion channel gating. Biophys. J. 89:3680–3685. [DOI] [PMC free article] [PubMed] [Google Scholar]
- 22.Grosman, C., and A. Auerbach. 2000. Asymmetric and independent contribution of the second transmembrane segment 12′ residues to diliganded gating of acetylcholine receptor channels: a single-channel study with choline as the agonist. J. Gen. Physiol. 115:637–651. [DOI] [PMC free article] [PubMed] [Google Scholar]
- 23.Qin, F. 2004. Restoration of single-channel currents using the segmental k-means method based on hidden Markov modeling. Biophys. J. 86:1488–1501. [DOI] [PMC free article] [PubMed] [Google Scholar]
- 24.Qin, F., A. Auerbach, and F. Sachs. 2000. A direct optimization approach to hidden Markov modeling for single channel kinetics. Biophys. J. 79:1915–1927. [DOI] [PMC free article] [PubMed] [Google Scholar]
- 25.Qin, F., A. Auerbach, and F. Sachs. 1997. Maximum likelihood estimation of aggregated Markov processes. Proc. Biol. Sci. 264:375–383. [DOI] [PMC free article] [PubMed] [Google Scholar]
- 26.Elenes, S., and A. Auerbach. 2002. Desensitization of diliganded mouse muscle nicotinic acetylcholine receptor channels. J. Physiol. 541:367–383. [DOI] [PMC free article] [PubMed] [Google Scholar]
- 27.Mitra, A., R. Tascione, A. Auerbach, and S. Licht. 2005. Plasticity of acetylcholine receptor gating motions via rate-energy relationships. Biophys. J. 89:3071–3078. [DOI] [PMC free article] [PubMed] [Google Scholar]
- 28.Fersht, A. R. 2004. Relationship of Leffler (Bronsted) alpha values and protein folding Phi values to position of transition-state structures on reaction coordinates. Proc. Natl. Acad. Sci. USA. 101:14338–14342. [DOI] [PMC free article] [PubMed] [Google Scholar]
- 29.Leffler, J. E. 1953. Parameters for the description of transition states. Science. 117:340–341. [DOI] [PubMed] [Google Scholar]
- 30.Mitra, A., T. D. Bailey, and A. L. Auerbach. 2004. Structural dynamics of the M4 transmembrane segment during acetylcholine receptor gating. Structure. 12:1909–1918. [DOI] [PubMed] [Google Scholar]
- 31.Mitra, A., G. D. Cymes, and A. Auerbach. 2005. Dynamics of the acetylcholine receptor pore at the gating transition state. Proc. Natl. Acad. Sci. USA. 102:15069–15074. [DOI] [PMC free article] [PubMed] [Google Scholar]
- 32.Akk, G., S. Sine, and A. Auerbach. 1996. Binding sites contribute unequally to the gating of mouse nicotinic alpha D200N acetylcholine receptors. J. Physiol. 496:185–196. [DOI] [PMC free article] [PubMed] [Google Scholar]
- 33.Akk, G., M. Zhou, and A. Auerbach. 1999. A mutational analysis of the acetylcholine receptor channel transmitter binding site. Biophys. J. 76:207–218. [DOI] [PMC free article] [PubMed] [Google Scholar]
- 34.Chakrapani, S., T. D. Bailey, and A. Auerbach. 2003. The role of loop 5 in acetylcholine receptor channel gating. J. Gen. Physiol. 122:521–539. [DOI] [PMC free article] [PubMed] [Google Scholar]
- 35.Horenstein, J., D. A. Wagner, C. Czajkowski, and M. H. Akabas. 2001. Protein mobility and GABA-induced conformational changes in GABA(A) receptor pore-lining M2 segment. Nat. Neurosci. 4:477–485. [DOI] [PubMed] [Google Scholar]
- 36.Chakrapani, S., T. D. Bailey, and A. Auerbach. 2004. Gating dynamics of the acetylcholine receptor extracellular domain. J. Gen. Physiol. 123:341–356. [DOI] [PMC free article] [PubMed] [Google Scholar]
- 37.Corradi, J., G. Spitzmaul, M. J. De Rosa, M. Costabel, and C. Bouzat. 2007. Role of pairwise interactions between M1 and M2 domains of the nicotinic receptor in channel gating. Biophys. J. 92:76–86. [DOI] [PMC free article] [PubMed] [Google Scholar]
- 38.Cymes, G. D., C. Grosman, and A. Auerbach. 2002. Structure of the transition state of gating in the acetylcholine receptor channel pore: a Φ-value analysis. Biochemistry. 41:5548–5555. [DOI] [PMC free article] [PubMed] [Google Scholar]


