Abstract
In this article, we apply a coarse-grained elastic network model (ENM) to study conformational transitions to address the following questions: How well can a conformational change be predicted by the mode motions? Is there a way to improve the model to gain better results? To answer these questions, we use a dataset of 170 pairs having “open” and “closed” structures from Gerstein's protein motion database. Our results show that the conformational transitions fall into three categories: 1), the transitions of these proteins that can be explained well by ENM; 2), the transitions that are not explained well by ENM, but the results are significantly improved after considering the rigidity of some residue clusters and modeling them accordingly; and 3), the intrinsic nature of these transitions, specifically the low degree of collectivity, prevents their conformational changes from being represented well with the low frequency modes of any elastic network models. Our results thus indicate that the applicability of ENM for explaining conformational changes is not limited by the size of the studied protein or even the scale of the conformational change. Instead, it depends strongly on how collective the transition is.
INTRODUCTION
In the current age of biological research, sequence, structure, and function have been the major focuses. Much work has been devoted to the study of how these are related. This will be increasingly the case as more genomes are sequenced and annotated. We are just at the beginning of being able to understand how the different parts of a biological system work together, and how information flows through the system and causes it to function harmoniously or aberrantly.
Recently the CASP competitions, i.e., the Critical Assessment of Techniques for Protein Structure Prediction, started back in 1994 (http://predictioncenter.org/), have driven efforts at the structure-sequence interface. It is well accepted that the three-dimensional native structure of a protein is determinable from its sequence. Another important part of protein computational research focuses on the motion: how a protein folds up in detail—the pathways, how fast it folds, the kinetics, the shape of the energy landscape, and why most proteins have a unique native fold.
Motion is equally important, if not more so, for understanding how a protein functions, given its structure. Protein functions are closely tied to their motions. Therefore, the dynamics of folded proteins is critically important for understanding the mechanisms by which they function. Many proteins make large conformational changes upon binding a ligand, for example, to realize their functions. How such a process occurs is of broad interest.
One common approach has been to apply molecular dynamics (MD) (1–3). However, similar to the limitations encountered when applying MD to protein folding, the computational demands limit its usefulness.
The fact that proteins move mostly collectively in the process of realizing their functions encourages us to look at some other approaches. As made clear by Gerstein's protein motion database (4,5), proteins demonstrate mostly large-scale hinge motions, shear motions, and some other types of motions. Therefore, instead of using MD and treating the protein system as an assemblage of interacting atoms and being limited by the system's complexity, we are motivated to look at coarser levels of modeling for an approach more appropriate to the problem.
One such approach is normal mode analysis (NMA) (6–8), which is good at studying the collective motions of macromolecules, and expresses the motions in terms of some collective variables, known as the normal modes. Researchers have found that the mode motions predicted by NMA match well with the conformational changes of a number of proteins upon ligand binding, such as hexokinase (9), lysozyme (6), citrate synthase (10), and hemoglobin (11,12). Tama et al. (13) carried out NMA on a dataset of 20 proteins, each of which has two conformations in “open” and “closed” forms. They compared the overlap between the conformational change (i.e., the displacement vector between open and closed forms) and the normal modes for each given protein, and found that for most proteins, there exists a single low-frequency normal mode that overlaps well with the conformational change. Krebs et al. (14) performed NMA of macromolecular motions in a database framework. They integrated normal mode calculations into the Macromolecular Movements Database (4,5), and found that most of 3814 known protein motions can be described well by a few low-frequency normal modes. In many cases, only one or two low-frequency normal modes are sufficient to capture the protein motions well. They also developed a new metric, mode concentration, as a useful classifier for motions. These studies support the findings that only a small number of low-frequency normal modes are sufficient to characterize protein dynamics.
Instead of using a detailed all-atom potential, Tirion (15) showed that NMA using atoms interacting with only a single parameter harmonic potential was able to reproduce well the low frequency modes of motion. Bahar et al. (16) and Hinsen (17) took the simplification one step further. They demonstrated that a single parameter harmonic potential together with a simplified protein model having only one point mass per residue was sufficient to produce the correct low frequency mode motions, a result that is supportive of the collectiveness of protein motions. Such models are now referred to as elastic network models (ENMs). Specifically, the ENM for isotropic fluctuations is usually called the Gaussian network model (18,19), where only the magnitudes of the fluctuations are considered. Its anisotropic counterpart, where both the magnitudes and directions of the collective motions are treated is called the anisotropic network model (20), and this is the model that we will use in this article.
ENMs are based on a harmonic potential so that the mode motions they produce yield only the small local fluctuations of atoms. Therefore, they are good for reproducing the temperature B-factors of proteins, usually representing small-scale fluctuations, as first demonstrated by Bahar et al., and followed by others (16,21,22). But, are they suitable for understanding the larger-scale molecular motions?
In this work, we aim to address several questions. We want to know, how large are the conformational changes that can be predicted well with the mode motions? And for the proteins exhibiting poor overlaps between conformational changes and mode motions, is there anything we can do to improve the ENM to gain better results?
To answer these questions, we use a dataset of 170 pairs of open and closed structures that were obtained from Gerstein's protein motion database (4,5) (http://www.molmovdb.org/). These protein sizes range widely from tens of residues to near a thousand residues, and their conformational displacements can be as large as 28 Å. Our results show that the conformational transitions of these 170 proteins fall into three categories: 1), the transitions that can be explained well by ENM; 2), the transitions that are not explained well by ENM but the results are significantly improved after considering the rigidity of some residue clusters and modeling them accordingly; and 3), those where the intrinsic nature of these transitions, those having a low degree of collectivity, prevents their being interpreted with the low frequency modes of elastic network models. Our results thus indicate that the applicability of ENM for explaining conformational changes is not limited by either the size of the studied protein or even by the scale of the conformational change. Instead, it depends strongly on how collective the transition is.
METHODS
Protein dataset
In this work, we use a protein dataset that is obtained from Gerstein's Macromolecular Movements Database (4,5) (http://www.molmovdb.org/). There are ∼200 pairs of structures in Gerstein's database, classified by the motion scales and types of pairwise structures. A few structures are excluded here since their PDB entries are not specified. The remained 170 pairs of structures are used in our analyses (Table 1 lists the number of proteins in each motion category). The number of pairs in each motion category ranges from 2 to 59. The 340 PDB files are downloaded from Protein Data Bank (http://www.pdb.org/). For each pair of structures, the residues that do not have corresponding partners in both structures are removed and the α-carbon coordinates are then extracted for further analysis.
TABLE 1.
Classification of protein motions in Gerstein's Database of Macromolecular Movements (4,5)
| Motion scale | Motion type | # of Pairs |
|---|---|---|
| I. Motions of fragments smaller than domains | A. Motion is predominantly shear | 11 |
| B. Motion is predominantly hinge | 21 | |
| C. Motion can not be fully classified at present | 10 | |
| D. Motion is not hinge or shear | 6 | |
| II. Domain motions | A. Motion is predominantly shear | 27 |
| B. Motion is predominantly hinge | 59 | |
| C. Motion can not be fully classified at present | 10 | |
| D. Motion is not hinge or shear | 2 | |
| E. Motion involves partial refolding of tertiary structure | 6 | |
| III. Larger movements than domain movements involving the motion of subunits | A. Motion involves an allosteric transition | 9 |
| B. Motion does not involves an allosteric transition | 4 | |
| C. Complex protein motions | 5 |
The categories in motion scale and motion type are the same as those used in the Gerstein's database.
Identifying rigid domains
Given two experimentally stable structures of a protein, our goal is to identify the relatively most rigid portions between the two structures. A number of computational methods have been developed for this purpose. In Nichols et al. (23), a difference-distance matrix-based method was proposed to determine sets of residues such that the distance between any pair of residues within the set has the same distance in the two structures. One drawback of difference-distance-based approaches is their low tolerance to the imprecision in the atomic coordinates. To overcome this, Wriggers and Schulten (24) developed a method that extracts the rigid domains by iterative superposition of the protein structures. The preserved geometry (which is used to identify domains) defined by such a superposition process is generally insensitive to the local fluctuations of individual atoms. Hinsen et al. (25) proposed an approach using the so-called “deformation energy.” The idea is that residues in the rigid regions are hardly deformed. In addition, deformation energy provides a scale of how rigid a certain region of the protein is locally. Once all the rigid residues are identified, they are then clustered to form domains. Here we present a simple method, which utilizes root mean-square deviation (RMSD) calculations. In this sense, it relates most closely to the work by Wriggers and Schulten. The idea is to separate the local fluctuations (intrinsic “noise” in the x-ray or NMR structures) from the global transitions. Since the local fluctuations are typically on a scale <1–2 Å, we define a set of residues to be rigid between the two structures if the RMSD between the two corresponding sets of coordinates is <2 Å. However, there are a significant number of transitions among the 170 pairs of proteins in our dataset whose scale (i.e., the RMSD between the open and closed forms of the protein) is ∼2 Å and or even smaller. For these protein pairs (specifically scale < 4 Å), because using a threshold of 2 Å would cause more or less the whole structure to be considered as rigid, we use a smaller threshold that is dependent on the translation scale, which is 1 Å if 2 Å ≤ scale ≤ 4 Å, 0.5 Å if 1 Å ≤ scale ≤ 2 Å, and so on.
For convenience, we make the following definitions.
Definition 1
Given two structures of the same protein, a subset of its residues is considered to form a rigid domain if the RMSD of that group between the two structures is smaller than a predefined threshold. A rigid segment is defined as a rigid group made up of consecutive residues. A smaller threshold is used in searching for rigid segments and is set to be 3/4 (a parameter) of the threshold set for defining a rigid domain.
The method has two major steps. In the first step, we calculate a set of rigid segments by comparing the two structures. In the second step, we combine the rigid segments as much as possible to form larger rigid groups. We merge two rigid groups together if and only if the combined group is still rigid by the above definition. The iteration continues until no more new rigid groups can be formed. The resulting rigid groups are then identified as the rigid domains. Note that there are usually residues that do not belong to any of these rigid groups. They normally fall into the “hinge” regions and are the ones connecting between the rigid groups. They are much more flexible in nature compared to the residues in the rigid groups. For the remainder of the article, we refer to these as hinge residues.
Algorithm A. Input: two structures of a protein. Output: a set of nonoverlapping rigid domains.
Steps:
For any i (1 ≤ i ≤ N, where N is the number of residues), find the longest rigid segment starting with residue i, i.e., find the largest j for which RMSD(Xopen(i:j), Xclosed(i:j)) < threshold. Save all these segments in a set by Q.
Create an empty set S.
Among all the segments in Q, find the longest one, remove it from Q and move it into set S. Update the remaining segments in Q so that they do not overlap with any segment in the set S. This means that some segments in Q must be shortened or discarded.
Repeat Step 3 until the set Q is empty. Return the set S.
Starting with the segments in the set S as separate rigid groups, iteratively merge them with one another to form larger rigid groups until no new groups can be formed. (At each iteration, a greedy algorithm is applied to select a pair of rigid groups to merge. The selected pair is the one that, once merged, has the smallest RMSD change between the open and closed structures than for any other choice of pairs. The iteration stops when the smallest RMSD found is larger than the preset threshold.)
Lastly, absorb as many free residues (those not in any rigid group) as possible into the rigid groups. A similar greedy algorithm to that in the previous step is used to select the best rigid group-free residue pair to merge. Again, the iteration stops when the selected rigid group would result in a RMSD larger than the preset threshold if absorbing the selected free residue. The resulting rigid groups are returned as rigid domains and the free residues as hinge residues.
The rigid groups defined by this algorithm are then considered as the rigid domains of the proteins. With such modeling, the degrees of freedom, δ, of a protein is reduced approximately from δoriginal = 3N to δreduced = 6×ndomain + 3×nhinge, where N is the protein size (the number of residues), ndomain is the number of rigid domains, and nhinge is the number of hinge residues. Compared with δoriginal, δreduced serves as a metric indicating how collective the transition between the open and closed form is, i.e., the smaller δreduced, the more collective the transition is. Indeed, δreduced/6 gives an estimate of how many rigid domains there are. In the extreme case when there is just one single rigid domain, the motion of the protein would be fully collective.
We thus define collectivity as follows:
Definition 2
The collectivity, χ, of a protein transition is defined as the inverse of δreduced/6, the estimated number of its rigid domains. In short, χ = 6/δreduced.
The collectivity thus defined is unitless and has a range of [0,1], where χ = 1 means complete collectivity, while a smaller χ means the transition is less collective.
We also define a variable to measure, on average, how many residues move together, or how large the average domain size is. We thus define concertedness as the collectivity scaled by the protein's size.
Concertedness is defined as: definition 3
The concertedness of a motion, κ, is defined as the collectivity χ times the size of the protein, i.e., κ = N × χ.
Realize that κ = N × χ = N × 6/δreduced = 2 × δoriginal/δreduced. Therefore, the concertedness κ also measures the extent of reduction in the degrees of freedom.
In the next section, we describe how to build a special kind of ENM, namely domain-ENM, once the locations of the rigid domains and hinge residues are established.
Constructing elastic network of rigid domains—domain-ENM
In Song and Jernigan (26), we presented a new way for constructing elastic network for domain-swapped proteins, which is called domain-ENM. In domain-ENM, we assign a larger spring constant for intradomain contacts. This conveniently and effectively encodes domain rigidity with a single parameter. It also enables rigid body domain motions to be separated from the low amplitude fluctuations of each rigid domain, thereby making the dominant rigid body domain motions more easily captured than with uniform ENMs.
Another way to incorporate the rigidity is to use the block normal mode analysis or the rotation-translation block method (27,28). These methods normally work by modeling a small number of consecutive residues (e.g., six residues) as a rigid block. To adapt such methods to our case where the residues within a rigid cluster are not necessarily consecutive in sequence, one may artificially reorder the residues to treat them as if they were consecutive. After the vibration modes or the fluctuation patterns of each residue are obtained, one can reconstruct the modes so that they reflect the original residue sequence order.
The improved overlap measure
The commonly used definition of “overlap” (10,13) is a measure of the similarity between the direction of global conformational displacement and the direction given by one normal mode, that is,
 |
(1) |
where Mj is the jth eigenvector and ΔX is the displacement between the open and closed forms after the two structures are superimposed.
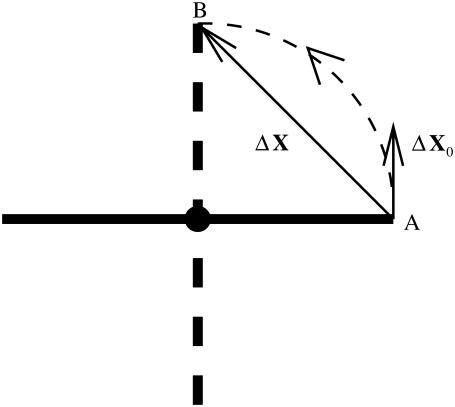
However, the global conformational displacement is a finite motion, whereas the mode motions are infinitesimal motions. The two are not directly comparable, especially when large-scale rotations are involved. In such a case, the initial motion direction, which is comparable with the mode motions, may little resemble what is depicted in the global conformational displacement (illustrated in Fig. 1) (26).
FIGURE 1.
A simple illustration of the pathway difference for a global conformational change ΔX involving a rotation and the initial moving direction ΔX0 when translation is utilized to represent a rotation, as a rigid stick rotates counterclockwise 90° from position A to B.
In light of this, in Song and Jernigan (26) we proposed a new measure for calculating overlaps for domain-swapped proteins. This improved overlap definition was originally designed for domain-swapped proteins with two distinct domains, but it can easily be extended to systems consisting of multiple rigid domains. For such a system, the global conformational change for each domain can always be expressed as
 |
(2) |
where Ti, R(ki, θi) are the translation and rotation for the ith domain, ki and θi are the rotational axis and rotational angle, Xi contains the coordinates of the residues in the ith domain relative to its center of mass, and Nr is the number of rigid domains. To make a fair comparison with the infinitesimal motions of the modes, we use an infinitesimal motion extracted from the global conformational changes in Eq. 2. In other words, we use
 |
(3) |
as the infinitesimal version of the global conformational displacement, where M is a large positive number corresponding to the step size (e.g., M = 100). For any residue m that is not in any domain, we use plain linear interpolation. Now we form a new directional vector V to obtain an approximate overlap measure. For each residue, the motion direction is
 |
(4) |
and hence the overlap is
 |
(5) |
 measures how well the two directions, the initial moving direction ΔX0 and the direction of the jth mode Mj, line up, by calculating the cosine of the angle between them. A perfect agreement in directions corresponds to an overlap value of 1.
Based on the above overlap definition, we define the maximum overlap between a conformational displacement with any mode as
 |
(6) |
We also define the cumulative square overlap (CSO) of the first k vibrational modes as
 |
(7) |
While maximum overlap indicates how the best mode overlaps with the conformational displacement, it is often helpful to use CSO of the first k modes to measure how well the first k modes together can capture the whole transition.
RESULTS AND DISCUSSION
Initial analysis of protein dataset
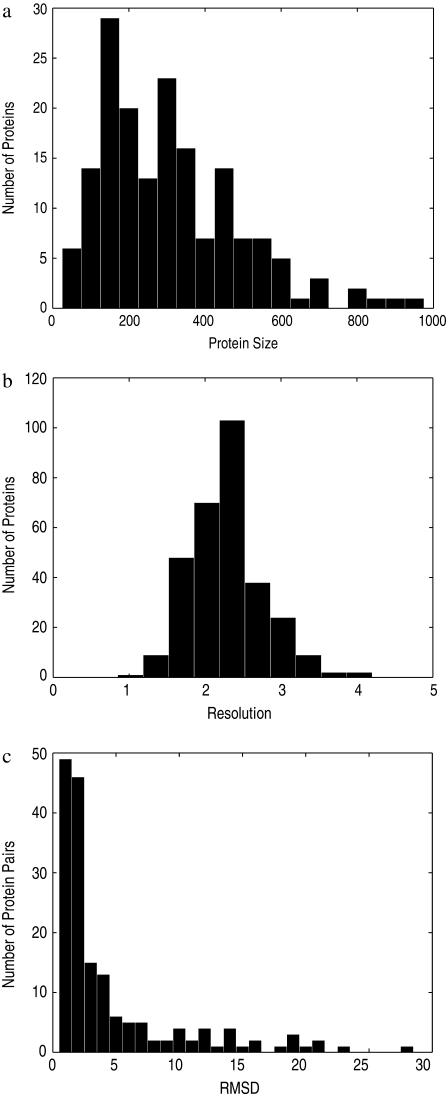
The histogram of our protein sizes is shown in Fig. 2 a. From the figure we can see that the sizes of the 170 pairs of proteins fall over a wide range, from tens of residues to near a thousand residues. Out of the total of 340 protein structures in our dataset, 34 are NMR structures. The resolutions for the remaining 306 x-ray structures are shown in Fig. 2 b, giving a mean of 2.28 Å and a standard deviation of 0.48 Å. The histogram of pairwise RMSDs is shown in Fig. 2 c. It can be seen that >50% of the pairs of structures have an RMSD value within 4 Å.
FIGURE 2.
Characterization of the protein dataset: distributions of protein sizes, resolutions, and pairwise RMSDs. (a) Histogram of protein sizes. (b) Histogram of protein resolutions for x-ray structures. (c) Histogram of pairwise RMSDs.
The 170 transitions analyzed
Before we apply a mode analysis method to interpret the transitions, it is important for us to analyze these transitions first to gain a better understanding of the characteristics of these transitions, especially the collectivity (Definition 2). This is because for all mode analysis methods, they all aim to describe the motions using a small number of collective variables, i.e., the low frequency modes, from fine-grained all-atom models to coarse-grained models that, for example, represent each residue with its α-carbon only (as is usually with ENM). For a motion to be well described with a small number of collective variables, it is necessary that the motion is intrinsically highly collective.
While neither the displacement between the open and closed forms nor the motion direction as defined in Eq. 4 directly tells us how collective a transition is, the collectivity we have defined above (see Definition 2) does. It gives us a simple measure of how likely residues are to move together, or separately. This intrinsic property of the transition thus poses an inherent limit on how well any NMA-like method, even before it is applied, can interpret the transition. For transitions with low collectivity, mode analysis methods have little chance of performing well. While for those transitions that do display large collectivity, there is clearly the possibility that a properly chosen mode analysis method could provide an excellent representation of how the transition may take place. How to choose a proper model in such a case will be addressed later.
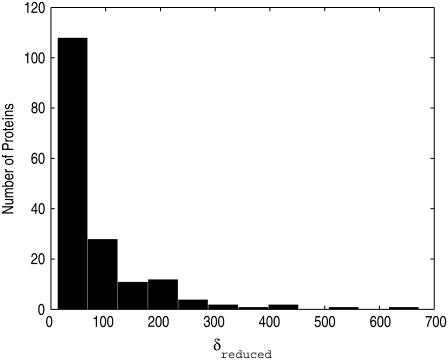
For many proteins, the intrinsic nature of their transitions are not collective. This is demonstrated in Fig. 3, which shows the reduced degrees of freedom δreduced of the proteins. As we can see, some significant number of proteins still possess high degrees of freedom, indicting that the level of collectivity for their transitions is quite low.
FIGURE 3.
Histogram of the reduced degrees of freedom δreduced. There are some proteins that possess high degrees of freedom, and thus low collectivity, although most have <100 degrees of freedom.
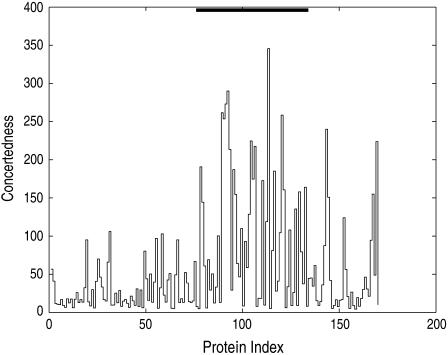
Besides the collectivity of a transition, we are also interested in knowing the average number of residues that move together collectively, i.e., the concertedness as in Definition 3. Fig. 4 shows the dimensionality reduction, or concertedness of all 170 transitions after rigid domains are identified and modeled accordingly. We can see from this figure that there is a large dimensionality reduction (concertedness), especially for domain hinge motions.
FIGURE 4.
Concertedness of conformational transitions for 170 pairs of proteins. For category II.B (see Table 1) the domain hinge motions (with proteins indexed from 76 to 134, are marked by the black bar at the top of the figure), there typically exists a higher concertedness than for the other motion classes.
With the inherent limit to mode representations in mind, we are now ready to explore how we may best explain the transitions.
How large a conformational change can be predicted by mode motions?
Tama and Sanejouand (13) looked at the open and closed structures of 20 proteins and studied the overlap of the mode most involved in the conformational changes. Krebs et al. (14) performed NMA on the Macromolecular Movements Database (4,5), and found that most of the 3814 known protein motions can be described well by a small number of low-frequency normal modes. These works relate to the previous works by Harrison (9), Brooks and Karplus (6), Gibrat and Gō (29), and Marques and Sanejouand (10) with the findings that a low frequency mode motion, but not necessarily the very lowest one, compares well with the conformational changes that these proteins make upon ligand binding.
One question that naturally arises is, how large a conformational change can the mode motion predict well? Is there a limit? Since the modes are based on the local equilibrium vibrations of a structure, it is reasonable to expect that the motions predicted by modes are only locally meaningful. And one may reasonably doubt any attempt to use mode motions to analyze large-scale conformational transitions, say over 10 Å, or even 5 Å.
Using the dataset of 170 pairs of open and closed structures that we created based on Gerstein's Database (4,5), with the scale of conformational changes ranging from <1 Å to 28 Å (see Fig. 2 c), we are ready to look into this question. Based on a previous study by Tama and Sanejouand (13), the normal modes calculated from the open form generally have better overlap with the conformational change than those obtained from the closed form. In this article, we only show results for the normal modes obtained from the open form. We also did the same analysis using the normal modes calculated from the closed form and the results are quite similar to those obtained from the open form (see Supplementary Materials).
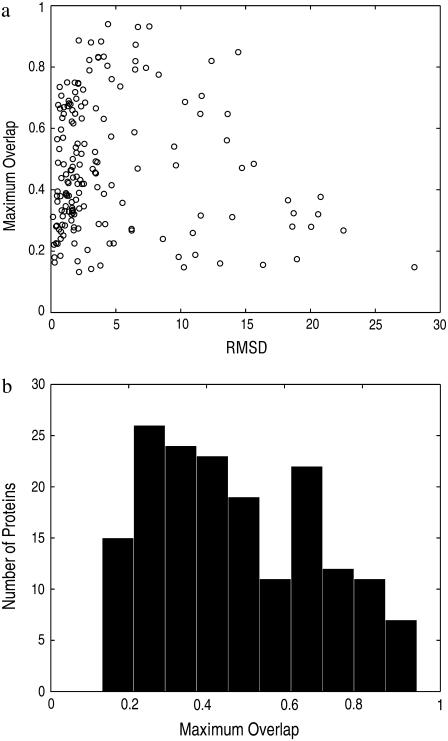
Fig. 5 a shows the distribution of the best overlaps versus the scale of conformational changes (i.e., RMSD between the open and close structures). From the figure we can see that the overlap is quite significant even for a number of proteins having large conformational displacements. Fig. 5 b displays the histogram of the best overlaps found for each protein. One can see that there are a significant number of proteins with overlaps >0.7, though more proteins have overlaps <0.5.
FIGURE 5.
Maximum overlaps using ENM. (a) Maximum overlap as a function of the transition scale, the RMSD between the open and closed structures. (b) Histogram of maximum overlaps.
Though one may expect that as the scale of conformational displacement increases, the quality of the match (in terms of overlap values) would decrease, this is not evident from Fig. 5 a. Even though the overlap value for the last few proteins (with largest conformational changes) is relative small, there are too few of them to draw such a strong conclusion. Instead, the data suggest that, up to ∼15 Å, the mode motions can perform fairly well in interpreting the conformational transitions.
However, for many other proteins, we do see that the overlap between conformational changes and mode motions is rather small (say, <0.5). We are prompted to ask whether such poor overlaps are due to any inappropriateness in how the proteins are modeled or something more intrinsic, such as the inherent collectivity of the transition as discussed earlier. The answer to this question will help us determine the applicability and limits of ENMs in understanding conformational transitions. In the following sections, we will show how an enhanced ENM can significantly improve the overlap values for some proteins, while for some others, the intrinsic nature of their conformational transitions prevent their displacements from being explained by low-frequency, collective-mode motions.
Dimensionality reduction: proteins move as rigid domains
In our previous study of domain-swapped proteins (26), one key conclusion we arrived at is that to better understand the large-scale domain-swapping motions, it is helpful to take domain rigidity into account and to apply the more appropriate overlap calculation that was first proposed in Song and Jernigan (26) and extended here to systems having multiple rigid domains. With this in mind, we use Algorithm A (see Methods) to identify rigid domains and then apply domain-ENM (see Methods) to study all the transitions. Table 2 lists the average dimensionality reduction (or concertedness) for the different motion types. One notable point is that for hinge domain motions (category II.B), the concertedness is apparently higher than for other groups.
TABLE 2.
Analyses of the conformational transitions by the motion types
| Motion type | I. Fragments | II.A Shear | II.B Hinge | II. Other | III. |
|---|---|---|---|---|---|
| Number of pairs (170 total) | 48 | 27 | 59 | 18 | 18 |
| Concertedness (κ) | 23.9 | 37.4 | 99.7 | 51.8 | 46.0 |
| Reduced DOF*δreduced (6/χ) | 81 | 107 | 68 | 79 | 113 |
| Original maximum overlap | 0.37 | 0.50 | 0.59 | 0.38 | 0.43 |
| Improved maximum overlap | 0.50 | 0.58 | 0.67 | 0.46 | 0.50 |
| Original CSO(20) | 0.35 | 0.53 | 0.67 | 0.42 | 0.46 |
| Improved CSO(20) | 0.56 | 0.70 | 0.79 | 0.61 | 0.60 |
The numbers shown are the mean values over all the structure pairs in each motion type.
Degree of freedom.
Consequently, we see significant improvements in the overlap values for a large percentage of protein pairs, and this is true even for those structure pairs having large conformational displacements. Table 2 shows that there is a significant increase in the maximum overlap and CSO for all motion types, all with a similar extent of improvement. The apparent reason why results for domain hinge motions (category II.B) do not have a more significant improvement than the other types of motions, despite their larger dimensionality deduction, is that some of the concertedness of these transitions have already been captured by the uniform ENM. This is confirmed by their apparent larger overlap values even before domain rigidity is taken into account.
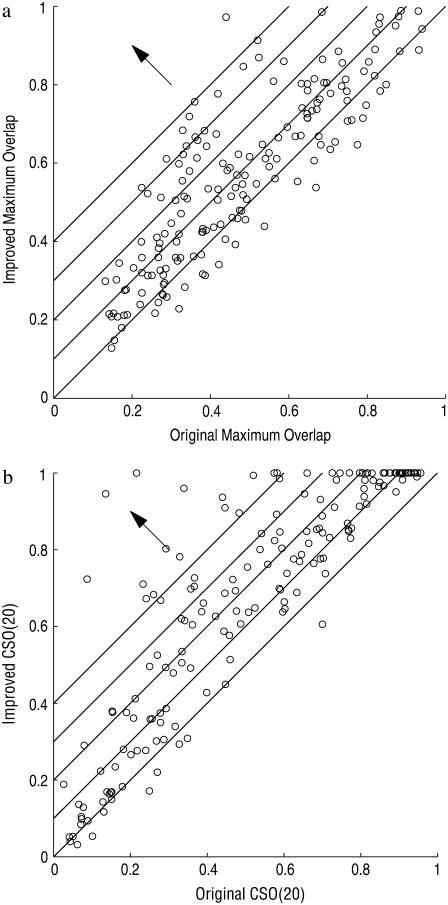
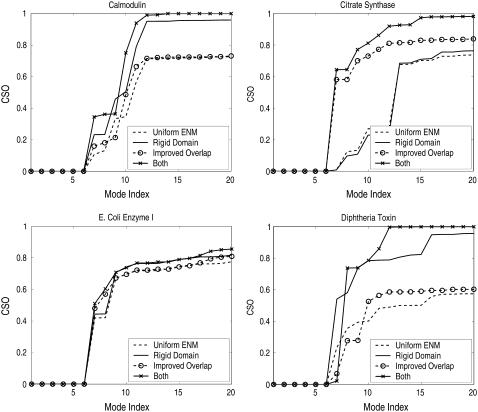
Fig. 6, a and b, compare the scatter plots of the maximum overlaps and CSOs from uniform ENM (without domain rigidity) and domain-ENM (with domain rigidity) calculations. From the figures we can see that for most protein pairs, domain-ENM is able to improve overlap (maximum overlap and CSO) by a significant amount. Fig. 7 gives a few examples of proteins with their CSO distributions. It is seen clearly that both rigid domain modeling and the improved overlap definition need to be applied to achieve a truly significant improvement.
FIGURE 6.
Comparison of the new model (domain-ENM) with the old (uniform ENM). (a) Scatter plot of the maximum overlaps. (b) Scatter plot of the CSO(20)s. The lines, along the direction of the arrow, indicate where the increasing scales of improvement are.
FIGURE 7.
Cumulative square overlaps (CSOs) for some proteins using different models: uniform ENM, ENM with rigid domains, ENM with the improved overlap definition (see Eq. 5), and ENM with both rigid domains and the improved overlap definition (i.e., domain-ENM). The first six modes account for the rigid body translation and rotation of the system.
Why certain residues form a rigid group and how rigid the group is are not easy to discern. Our analysis of domain-swapped proteins (26) implied that the rigidity comes from strong hydrophobic interactions and hydrogen bonding, which is the basis of the FIRST rigidity analysis method (30). As explained in Methods, here we determine the rigid groups within a protein by directly comparing its open and closed structures. For simplicity and consistency with the coarse-grained ENM, we assign a uniform, but larger, spring constant for the contacts within all rigid domains without considering their specific, detailed interactions (26).
Where ENM fails: the limitation of using mode motions to study conformational transitions
Despite the improvement in overlap values that comes from domain-ENM, there remains a significant number of proteins whose overlap values remains small. This is reflected in the points at the lower-left corner of Fig. 6, a and b. For these protein pairs and their transitions, neither uniform ENM nor domain-ENM is able to produce modes that have large overlaps with their conformational displacements. Is there an intrinsic reason for this? From our earlier analysis, we can more or less guess the answer—that the low frequency modes from ENMs are good at describing only the collective motion of a system, but not localized, uncorrelated motions. Therefore, those points with small overlap values probably correspond to proteins exhibiting noncollective transitions.
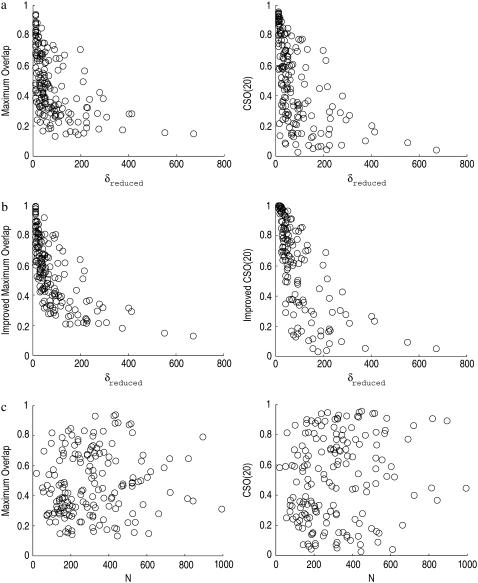
This intuition is confirmed in Fig. 8, which shows the correlations between the overlaps (maximum overlap and CSO) and the inverse of collectivity (δreduced) for both uniform ENM and domain-ENM (which uses the improved overlap definition), as well as the correlations between the overlaps and the protein size. In contrast to the fact that there is little correlation (∼0.1) between the overlap and the protein size (Fig. 8 c), there is a strong correlation between the overlap and the inverse of collectivity for both uniform ENM and domain-ENM (Fig. 8, a and b).
FIGURE 8.
Relationship between the overlap (maximum overlap or CSO(20)) and δreduced (the inverse of collectivity) using the original overlap definition and ENM (a), the improved overlap definition and domain-ENM (b), and their dependence on protein size N (c). There is a strong correlation between overlap and collectivity (0.49 and 0.55 in a and 0.65 and 0.70 in b, from left to right), while there is almost no correlation between the overlap and the protein size (0.11 and 0.16 in c, from left to right).
For ENM, the correlation values are ∼0.5 (0.49 between the maximum overlap and δreduced and 0.55 between CSO(20) and δreduced). It is remarkable that ENM, with a uniform spring constant, is able to capture the potential collective behavior of a protein rather accurately from a single structure (see Fig. 8 a). This suggests it might be possible to use ENM to identify protein domains (31).
Domain-ENM is a better model than ENM when the rigidity of domains can be determined and explicitly taken into account in the model (as is the case here) and is more suited for studying the collective motions of a protein. Indeed, we see much better correlations between the overlaps and the inverse of collectivity (0.65 between the maximum overlap and δreduced and 0.70 between CSO(20) and δreduced) in Fig. 8 b. This strong correlation between the overlap and the inverse of the collectivity demonstrates that it is the inherent collectivity of a transition that limits the effectiveness of using normal modes to interpret protein conformational transitions—it is neither the size of the protein, nor the scale of the conformational transition that matters, since both have low correlations (see Figs. 8 c and 5 a). Note that a similar conclusion could be drawn from the results of ENM (especially Fig. 8 a). However, for ENM it would be less conclusive because the correlation between the overlap and the collectivity is obscured to some extent by the inaccurateness of the modeling, especially since the stronger interactions within a domain are not explicitly treated.
It is useful to predict the collectivity of a protein from a single structure (here it is done by comparing two structures). Then for the proteins with high collectivity, we might be able to use ENM (or domain-ENM) for the reliable prediction of their conformational transitions.
CONCLUSIONS
In this article we have carried out a study on a large protein dataset (170 pairs of open and closed protein structures) to investigate how well conformational changes can be explained with normal mode motions. Our results show that the 170 pairs of structures and their conformational transitions fall into three categories: 1), the transitions of these proteins can be explained well by the uniform ENM; 2), the transitions cannot be explained well by the uniform ENM but the results are significantly improved after considering the rigidity of domains and modeling it accordingly; and 3), those where the intrinsic nature of these transitions, i.e., low degree of collectivity, prevents them from being explained with the low-frequency modes of either ENM.
Our results indicate that the applicability of ENM for explaining conformational changes is not limited by either the size of the protein studied or even by the scale of the conformational change. Therefore, the answer to the question posed in the title of this article—how well we can understand large-scale molecular motions using normal modes—really depends strongly on how collective the motion is. As shown in this article, the collectivity of a transition can be estimated by comparing the open and closed forms of the studied protein. The collective nature of ENM low-frequency modes makes it unsuitable for explaining noncollective transitions. Perhaps an investigation of packing densities and atomic interactions could be used to predict the collectivity of a structure (32,33).
For this reason, ENMs show extremely promising results for understanding large-scale, collective motions, such as that of the ribosome (34). Yet on the other hand, it is not an appropriate method in simulating protein folding, since that process is not always collective (35,36).
SUPPLEMENTARY MATERIAL
An online supplement to this article can be found by visiting BJ Online at http://www.biophysj.org.
Supplementary Material
Editor: Robert Callender.
References
- 1.Rahman, A. 1964. Correlations in the motion of atoms in liquid argon. Phys. Rev. A. 136:405–411. [Google Scholar]
- 2.Stillinger, F. H., and A. Rahman. 1974. Improved simulation of liquid water by molecular dynamics. J. Chem. Phys. 60:1545–1557. [Google Scholar]
- 3.McCammon, J. A., B. R. Gelin, and M. Karplus. 1977. Dynamics of folded proteins. Nature. 267:585–590. [DOI] [PubMed] [Google Scholar]
- 4.Gerstein, M., and W. Krebs. 1998. A database of macromolecular motions. Nucleic Acids Res. 26:4280–4290. [DOI] [PMC free article] [PubMed] [Google Scholar]
- 5.Flores, S., N. Echols, D. Milburn, B. Hespenheide, K. Keating, J. Lu, S. Wells, E. Z. Yu, M. Thorpe, and M. Gerstein. 2006. The database of macromolecular motions: new features added at the decade mark. Nucleic Acids Res. 34:D296–D301. [DOI] [PMC free article] [PubMed] [Google Scholar]
- 6.Brooks, B., and M. Karplus. 1985. Normal modes for specific motions of macromolecules: application to the hinge-bending mode of lysozyme. Proc. Natl. Acad. Sci. USA. 82:4995–4999. [DOI] [PMC free article] [PubMed] [Google Scholar]
- 7.Brooks, C. L., M. Karplus, and B. M. Pettitt. 1988. Proteins: a theoretical perspective of dynamics, structure, and thermodynamics. Adv. Chem. Phys. 71:1–249. [Google Scholar]
- 8.Case, D. A. 1994. Normal mode analysis of protein dynamics. Curr. Opin. Struct. Biol. 4:285–290. [Google Scholar]
- 9.Harrison, R. W. 1984. Variational calculation of the normal modes of a large macromolecule: methods and some initial results. Biopolymers. 23:2943–2949. [DOI] [PubMed] [Google Scholar]
- 10.Marques, O., and Y. H. Sanejouand. 1995. Hinge-bending motion in citrate synthase arising from normal mode calculations. Proteins. 23:557–560. [DOI] [PubMed] [Google Scholar]
- 11.Perahia, D., and L. Mouawad. 1995. Computation of low-frequency normal modes in macromolecules: improvements to the method of diagonalization in a mixed basis and application to hemoglobin. Comput. Chem. 19:241–246. [DOI] [PubMed] [Google Scholar]
-
12.Xu, C., D. Tobi, and I. Bahar. 2003. Allosteric changes in protein structure computed by a simple mechanical model: hemoglobin T
 R2 transition. J. Mol. Biol. 333:153–168. [DOI] [PubMed] [Google Scholar]
 - 13.Tama, F., and Y. H. Sanejouand. 2001. Conformational change of proteins arising from normal mode calculations. Protein Eng. 14:1–6. [DOI] [PubMed] [Google Scholar]
- 14.Krebs, W. G., V. Alexandrov, C. A. Wilson, N. Echols, H. Yu, and M. Gerstein. 2002. Normal mode analysis of macromolecular motions in a database framework: developing mode concentration as a useful classifying statistic. Proteins. 48:682–695. [DOI] [PubMed] [Google Scholar]
- 15.Tirion, M. M. 1996. Large amplitude elastic motions in proteins from a single-parameter, atomic analysis. Phys. Rev. Lett. 77:1905–1908. [DOI] [PubMed] [Google Scholar]
- 16.Bahar, I., A. R. Atilgan, and B. Erman. 1997. Direct evaluation of thermal fluctuations in proteins using a single-parameter harmonic potential. Fold. Des. 2:173–181. [DOI] [PubMed] [Google Scholar]
- 17.Hinsen, K. 1998. Analysis of domain motions by approximate normal mode calculations. Proteins. 33:417–429. [DOI] [PubMed] [Google Scholar]
- 18.Haliloglu, T., I. Bahar, and B. Erman. 1997. Gaussian dynamics of folded proteins. Phys. Rev. Lett. 79:3090–3093. [Google Scholar]
- 19.Bahar, I., A. R. Atilgan, M. C. Demirel, and B. Erman. 1998. Vibrational dynamics of folded proteins: significance of slow and fast motions in relation to function and stability. Phys. Rev. Lett. 80:2733–2736. [Google Scholar]
- 20.Atilgan, A. R., S. R. Durell, R. L. Jernigan, M. C. Demirel, O. Keskin, and I. Bahar. 2001. Anisotropy of fluctuation dynamics of proteins with an elastic network model. Biophys. J. 80:505–515. [DOI] [PMC free article] [PubMed] [Google Scholar]
- 21.Haliloglu, T., and I. Bahar. 1999. Structure-based analysis of protein dynamics: comparison of theoretical results for hen lysozyme with x-ray diffraction and NMR relaxation data. Proteins. 37:654–667. [DOI] [PubMed] [Google Scholar]
- 22.Kundu, S., J. S. Melton, D. C. Sorensen, and G. N. Phillips, Jr. 2002. Dynamics of proteins in crystals: comparison of experiment with simple models. Biophys. J. 83:723–732. [DOI] [PMC free article] [PubMed] [Google Scholar]
- 23.Nichols, W. L., G. D. Rose, L. F. T. Eyck, and B. H. Zimm. 1995. Rigid domains in proteins: an algorithmic approach to their identification. Proteins. 23:38–48. [DOI] [PubMed] [Google Scholar]
- 24.Wriggers, W., and K. Schulten. 1997. Protein domain movements: detection of rigid domains and visualization of hinges in comparisons of atomic coordinates. Proteins. 29:1–14. [PubMed] [Google Scholar]
- 25.Hinsen, K., A. Thomas, and M. J. Field. 1999. Analysis of domain motions in large proteins. Proteins. 34:369–382. [PubMed] [Google Scholar]
- 26.Song, G., and R. L. Jernigan. 2006. An enhanced elastic network model to represent the motions of domain-swapped proteins. Proteins. 63:197–209. [DOI] [PubMed] [Google Scholar]
- 27.Tama, F., F. X. Gadea, O. Marques, and Y. H. Sanejouand. 2000. Building-block approach for determining low-frequency normal modes of macromolecules. Proteins. 41:1–7. [DOI] [PubMed] [Google Scholar]
- 28.Li, G., and Q. Cui. 2002. A coarse-grained normal mode approach for macromolecules: an efficient implementation and application to Ca2+-ATPase. Biophys. J. 83:2457–2474. [DOI] [PMC free article] [PubMed] [Google Scholar]
- 29.Gibrat, J. F., and N. Go. 1990. Normal mode analysis of human lysozyme: study of the relative motion of the two domains and characterization of the harmonic motion. Proteins. 8:258–279. [DOI] [PubMed] [Google Scholar]
- 30.Jacobs, D. J., A. J. Rader, L. A. Kuhn, and M. F. Thorpe. 2001. Protein flexibility predictions using graph theory. Proteins. 44:150–165. [DOI] [PubMed] [Google Scholar]
- 31.Kundu S, Sorensen D. C., and Phillips G. N. Jr. 2004. Automatic domain decomposition of proteins by a Gaussian network model. Proteins. 57:725–733. [DOI] [PubMed] [Google Scholar]
- 32.Bagci, Z., R. L. Jernigan, and I. Bahar. 2002. Residue coordination in proteins conforms to the closest packing of spheres. Polym. 43:451–459. [Google Scholar]
- 33.Bagci, Z., R. L. Jernigan, and I. Bahar. 2002. Residue packing in proteins: uniform distribution on a coarse-grained scale. J. Chem. Phys. 116:2269–2276. [Google Scholar]
- 34.Wang, Y., A. J. Rader, I. Bahar, and R. L. Jernigan. 2004. Global ribosome motions revealed with elastic network model. J. Struct. Biol. 147:302–314. [DOI] [PubMed] [Google Scholar]
- 35.Sadqi, M., D. Fushman, and V. Munõz. 2006. Atom-by-atom analysis of global downhill protein folding. Nature. 442:317–321. [DOI] [PubMed] [Google Scholar]
- 36.Kelly, J. W. 2006. Proteins downhill all the way. Nature. 442:255–256. [DOI] [PubMed] [Google Scholar]
Associated Data
This section collects any data citations, data availability statements, or supplementary materials included in this article.


