Abstract
Synaptic vesicles (SVs) are small neuronal organelles that store neurotransmitters and release them by exocytosis into the synaptic cleft for signal transmission between nerve cells. They consist of a highly curved membrane composed of different lipids containing several proteins with specific functions. A family of abundant extrinsic SV proteins, the synapsins, interact with SV proteins and phospholipids and play an important role in the regulation of SV trafficking and stability. We investigated the interactions of one these proteins with the SV membrane using atomic force microscope and dynamic light scattering. We examined SVs isolated from rat forebrain both under native conditions and after depletion of endogenous synapsin I. We used the atomic force microscope in two modes: imaging mode for characterizing the shape and size of SVs, and force-volume mode for characterizing their stiffness. Synapsin-depleted SVs were larger in size and showed a higher tendency to aggregate than native vesicles, although their stiffness was not significantly different. Because synapsins are believed to cross-link SV to each other and to the actin cytoskeleton, we also measured the SV aggregation kinetics induced by synapsin I by dynamic light scattering and atomic force microscopy and found that the addition of synapsin I promotes a rapid aggregation of SVs. The data indicate that synapsin directly affects SV stability and aggregation state and support the physiological role of synapsins in the assembly and regulation of SV pools within nerve terminals.
INTRODUCTION
From the beginning of the 1990s, the atomic force microscope (AFM) (1) was successfully used for the characterization of biological and soft samples (2–4), in addition to its classical applications on hard surfaces (5,6). It allows the morphological and mechanical study of biological specimens under physiological conditions with a resolution that ranges from tens of micrometers to below tens of nanometers (7–12). This makes it a powerful tool to investigate cells or subcellular structures that are not easily resolved with a light microscope and would be denatured by the use of an electron microscope due to sample preparation procedures (13,14). Moreover, by operating the AFM in force-volume (FV) mode, information on the mechanical properties of natural or artificial, flat or otherwise shaped samples can be obtained (15–20).
Dynamic light scattering (DLS) allows one to measure size distributions of particles of any shape in the submicrometer range without further calibration or extended knowledge of the dispersive phase, except its viscosity.
These two tools seem therefore to be suitable for the investigation of small synaptic vesicles (SVs), spherical organelles located at the nerve terminals that store and release neurotransmitters and participate in synaptic transmission between neurons (for reviews, see (21,22)). Two types of SVs exist in neurons: i), small SVs, characterized by a surprisingly homogeneous size of ∼50 nm in diameter, store and release small neurotrasmitter molecules (classical neurotransmitters including glutamate, GABA, or acetylcholine) accounting for the vast majority of SVs and present in virtually all nerve terminals; and ii), large dense-core vesicles (LDCV), characterized by a larger and variable size of 100–300 nm in diameter, store and release neuropeptides(23).
A number of AFM studies addressing certain aspects of SVs have been published in the last few years. Parpura et al. imaged SVs purified from rat brain and sea-snail, having diameters ranging from 50 to 150 nm, on a polylysine-coated glass slide in contact mode, and found that the shape of the vesicles changed with the ionic strength of the buffer solution (24). This was also shown by Garcia et al., who imaged vesicles of the electric organ of the torpedo fish, having diameters ranging from 90 to 130 nm, in tapping mode (25). Laney et al. analyzed similar vesicles by acquiring force curves in FV mode in different buffer solutions, and found that Young's modulus increased upon addition of calcium to the buffer (26). Other works dealt with the influence of acetaldehyde on synaptosomes (27), or monitored binding events between nerve terminal structures and proteins bound to the tip of an AFM cantilever (28,29).
In nerve terminals, SVs are organized in distinct functional pools, namely a large reserve pool (RP) in which SVs are restrained by the actin-based cytoskeleton, an active recycling pool, and a quantitatively smaller readily releasable pool (RRP) in which SVs are free to approach the active zone at the presynaptic membrane and eventually fuse with it upon stimulation(2,30). A prominent role in the regulation of this process is played by the synapsins, a family of abundant SV-associated phosphoproteins (31–33). The vertebrate synapsin family comprises at least three genes (synapsins I, II, and III), and alternative splicing gives rise in neurons to at least five distinct protein isoforms (synapsins Ia, Ib, IIa, IIb, and IIIa) that share large parts of their primary structure. Synapsins bind to SVs and actin, and are both necessary and sufficient for the reversible attachment of SVs to actin filaments. Synapsins bind to both the phosholipid and protein components of the SV membrane (34–36). The binding to phospholipids involves both electrostatic and hydrophobic interactions with the surface and the core of the bilayer, respectively, and this interaction is accompanied by the formation and stabilization of extended phospholipid bilayers (35,37). In addition synapsin exhibits a high surface activity and a noticeable tendency to self-associate forming homo- and heterodimers (38,39).
These in vitro observations, together with an array of in vivo studies, have led to a model in which the synapsins tether SVs to each other and/or to cytoskeletal components in the presynaptic nerve terminal, thereby regulating the availability of SVs for exocytosis. Several studies showed that the impairment of synapsin function, either by antibody or peptide injection into nerve cells (40–44) or by creating synapsin knockout mice (45–47), reduced the number of SVs at the synaptic cleft, and, as a consequence, altered synaptic transmission particularly during periods of sustained high frequency activity of the presynaptic neuron (48). The ability of synapsin to cluster phospholipid vesicles and to stabilize phospholipid bilayers by inhibiting the transition from the stable lamellar phase to the inverted hexagonal phase induced by temperature or calcium suggests the possibility that these effects may be apparent also with the more complex SV membrane and that they could confer additional mechanical stability to the SV membrane, as shown by AFM studies on clathrin for cellular vesicles (20), or on S-layer proteins for the membrane of bacterial cells (49).
In this work we wanted to compare the morphology, the mechanical properties, the aggregation state, and the aggregation kinetics of authentic SVs purified from rat forebrain in the presence and absence of endogenous synapsin. To this end, we used native untreated synaptic vesicles (USVs) saturated with endogenous synapsin I and synapsin-depleted SVs (SSVs) from which ∼90% of the endogenous synapsin was dissociated by mild dilution/ionic strength treatment (50). The second type of vesicles was used to mimic native vesicles of synapsin I knockout mice. We used the AFM in imaging mode for characterizing morphology and size of single and clustered SVs deposited onto a polylysine-coated mica surface, and in FV mode for characterizing the SV stiffness. We established a method to probe SVs in a nondestructive way, using a low loading force and deforming SVs only elastically, so that they remained intact after being compressed by the AFM tip. We further used DLS for characterizing SV size and aggregation kinetics in bulk solution. According to previous results obtained by fluorometric binding assays in pure phospholipid liposomes, the addition of synapsin causes the vesicles to aggregate within some seconds (51). We wanted to investigate if this effect also occurs with native SVs in a bulk solution.
MATERIALS AND METHODS
All chemicals were purchased from Carl Roth GmbH (Darmstadt, Germany), or from Sigma-Aldrich GmbH (Seelze, Germany) and were of reagent grade or better.
Purification of synaptic vesicles
Synaptic vesicles were obtained from rats by homogenization of the isolated forebrains and finally purified through the step of controlled-pore glass (CPG) chromatography (50). After elution, purified SVs were centrifuged for 2 h at 175,000 × g and resuspended at a protein concentration of 1–2 mg/ml in 0.3 M glycine, 5 mM HEPES, 0.02% sodium azide, pH 7.4 (glycine buffer). Endogenous synapsin I was quantitatively removed from SVs by diluting them immediately after elution from the column with an equal volume of 0.4 M NaCl. After 2 h of incubation on ice, SVs were centrifuged for 2 h at 175,000 × g and resuspended in glycine buffer as described above. The extent of association of synapsins with SVs after this procedure was assessed by SDS polyacrylamide gel electrophoresis and immunoblotting, as previously described (34,36).
Sample preparation
Freshly cleaved mica sheets (Plano GmbH, Wetzlar, Germany) were coated with poly-D-lysine (0.1 mg/ml, Sigma Aldrich), dried, and then glued with superglue (UHU GmbH, Bühl, Germany) on specimen steel disks (Ted Pella, Redding, CA). Afterwards, 50 μl of a suspension containing SVs at a protein concentration of 4 μg/ml in glycine buffer were pipetted on such a disk, and the sample was incubated for 1 h on ice. The sample was thoroughly rinsed with glycine buffer to wash off the unspecifically adsorbed SVs and inserted into the AFM liquid cell for the measurements.
Instrumentation
Images and force curves were acquired with a Multimode AFM with a Nanoscope IIIa Controller (Veeco Instruments, Santa Barbara, CA) and the corresponding liquid cell. Measurements were performed using silicon nitride cantilevers with a very low nominal spring constant of 0.006 N/m (Bio-Lever, Olympus, Tokyo, Japan). The true spring constants were determined by the thermal noise method (52,53). The radii of curvature of the tips were determined by scanning electron microscopy (SEM) before the experiments, and ranged from 10 to 25 nm. AFM images were acquired in contact mode at constant load, by adjusting the force to ∼1 nN. FV maps consisted of two-dimensional arrays of 32 × 32 or 16 × 16 force curves acquired in the FV mode, for which we used “relative triggering” and set the maximum force to ∼0.4 nN, corresponding to a maximum cantilever deflection of ∼60 nm. A Zetasizer 3000HS (Malvern Instruments, Malvern, UK) was used for all DLS measurements. The experiments were performed at 25°C, at a constant angle of 90°, and with a laser wavelength of 633 nm. The volume of the sample was 200 μl and the concentration of SV proteins was ∼75 μg/ml.
METHODS
In AFM imaging the tip of a cantilever is scanned line-by-line over a defined area of the sample in the fashion of a two-dimensional array. The tip tracks the topography and thus the height of the sample surface, and this information is stored for each point of the array.
The FV mode is a method where the tip of the cantilever scans the sample as in AFM imaging, and additionally acquires a force curve at each point of the two-dimensional array. The topographic information, i.e., the height of SVs, is recorded as the displacement of the piezo-scanner needed to attain a certain cantilever deflection. Comparison of the topography with the force curves allows matching the surface features to the mechanical properties of the sample.
In DLS the diffusion velocity (Brownian motion) of the particles is optically measured. Then, via the diffusion coefficient the effective hydrodynamic radius is calculated according to the Stokes-Einstein relation (54,55).
RESULTS AND DISCUSSION
Shape and size determination of native and synapsin-depleted SVs by DLS and AFM
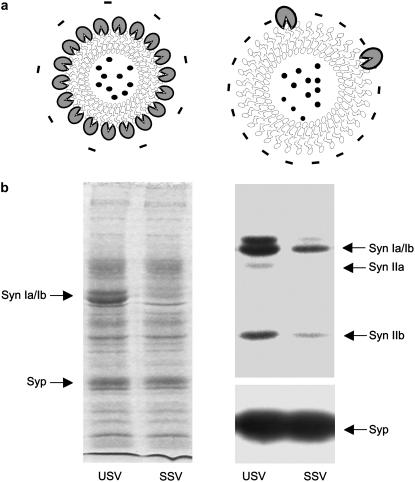
After a highly specific purification procedure, which excludes the copurification of other cellular organelles and proteins (50,56), USVs were diluted in a solution containing 150 mM NaCl. Protein staining and immunostaining with antisynapsin antibodies revealed that, over 90% of synapsin I is removed from the SV membrane and is released into the solution by this procedure (Fig. 1).
FIGURE 1.
(a) Schematics of the two types of SVs investigated. (Left) Native synaptic vesicles (USV) coated with synapsin I (blue). (Right) Synaptic vesicles depleted of endogenous synapsin I (SSV) by dilution in physiological salt solution (150 mM NaCl). (b) Protein pattern of USV and SSV preparations. (Left) Aliquots of USV and SSV purified from rat forebrain through the step of controlled pore-glass chromatography (10 μg protein) were separated by SDS-polyacrylamide gel electrophoresis (9% acrylamide in the resolving gel) and stained with Coomassie brilliant blue. Arrows point to the synapsin Ia/Ib doublet (Syn, 80–86 kDa) that is lost in SSV and to the integral SV protein synaptophysin (Syp, 38 kDa) that is preserved in SSV. (Right) Immunoblot analysis of the same SV preparations using antibodies specific for all synapsin isoforms (Syn Ia/Ib, Syn IIa, and Syn IIb; upper panel) and for synaptophysin (Syp, lower panel).
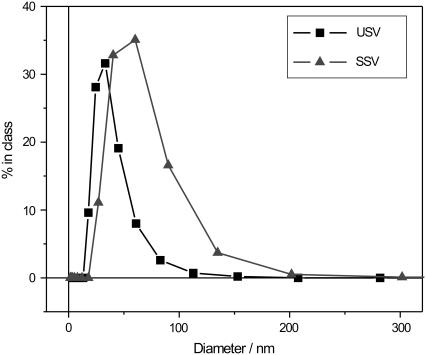
DLS measurements on the two types of vesicles showed that USVs have diameters ranging from 25 to 45 nm in solution. The distribution curve has a tail extending to diameters above 50 nm, which might indicate that a small number of SVs are larger, or that two or more SVs are clustered and form aggregates (Fig. 2). On the contrary, SSVs appear to be larger with diameters ranging from 40 to 70 nm in solution. The tail of the distribution curve extends up to 200 nm, also indicating the presence of either bigger SVs, assemblies of several smaller SVs, or both.
FIGURE 2.
Size distributions of SVs in solution as measured by dynamic light scattering (DLS).
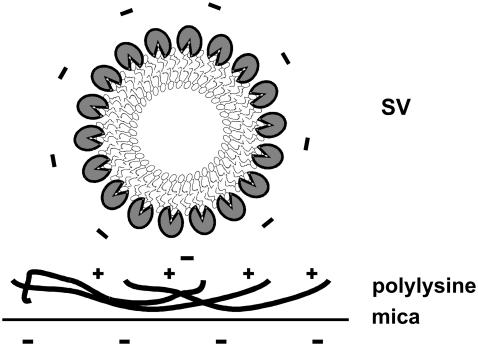
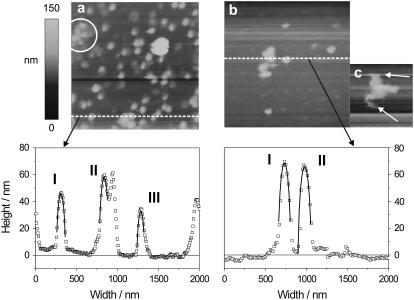
As a substrate for the AFM measurements, we used polylysine-coated mica sheets, onto which SVs adsorbed. USVs and SSVs bound mostly electrostatically to the polylysine layer because of their negative surface charge (Fig. 3), and the binding was so strong that SVs could not be displaced by the scanning AFM tip, neither during imaging nor during force-curve acquisition. The use of soft cantilevers allowed us a nondestructive imaging of SVs at small forces in contact mode. When evaluating SV morphology from AFM measurements, one has to be aware that the structures in an image are convoluted with the radii of the tips (24). The vertical dimension corresponds to the true height, whereas a rule of thumb states that the lateral dimensions are augmented by around twice the tip radius, if tip and structures are of comparable size. This is true in our case, where radii of tips and vesicles are of the same order of magnitude. In Fig. 4 we show and compare two representative images of 2 × 2 μm size acquired on USVs (Fig. 4 a) and SSVs (Fig. 4 b), along with two representative profiles. The two images were acquired with the same tip. We fitted circles to the SV profiles (red lines in the plot), and found results similar to those obtained with the DLS measurements and, in addition, we verified that SVs kept their hemispherical shape when adsorbed on the hard surface. We fitted the radii of curvature of several SVs from several images, and obtained RUSV = 55 ± 15 nm and RSSV = 81 ± 15 nm. Taking into account that the tip radius was 22.5 nm and subtracting twice this value from the SV's radius, we obtained values only slightly larger than by DLS. Moreover, SSVs were nearly twice the size of USVs.
FIGURE 3.
Negatively charged mica is coated with positively charged poly-D-lysine to bind the negatively charged SVs to the surface.
FIGURE 4.
Representative AFM height images (above) and profiles (below), acquired in contact mode with a scan size of 2 × 2 μm. (a) USV, with three representative fitted radii: RI = 57 nm, RII = 59 nm, RIII = 54 nm. (b) SSV, with fitted radii of: RI = 78 nm, RII = 84 nm. (c) Cluster of SSV's, image scan size is 1 × 1 μm, white arrows show deformation due to aggregation and scanning.
A further observation was that USVs uniformly covered the polylysine-coated mica surface, whereas we could not see a similar uniform coverage with SSVs. Although both types of SVs were dispensed from a solution having similar concentration, only a smaller number of SSVs adsorbed onto the surface. In theory, the basic synapsin should neutralize the net negative charge of SV phospholipids and therefore weaken the interaction with polylysine, whereas here the opposite was observed. Moreover, USVs showed a lower tendency to cluster as compared to SSVs, although aggregates could be formed. One possible explanation for the reduced adsorption might be a different surface adsorption kinetics between smaller and disperse vesicles (USV) and larger vesicle aggregates (SSV). However, when adsorbed, USVs kept their hemispherical shape, as can be observed inside the circle in Fig. 4 a. Conversely, SSVs formed larger aggregates in which it was difficult to discern the single vesicles inside the clusters, because they were more easily moved and deformed by contact with the AFM tip during scanning, especially at the border of aggregates (see arrows in Fig. 4 c). This suggests that the presence of synapsin I, although it partially neutralizes the surface charge of the vesicles, may stabilize the surface and help to prevent massive aggregation, as was also observed for phospholipid bilayers on mica (37,57).
Stiffness measurements with the AFM in FV mode
The AFM in FV mode allows one to obtain information on the mechanical properties of samples by acquiring a two-dimensional array of deflection curves over a defined region, thus “mapping” the stiffness in that area of the sample. We calculated the stiffness (of substrate and vesicles) from the acquired deflection curves in the limit of small sample deformations. Along the contact line, i.e., the part of the deflection curve where tip and sample are in contact, the sample deformation D is given by the following (17)
 |
(1) |
where Z is the piezo-displacement and δ is the cantilever deflection. If D is small, we can write
 |
(2) |
where kc and ks are the cantilever and sample elastic constants. This simple relation shows that the slope of the approach deflection curve is an indicator of the stiffness of the sample. If the sample is much stiffer than the cantilever, i.e., ks ≫ kc, the deflection curve will probe mainly the stiffness of the cantilever, i.e., keff ≅ kc. If the sample is much more compliant than the cantilever, i.e., ks ≪ kc, the slope of the approach contact line is determined primarily by the stiffness of the sample, i.e., keff ≅ ks. In the following, we calculate the stiffness as the ratio
 |
(3) |
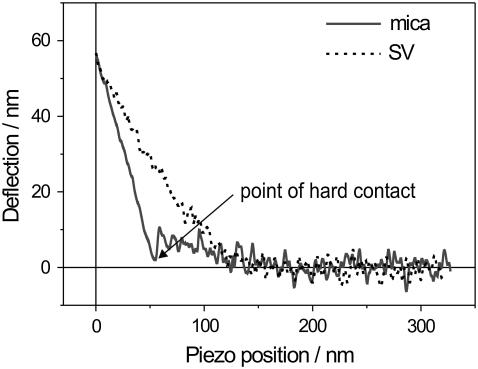
between Z and δ. Therefore, S is dimensionless and 0 < S < 1. An example of two typical deflection curves, acquired on the polylysine-coated mica substrate and at the center of a native vesicle, is presented in Fig. 5. The mica substrate cannot be indented by the tip, the slope of the curve is maximum, and we take it as our reference for stiffness S = 1. The soft vesicle, on the other hand, is easily indented by the tip, the slope of the curve is smaller, and thus its stiffness is S < 1.
FIGURE 5.
Two typical cantilever-deflection versus piezo-position curves, acquired on the polylysine-coated mica substrate (dashed line) and at the center of a SV (solid line). Both curves were triggered to a deflection of ∼60 nm, corresponding to a maximum load of ∼0.4 nN, and are part of a 32 × 32 FV map.
When the force needed to pierce the polylysine layer is trespassed, the tip jumps into direct “hard contact” with the mica, and from that point on the curve is linear. This allows us to clearly distinguish between the “before-contact” and the “after-contact” parts of the curve. Conversely, the slope of the curve on the vesicle is smoothly increasing, with no jump marking the point of contact. This makes it hard to distinguish between the “before-contact” and the “after-contact” part.
Synaptic vesicles before and after the force-volume scan
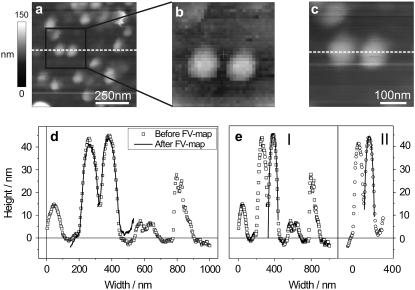
By using one of the softest available cantilever types, we could record images in contact mode without displacing or destroying the organelles. We started to acquire large images and then zoomed in stepwise, until we could take a FV map of only a few SVs or even a single SV. After acquisition of the force curves, we rescanned the sample in imaging mode to verify that the SVs were not displaced or destroyed by the tip. This control was of primary importance for our purpose of indenting SVs only in the limit of small deformations, or more precisely in the elastic regime. We could thus exclude that the sample was deformed plastically, or permanently. This implies that the stiffness we measured was directly related to the Young's modulus of the synaptic vesicles. In Fig. 6 a, a representative image of SVs acquired before the FV scan is shown. SVs had a height of ∼45 nm and were spherical, as we verified by fitting their profiles with circular segments. After zooming in on two adjacent SVs, we acquired a FV map of 32 × 32 force curves over an area of 400 × 400 nm, the topography map of which is shown in Fig. 6 b. After the force scan, which required ∼30 min, we acquired a second image of the two SVs (Fig. 6 c) and compared the two profiles by superposing them in one graph (Fig. 6 d). They matched quite accurately, especially the width, whereas the height slightly decreased. We also determined the radius of curvature of one SV before and after the FV scan (Fig. 6 e), and it did not change significantly: RI = 57 nm, RII = 61 nm. According to these observations, we could conclude that the measurement was nondestructive to the vesicles, that the tip did not displace them, that they recovered their shape after the indentations, keeping a stable morphology for a prolonged period of time.
FIGURE 6.
Series of AFM images showing: (a) contact mode AFM height image of USV before the FV scan; (b) height image acquired during the FV scan, with a resolution of 32 × 32 data points; (c) contact mode AFM height image after the FV scan; (d) matching of the two profiles (dashed white lines) from panels a and c; (e) circular fits (solid red lines) to the two profiles: RI = 57 nm, RII = 61 nm.
Stiffness data analysis
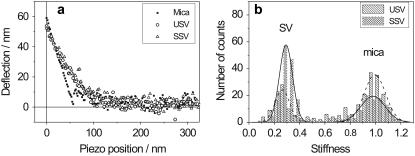
The results, representative for almost all FV maps acquired on both SV types, are displayed in Fig. 7. The force curves were triggered to ∼60 nm, which corresponded to a maximum load of ∼0.4 nN. Three curves, acquired at selected positions, are shown in Fig. 7 a: the slope of the curves taken on the SVs is smaller than that of the curve taken on the polylysine-coated mica, which means that also the stiffness, and thus Young's modulus, is smaller. Moreover, the two curves obtained on USVs and SSVs were very similar, suggesting a similar stiffness. This conclusion was confirmed by the evaluation of whole FV maps instead of single curves. The histograms in Fig. 7 b show the stiffness distribution according to two 16 × 16 FV maps, one acquired on USVs, and the second on SSVs: both histograms have a peak around S = 1, which is the stiffness of mica, and peaks at S = 0.265 and S = 0.290 for USVs and SSVs, respectively. The FV map corresponding to the USVs was from one vesicle and was acquired over an area of 300 nm2. The SV-free area was larger than the area covered by the SV, therefore the peak around 1 is higher than the peak around 0.265. The FV map corresponding to SSVs was acquired over an area of 200 nm2, also on one vesicle. The SV-free area was smaller than the area covered by the SV, therefore the peak around 1 is smaller than the peak around 0.290. Although the experiments were repeated several times, the difference in stiffness between the two types of SVs was always smaller than the experimental error intrinsic to our measurements. Moreover, we did not observe a dependence between the measured stiffness and the size of the SVs. Delorme et al. (58) found that smaller vesicles showed a higher measured stiffness as compared to larger vesicles. These authors used artificial vesicles with radii ranging from ∼60 to ∼150 nm, while the radii of the two types of native vesicles we used were not that different: ∼20 nm for the USVs and ∼30 nm for the SSVs.
FIGURE 7.
(a) Approach force curves acquired at three different places, on polylysine-coated mica (▪), at the center of a USV (○), and at the center of a SSV (▵). (b) Histogram of the stiffness values for both SV types and for mica.
In summary, the above presented results indicate that depleting native SVs from their synapsin coating i), caused them to expand in size, ii), reduced the electrostatic repulsion among vesicles and favored the formation of clusters, but iii), did not affect their stiffness, at least not in a measure that we could detect by our technique. Thus, whereas the size expansion can be attributable, at least partly, to lipid packing defects that may follow the stripping of synapsin, under physiological conditions the net positive charge of synapsin I seems to convey a stabilizing surface charge to the SVs, rather than stabilizing them mechanically, and to prevent nonspecific aggregation and random fusion events.
We can calculate the Young's modulus for the two types of SVs, according to a shell theory model presented by Delorme et al. (58):
 |
(4) |
where kSV is the stiffness of the vesicle, calculated by multiplying its dimensionless stiffness S with the spring constant kc of the cantilever, R is the radius of curvature of the vesicle, d is the thickness, and v is the Poisson's ratio of the vesicle membrane. Assuming realistic parameter values (kSV = 0.2 pN/nm, R = 25 nm, d = 5 nm, and v = 0.5), an estimation of the Young's modulus of E = 75 kPa is obtained, which is indeed close to values presented in literature (26).
Synapsin I is a surface-active molecule that forms monomolecular layers on top of solid-supported phospholipid bilayers, thereby mechanically stabilizing them and making them less prone to be pierced by an AFM tip (37,57). This led to the assumption that synapsin I might also reinforce the membrane of SVs, particularly since other proteins are known either to form a stabilizing cage around vesicles, like, e.g., clathrin (20), or to crystallize on their surface, like, e.g., the bacterial S-layer proteins (49). On the other hand, we found that both types of vesicles we investigated presented a similar stiffness. This might indicate that synapsin I is neither forming a closed crystalline layer on the vesicles, nor that the molecules interact in a reinforcing manner with each other. In fact, according to estimations from crystal structure (39) one synapsin I molecule covers an area of ∼18 nm2. Although synapsin binding studies suggested that an SV can allocate at saturation up to 30 molecules of synapsin at the cytoplasmic interface (1,56), recent studies suggested that 8–9 synapsin molecules may be associated with an average SV (22). Even assuming the higher estimate, synapsin molecules will cover only ∼20% of the surface of a USV with a diameter of 30 nm, too little for us to measure its effect, whereas in the case of Pera et al. and Murray et al. (37,57) synapsin I covered almost entirely the phospholipid bilayer.
Influence of synapsin I on vesicles in bulk solution by DLS and AFM
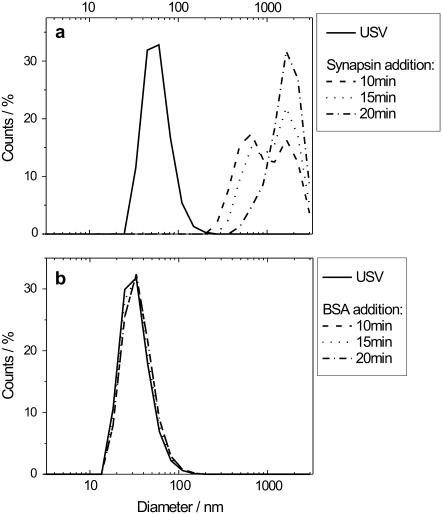
Next we wanted to verify the influence of synapsin I on the aggregation of native SVs, and determine the kinetics of this process and its selectivity to this specific protein. To this end we performed DLS measurements, under standard conditions and at room temperature, on pure SVs suspensions, on suspensions with added purified synapsin I (size 80 kDa), and on suspensions with added bovine serum albumine (BSA). We used the latter protein as a control protein of comparable size (67 kDa), that should not trigger the aggregation. Solution containing USVs (200 μl), at a protein concentration of 40 μg/ml, was placed in the sample holder and let equilibrate for 10 min before measurement. After the first measurement, we slowly added 8 μg of either synapsin I or BSA to the suspension by a pipette, to prevent severe perturbations in the liquid that would then disturb the light scattering measurement. We then let the solution equilibrate for a time between 2 and 5 min before starting the second measurement. Before the addition of the proteins, the SVs were clearly monodisperse, with a diameter of ∼50 nm (Fig. 8 a). Upon addition of synapsin I, the SVs began to cluster, and eventually formed aggregates bigger than 1 μm after ∼20 min. At intermediate times, multiple peaks were visible. After 10 min two peaks at 500 and 1500 nm of similar height were present, whereas at 15 min the former peak became smaller and the latter became larger. The addition of the same amount of BSA did not cause any clustering, as we expected, and the SVs remained monodispersed and of the same size (Fig. 8 b). The aggregation was thus triggered by a specific interaction between synapsin I and SVs.
FIGURE 8.
DLS data of USVs before and after the addition of either synapsin I or BSA. (a) Synapsin I, SVs are monodisperse with a diameter of 50 nm under basal conditions, and aggregate to clusters >1 μm upon the addition of synapsin I. (b) BSA, vesicles remain monodisperse and do not aggregate over time.
Immediately after the DLS measurements, we pipetted 50 μl of each of the two vesicle suspensions on polylysine-coated mica substrates, let them incubate for 30 min, and then acquired images in contact mode AFM. In the case of SVs with added synapsin I, a close-packed layer of aggregates of SVs covered large areas of the polylysine-coated mica (Fig. 9 a). The cross section of the aggregates shows a height of ∼30 nm and a width of several hundreds of nanometers. On the contrary, the images acquired on SVs with added BSA showed mostly single dispersed vesicles (Fig. 9 b). These images were acquired with a tip with a smaller radius of curvature (∼10 nm), therefore also the radii of the SVs appear smaller than those shown in Fig. 4. The evaluation of several SVs yielded radii of curvature ranging from 30 to 80 nm. The larger variance of the measured sizes was probably due to the longer time that passed before imaging, and to the previous treatment of this batch of vesicles. Both AFM images provide similar data as obtained with DLS. This combination of methods proves interesting for further interaction studies between SVs and proteins, because it allows one to monitor processes taking place in bulk solution, and afterwards the direct imaging of the structures formed.
FIGURE 9.
AFM topography images of the samples previously analyzed by DLS. (a) Closed SVs layer, or large aggregates, due to the addition of synapsin I to the USV suspension. (b) Control experiment with BSA and single, monodisperse SVs. The radius of curvature of the SV in the inset (red circular arc) is R = 30.2 nm.
The results further indicate that synapsin I is responsible for the aggregation of SVs. The fact that USVs that carry synapsin I on their membrane did not show a strong tendency to cluster may be attributable to the electrostatic repulsion among SVs, which is capable of stabilizing them, and to the nearly total absence of synapsin I free in solution by virtue of its very high binding affinity (34,35,56). When the exogenous synapsin I is added to the suspension, the additional synapsin molecules, owing to their multiple SV binding sites (34,35,59) and a high potential to form dimers through the highly conserved central domain C (39,60) bind to each other and to the SVs, promoting SV clustering. The control experiment with the addition of BSA showed in fact that the clustering process resulted from a specific interaction between synapsin I and SVs.
CONCLUSIONS
Synapsins are a family of SV-associated phosphoproteins implicated in the regulation of neurotransmitter release and synapse formation. Synapsins bind to SV and actin and are both necessary and sufficient for the reversible attachment of SVs to actin filaments. These observations have led to a model in which the synapsins tether SVs to each other and/or to cytoskeletal components in the presynaptic nerve terminal, thereby regulating the availability of SVs for exocytosis. In this work we compared the morphology, the mechanical properties, the aggregation state, and the aggregation kinetics of two types of SVs: we used native synaptic vesicles (USVs) associated with endogenous synapsin I, and vesicles that were depleted of their synapsin surface layer (SSVs).
We used the AFM in imaging mode for characterizing the morphology and the size of single and clustered SVs adsorbed on a polylysine-coated mica surface, and in FV mode for characterizing their stiffness. We established a method to probe SVs in a nondestructive way, using low loading forces and deforming SVs only elastically, so that they remained intact after being compressed by the AFM tip. We further used DLS for characterizing the size and the aggregation state of USV and SSV, and for monitoring the aggregation kinetics of USV in bulk solution after the addition of synapsin I.
We found that USV have a spherical shape with diameters ranging from 25 to 45 nm, and they are highly monodisperse. SSV have larger diameters, ranging from 40 to 70 nm, and they have a broader size distribution. Moreover, the stiffness of both types of SVs is similar, at least in the range of our experimental accessibility, and their Young's modulus is ∼75 kPa. Although synapsin I has been reported to inhibit the transition of pure phospholipid membranes from the lamellar to the inverted hexagonal phase induced by temperature or Ca2+ (61), our observations suggest that synapsin I does not stabilize mechanically the SV membrane such as the membrane proteins of bacteria do by building a crystal layer that protects the cell (49).
Synapsin I, bearing a net positive charge with a pI over 10, seems to convey a stabilizing surface charge to the SVs suspended under physiological pH conditions. This property could prevent nonspecific aggregation and random fusion events of SVs in vivo and, at the same time, control the clustering process. The removal of synapsin I abolished this stabilizing effect and, as a result, SSVs had an increased tendency to cluster. Thus, the clear-cut decrease in the number of SVs observed in nerve terminals of synapsin knockout mice (45–47,62,63) may depend rather on the loss of the synapsin stabilizing effect, than on the poor mechanical properties of the SV membrane.
Acknowledgments
We thank Anna Fassio, Brunero Cappella, Markus Wolkenhauer, and Hans-Jürgen Butt for helpful discussions and proofreading. For technical support with the AFM we thank Rüdiger Berger and Uwe Rietzler. For assistance and discussions concerning DLS we thank Florian Schwager and Werner Steffen. For the force curve evaluation software we thank Michael Kappl. We also thank Roberto Raiteri and Rüdiger Berger for advancing the project with technical discussions.
This work was supported by the Max-Planck Society (A.-K.A. and E.B.) and by grants from AIRC (to F.B.), Fisher Center for Alzheimer's Disease Research (to F.B.), and Italian Ministry of Research (FIRB 2001, PRIN 2004, and PRIN 2005 grants to F.B. and F.O.). The financial support of Telethon-Italy (grant No. GGP05134 to F.B.) is gratefully acknowledged. We also thank the DAAD (Vigoni D/04/42051) for the funding of the research periods in Genoa.
Editor: Petra Schwille.
References
- 1.Binnig, G., C. F. Quate, and C. Gerber. 1986. Atomic force microscope. Phys. Rev. Lett. 56:930–933. [DOI] [PubMed] [Google Scholar]
- 2.Butt, H. J., E. K. Wolff, S. A. C. Gould, B. D. Northern, C. M. Peterson, and P. K. Hansma. 1990. Imaging cells with the atomic force microscope. J. Struct. Biol. 105:54–61. [DOI] [PubMed] [Google Scholar]
- 3.Butt, H. J., K. H. Downing, and P. K. Hansma. 1990. Imaging the membrane-protein bacteriorhodopsin with the atomic force microscope. Biophys. J. 58:1473–1480. [DOI] [PMC free article] [PubMed] [Google Scholar]
- 4.Radmacher, M., R. W. Tillmann, M. Fritz, and H. E. Gaub. 1992. From molecules to cells: imaging soft samples with the atomic force microscope. Science. 257:1900–1905. [DOI] [PubMed] [Google Scholar]
- 5.Drake, B., C. B. Prater, A. L. Weisenhorn, S. A. C. Gould, T. R. Albrecht, C. F. Quate, D. S. Cannell, H. G. Hansma, and P. K. Hansma. 1989. Imaging crystals, polymers, and processes in water with the atomic force microscope. Science. 243:1586–1589. [DOI] [PubMed] [Google Scholar]
- 6.Martin, Y., C. C. Williams, and H. K. Wickramasinghe. 1987. Atomic force microscope force mapping and profiling on a sub 100-a scale. J. Appl. Phys. 61:4723–4729. [Google Scholar]
- 7.Engel, A., and D. J. Muller. 2000. Observing single biomolecules at work with the atomic force microscope. Nat. Struct. Biol. 7:715–718. [DOI] [PubMed] [Google Scholar]
- 8.Bustamante, C., S. B. Smith, J. Liphardt, and D. Smith. 2000. Single-molecule studies of DNA mechanics. Curr. Opin. Struct. Biol. 10:279–285. [DOI] [PubMed] [Google Scholar]
- 9.Scheuring, S., D. Fotiadis, C. Moller, S. A. Muller, A. Engel, and D. J. Muller. 2001. Single proteins observed by atomic force microscopy. Single Molecules. 2:59–67. [Google Scholar]
- 10.Hansma, H. G. 2001. Surface biology of DNA by atomic force microscopy. Annu. Rev. Phys. Chem. 52:71–92. [DOI] [PubMed] [Google Scholar]
- 11.Fotiadis, D., S. Scheuring, S. A. Muller, A. Engel, and D. J. Muller. 2002. Imaging and manipulation of biological structures with the AFM. Micron. 33:385–397. [DOI] [PubMed] [Google Scholar]
- 12.Defranchi, E., E. Bonaccurso, M. Tedesco, M. Canato, E. Pavan, R. Raiteri, and C. Reggiani. 2005. Imaging and elasticity measurements of the sarcolemma of fully differentiated skeletal muscle fibres. Microsc. Res. Tech. 67:27–35. [DOI] [PubMed] [Google Scholar]
- 13.Hansma, H. G., K. J. Kim, D. E. Laney, R. A. Garcia, M. Argaman, M. J. Allen, and S. M. Parsons. 1997. Properties of biomolecules measured from atomic force microscope images: a review. J. Struct. Biol. 119:99–108. [DOI] [PubMed] [Google Scholar]
- 14.Janshoff, A., and C. Steinem. 2001. Scanning force microscopy of artificial membranes. ChemBioChem. 2:799–808. [DOI] [PubMed] [Google Scholar]
- 15.Ricci, D., M. Tedesco, and M. Grattarola. 1997. Mechanical and morphological properties of living 3T6 cells probed via scanning force microscopy. Microsc. Res. Tech. 36:165–171. [DOI] [PubMed] [Google Scholar]
- 16.Fery, A., F. Dubreuil, and H. Mohwald. 2004. Mechanics of artificial microcapsules. N. J. Phys. 6:18. [Google Scholar]
- 17.Butt, H. J., B. Cappella, and M. Kappl. 2005. Force measurements with the atomic force microscope: technique, interpretation and applications. Surf. Sci. Rep. 59:1–152. [Google Scholar]
- 18.Ralston, J., I. Larson, M. W. Rutland, A. A. Feiler, and M. Kleijn. 2005. Atomic force microscopy and direct surface force measurements (IUPAC technical report). Pure Appl. Chem. 77:2149–2170. [Google Scholar]
- 19.Bonaccurso, E., B. Cappella, and K. Graf. 2006. Local mechanical properties of plasma treated polystyrene surfaces. J. Phys. Chem. B. 110:17918–17924. [DOI] [PubMed] [Google Scholar]
- 20.Jin, A. J., K. Prasad, P. D. Smith, E. M. Lafer, and R. Nossal. 2006. Measuring the elasticity of clathrin-coated vesicles via atomic force microscopy. Biophys. J. 90:3333–3344. [DOI] [PMC free article] [PubMed] [Google Scholar]
- 21.Bonanomi, D., F. Benfenati, and F. Valtorta. 2006. Protein sorting in the synaptic vesicle life cycle. Prog. Neurobiol. 80:177–217. [DOI] [PubMed] [Google Scholar]
- 22.Takamori, S., M. Holt, K. Stenius, E. A. Lemke, M. Gronborg, D. Riedel, H. Urlaub, S. Schenck, B. Brugger, P. Ringler, S. A. Muller, B. Rammner, et al. 2006. Molecular anatomy of a trafficking organelle. Cell. 127:831–846. [DOI] [PubMed] [Google Scholar]
- 23.Navone, F., P. Greengard, and P. Decamilli. 1984. Synapsin-I in nerve-terminals: selective association with small synaptic vesicles. Science. 226:1209–1211. [DOI] [PubMed] [Google Scholar]
- 24.Parpura, V., R. T. Doyle, T. A. Basarsky, E. Henderson, and P. G. Haydon. 1995. Dynamic imaging of purified individual synaptic vesicles. Neuroimage. 2:3–7. [DOI] [PubMed] [Google Scholar]
- 25.Garcia, R. A., D. E. Laney, S. M. Parsons, and H. G. Hansma. 1998. Substructure and responses of cholinergic synaptic vesicles in the atomic force microscope. J. Neurosci. Res. 52:350–355. [DOI] [PubMed] [Google Scholar]
- 26.Laney, D. E., R. A. Garcia, S. M. Parsons, and H. G. Hansma. 1997. Changes in the elastic properties of cholinergic synaptic vesicles as measured by atomic force microscopy. Biophys. J. 72:806–813. [DOI] [PMC free article] [PubMed] [Google Scholar]
- 27.Liopo, A., O. Chumakova, I. Zavodnik, A. Andreyeva, M. Bryszewska, and S. Chizhik. 2001. The response of the neuronal membrane to acetaldehyde treatment. Cell. Mol. Biol. Lett. 6:265–269. [PubMed] [Google Scholar]
- 28.Sritharan, K. C., A. S. Quinn, D. J. Taatjes, and B. P. Jena. 1998. Binding contribution between synaptic vesicle membrane and plasma membrane proteins in neurons: an AFM study. Cell Biol. Int. 22:649–655. [DOI] [PubMed] [Google Scholar]
- 29.Yersin, A., H. Hirling, P. Steiner, S. Magnin, R. Regazzi, B. Huni, P. Huguenot, P. De Los Rios, G. Dietler, S. Catsicas, and S. Kasas. 2003. Interactions between synaptic vesicle fusion proteins explored by atomic force microscopy. Proc. Natl. Acad. Sci. USA. 100:8736–8741. [DOI] [PMC free article] [PubMed] [Google Scholar]
- 30.Rizzoli, S. O., and W. J. Betz. 2005. Synaptic vesicle pools. Nat. Rev. Neurosci. 6:57–69. [DOI] [PubMed] [Google Scholar]
- 31.Greengard, P., F. Valtorta, A. J. Czernik, and F. Benfenati. 1993. Synaptic vesicle phosphoproteins and regulation of synaptic function. Science. 259:780–785. [DOI] [PubMed] [Google Scholar]
- 32.Hilfiker, S., V. A. Pieribone, A. J. Czernik, H. T. Kao, G. J. Augustine, and P. Greengard. 1999. Synapsins as regulators of neurotransmitter release. Philos. Trans. R. Soc. Lond. B Biol. Sci. 354:269–279. [DOI] [PMC free article] [PubMed] [Google Scholar]
- 33.Ho, M. F., M. Bahler, A. J. Czernik, W. Schiebler, F. J. Kezdy, E. T. Kaiser, and P. Greengard. 1991. Synapsin-I is a highly surface-active molecule. J. Biol. Chem. 266:5600–5607. [PubMed] [Google Scholar]
- 34.Benfenati, F., M. Bahler, R. Jahn, and P. Greengard. 1989. Interactions of synapsin-I with small synaptic vesicles: distinct sites in synapsin-I bind to vesicle phospholipids and vesicle proteins. J. Cell Biol. 108:1863–1872. [DOI] [PMC free article] [PubMed] [Google Scholar]
- 35.Benfenati, F., P. Greengard, J. Brunner, and M. Bahler. 1989. Electrostatic and hydrophobic interactions of synapsin-I and synapsin-I fragments with phospholipid-bilayers. J. Cell Biol. 108:1851–1862. [DOI] [PMC free article] [PubMed] [Google Scholar]
- 36.Benfenati, F., F. Valtorta, J. L. Rubenstein, F. S. Gorelick, P. Greengard, and A. J. Czernik. 1992. Synaptic vesicle associated Ca2+/calmodulin-dependent protein kinase II is a binding protein for synapsin I. Nature. 359:417–420. [DOI] [PubMed] [Google Scholar]
- 37.Pera, I., R. Stark, M. Kappl, H. J. Butt, and F. Benfenati. 2004. Using the atomic force microscope to study the interaction between two solid supported lipid bilayers and the influence of synapsin I. Biophys. J. 87:2446–2455. [DOI] [PMC free article] [PubMed] [Google Scholar]
- 38.Hosaka, M., and T. C. Sudhof. 1999. Homo- and heterodimerization of synapsins. J. Biol. Chem. 274:16747–16753. [DOI] [PubMed] [Google Scholar]
- 39.Esser, L., C. R. Wang, M. Hosaka, C. S. Smagula, T. C. Sudhof, and J. Deisenhofer. 1998. Synapsin I is structurally similar to ATP-utilizing enzymes. EMBO J. 17:977–984. [DOI] [PMC free article] [PubMed] [Google Scholar]
- 40.Humeau, Y., N. Vitale, S. Chasserot-Golaz, J. L. Dupont, G. W. Du, M. A. Frohman, M. F. Bader, and B. Poulain. 2001. A role for phospholipase D1 in neurotransmitter release. Proc. Natl. Acad. Sci. USA. 98:15300–15305. [DOI] [PMC free article] [PubMed] [Google Scholar]
- 41.Hilfiker, S., F. E. Schweizer, H. T. Kao, A. J. Czernik, P. Greengard, and G. J. Augustine. 1998. Two sites of action for synapsin domain E in regulating neurotransmitter release. Nat. Neurosci. 1:29–35. [DOI] [PubMed] [Google Scholar]
- 42.Hilfiker, S., F. Benfenati, F. D. R. Doussau, A. C. Nairn, A. J. Czernik, G. J. Augustine, and P. Greengard. 2005. Structural domains involved in the regulation of transmitter release by synapsins. J. Neurosci. 25:2658–2669. [DOI] [PMC free article] [PubMed] [Google Scholar]
- 43.Fassio, A., D. Merlo, J. Mapelli, A. Menegon, A. Corradi, M. Mete, S. Zappettini, G. Bonanno, F. Valtorta, E. D'Angelo, and F. Benfenati. 2006. The synapsin domain E accelerates the exo-endocytotic cycle of synaptic vesicles in cerebellar Purkinje cells. J. Cell Sci. 119:4257–4268. [DOI] [PubMed] [Google Scholar]
- 44.Pieribone, V. A., O. Shupliakov, L. Brodin, S. Hilfikerrothenfluh, A. J. Czernik, and P. Greengard. 1995. Distinct pools of synaptic vesicles in neurotransmitter release. Nature. 375:493–497. [DOI] [PubMed] [Google Scholar]
- 45.Takei, Y., A. Harada, S. Takeda, K. Kobayashi, S. Terada, T. Noda, T. Takahashi, and N. Hirokawa. 1995. Synapsin I deficiency results in the structural change in the presynaptic terminals in the murine nervous system. J. Cell Biol. 131:1789–1800. [DOI] [PMC free article] [PubMed] [Google Scholar]
- 46.Li, L., L. S. Chin, O. Shupliakov, L. Brodin, T. S. Sihra, O. Hvalby, V. Jensen, D. Zheng, J. O. McNamara, P. Greengard, and P. Andersen. 1995. Impairment of synaptic vesicle clustering and of synaptic transmission, and increased seizure propensity, in synapsin I-deficient mice. Proc. Natl. Acad. Sci. USA. 92:9235–9239. [DOI] [PMC free article] [PubMed] [Google Scholar]
- 47.Rosahl, T. W., D. Spillane, M. Missler, J. Herz, D. K. Selig, J. R. Wolff, R. E. Hammer, R. C. Malenka, and T. C. Sudhof. 1995. Essential functions of synapsin-I and synapsin-Ii in synaptic vesicle regulation. Nature. 375:488–493. [DOI] [PubMed] [Google Scholar]
- 48.Baldelli, P., A. Fassio, A. Corradi, O. Cremona, F. Valtorta, and F. Benfenati. 2005. Synapsins and neuroexocytosis: recent views from functional studies on synapsin null mutant mice. Arch. Ital. Biol. 143:113–126. [PubMed] [Google Scholar]
- 49.Martin-Molina, A., S. Moreno-Flores, E. Perez, D. Pum, U. B. Sleytr, and J. L. Toca-Herrera. 2006. Structure, surface interactions, and compressibility of bacterial S-layers through scanning force microscopy and the surface force apparatus. Biophys. J. 90:1821–1829. [DOI] [PMC free article] [PubMed] [Google Scholar]
- 50.Huttner, W. B., W. Schiebler, P. Greengard, and P. Decamilli. 1983. Synapsin-I (protein-I), a nerve terminal-specific phosphoprotein. 3. Its association with synaptic vesicles studied in a highly purified synaptic vesicle preparation. J. Cell Biol. 96:1374–1388. [DOI] [PMC free article] [PubMed] [Google Scholar]
- 51.Stefani, G., F. Onofri, F. Valtorta, P. Vaccaro, P. Greengard, and F. Benfenati. 1997. Kinetic analysis of the phosphorylation-dependent interactions of synapsin I with rat brain synaptic vesicles. Journal of Physiology-London. 504:501–515. [DOI] [PMC free article] [PubMed] [Google Scholar]
- 52.Hutter, J. L., and J. Bechhoefer. 1993. Calibration of atomic force microscope tips. Rev. Sci. Instrum. 64:1868–1873. [Google Scholar]
- 53.Butt, H.-J., and M. Jaschke. 1995. Calculation of thermal noise in atomic force microscopy. Nanotechnology. 6:1–7. [Google Scholar]
- 54.Müller, R. H., and R. Schuhmann. 1996. Particle size measurement in laboratory practice. Wissenschaftliche Verlagsgesellschaft mbH, Stuttgart, Germany.
- 55.Rawle, A. 1999. Efficient control of industrial processes: analysis of particle-size distribution. Chemie Ingenieur Technik. 71:52–53. [Google Scholar]
- 56.Schiebler, W., R. Jahn, J. P. Doucet, J. Rothlein, and P. Greengard. 1986. Characterization of synapsin-I binding to small synaptic vesicles. J. Biol. Chem. 261:8383–8390. [PubMed] [Google Scholar]
- 57.Murray, J., J. Cuccia, A. Ianoul, J. J. Cheetham, and L. J. Johnston. 2004. Imaging the selective binding of synapsin to anionic membrane domains. ChemBioChem. 5:1489–1494. [DOI] [PubMed] [Google Scholar]
- 58.Delorme, N., and A. Fery. 2006. Direct method to study membrane rigidity of small vesicles based on atomic force microscope force spectroscopy. Phys. Rev. E. 74. [DOI] [PubMed]
- 59.Cheetham, J. J., S. Hilfiker, F. Benfenati, T. Weber, P. Greengard, and A. J. Czernik. 2001. Identification of synapsin I peptides that insert into lipid membranes. Biochem. J. 354:57–66. [DOI] [PMC free article] [PubMed] [Google Scholar]
- 60.Hosaka, M., and T. C. Sudhof. 1998. Synapsins I and II are ATP-binding proteins with differential Ca2+ regulation. J. Biol. Chem. 273:1425–1429. [DOI] [PubMed] [Google Scholar]
- 61.Benfenati, F., F. Valtorta, M. C. Rossi, F. Onofri, T. Sihra, and P. Greengard. 1993. Interactions of synapsin-I with phospholipids: possible role in synaptic vesicle clustering and in the maintenance of bilayer structures. J. Cell Biol. 123:1845–1855. [DOI] [PMC free article] [PubMed] [Google Scholar]
- 62.Gitler, D., Y. Takagishi, J. Feng, Y. Ren, R. M. Rodriguiz, W. C. Wetsel, P. Greengard, and G. J. Augustine. 2004. Different presynaptic roles of synapsins at excitatory and inhibitory synapses. J. Neurosci. 24:11368–11380. [DOI] [PMC free article] [PubMed] [Google Scholar]
- 63.Ryan, T. A., L. A. Li, L. S. Chin, P. Greengard, and S. J. Smith. 1996. Synaptic vesicle recycling in synapsin I knock-out mice. J. Cell Biol. 134:1219–1227. [DOI] [PMC free article] [PubMed] [Google Scholar]


