

Abstract
Objective
To determine gait performance in community-residing nonagenarians.
Design
Nested case-control study.
Setting
Community.
Participants
Thirty-one nondisabled nonagenarians (17 women) and 170 young-old controls (age range, 70-85y) participating in a longitudinal study.
Interventions
Not applicable.
Main Outcome Measures
Systematic clinical and quantitative gait assessments. We also examined the association of gait velocity with death over a 1-year period.
Results
Nonagenarian men had better performance on all quantitative gait parameters examined compared with women. Male sex (β=.58; 95% confidence interval [CI], 9.95-38.89) and depressive symptoms (β=-.34; 95% CI, -6.73 to -0.04) were independently associated with gait velocity in multivariate linear regression models. The 6 hypertensive nonagenarians on angiotensin-converting enzyme (ACE) inhibitors had faster gait velocity (median, 103.1cm/s) compared with the 8 hypertensive nonagenarians not on ACE inhibitors (median, 77.5cm/s; P=.029). Nonagenarians had worse quantitative gait parameters compared with the young-old controls, though the differences were less marked when subjects with clinically normal gaits in both groups were compared. Gait velocity did not predict survival over 1-year follow-up.
Conclusions
Gait characteristics in nondisabled community-residing nonagenarians are associated with male sex, depressive symptoms, and medications. The quantitative gait measures in this sample of nondisabled nonagenarians provide a yardstick to compare younger age groups.
Keywords: Gait, Nonagenarians, Rehabilitation
The prevalence of nonagenarians (age range, 90-99y) in the population increased 8-fold between 1950 and 1990, and represents the fastest growing age segment behind centenarians who increased 20-fold during the same time span.1,2 There is growing interest in defining healthy aging phenotypes in the oldest age groups. Normal gait is a marker of health and functional independence in community-residing older adults.3,4 Clinical and quantitative gait abnormalities have been reported to predict multiple adverse outcomes in older adults including falls, dementia, and death. There is a paucity of studies with clinical and quantitative gait assessments in the oldest age groups,4-8 especially nonagenarians. Defining gait characteristics in nondisabled nonagenarians may help define markers of health and provide valuable insights into longevity traits.
The Einstein Aging Study (EAS) provided us the unique opportunity to study gait in a well-characterized nonagenarian sample.9-11 There were 3 main aims of this study. The first aim was to report gait characteristics of community residing nondisabled nonagenarians, and compare it with young-old subjects (age range, 70-85y). Second, we examined demographic, medical, and cognitive determinants of gait velocity in our nonagenarian subjects. The validity of gait measures to predict adverse outcomes has not been well established in the oldest-old. Hence, we also examined whether baseline gait velocity predicted death over a 1-year follow-up period.
METHODS
Participants
The EAS is a longitudinal aging study, which has been following a community-based cohort in the Bronx, NY, since 1999.9-11 The primary aim of EAS was to identify risk factors for dementia. Eligibility criteria were age 70 and over, residing in the Bronx, and English speaking. Exclusion criteria include severe audiovisual disturbances, inability to ambulate even with walking aids or in a wheelchair, or institutionalization. Potential subjects age 70 and over from population lists of Medicare-eligible persons were first contacted by letter explaining the purpose of the study, and then by telephone. The telephone interview included verbal consent, medical history questionnaire, and cognitive screening tests.9-11 After the interview, subjects who met eligibility criteria over the phone were invited for further screening and evaluations at our clinical research center. Subjects received detailed clinical and neuropsychologic evaluations at baseline and at 12 to 18 monthly follow-up visits. Informed consents were obtained at clinic visits according to study protocols approved by the local institutional review board.
Between 1999 and 2002, 488 subjects were enrolled (fig 1). Quantitative gait evaluations were introduced at the EAS in 2001. Between 2001 and 2004, 223 received quantitative gait assessments including 31 nonagenarians and 170 young-old (age range, 70-85y) subjects. Reasons for not obtaining gait assessments on 99 subjects were unavailability of testers (n=50), subjects were medically ill (n=30), or subjects refused (n=19). We compared gait of nonagenarians with the young-old controls. We excluded 22 subjects aged 85 to 89 years to avoid overlap between our age groups of interest.
Fig 1.
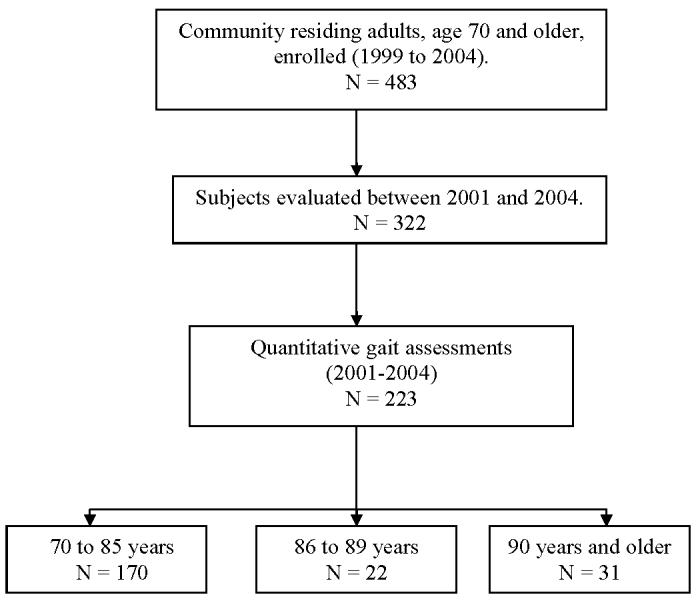
Study flow.
Quantitative Gait
Research assistants conducted quantitative gait evaluations independent of the clinical evaluation. Quantitative gait variables were collected using an instrumented mat (457.2×90.2×0.64cm [180.0×35.5×0.25in]) with embedded pressure sensors (GAITRite).a The software computes quantitative parameters based on footfalls recorded. Subjects were asked to walk on the mat in a well-lit hallway at their “normal walking speed” for 3 trials. Start and stop points were marked by white lines on the floor, and included 0.9m (3ft) each for initial acceleration and terminal deceleration. Monitoring devices were not attached to the participants during the test. Excellent reliability and validity for GAITRite assessments were reported in previous research in our and other centers.10-12
All gait parameters are computed by GAITRite software as the mean of 2 trials. Velocity (in cm/s) is the distance covered on 3 trials divided by the ambulation time. Step length is measured from the heel point of the current footfall to the heel point of the previous footfall on the opposite foot. Cadence is the number of steps taken in a minute. Stride length is the distance between the heel points of 2 consecutive footfalls of the same foot (left to left, right to right). Double support is the time elapsed between first contact of the current footfall and the last contact of the previous footfall, added to the time elapsed between the last contact of the current footfall and the first contact of the next footfall. Support base is the perpendicular distance from heel point of 1 footfall to the line of progression of the opposite foot.
Clinical Gait Assessment
Structured neurologic evaluations were done at each visit by study clinicians, and included assessment of cranial nerves, muscle strength, sensation, and deep tendon reflexes.4,10,11,14 Gait patterns and turns were observed while subjects walked up and down a well-lit hallway at their normal pace. Study clinicians determined whether gaits were normal or abnormal following visual inspection of gait.13,14 Abnormal gaits were classified as either non-neurologic (due to causes, eg, arthritis or cardiac disease) or neurologic (unsteady, ataxic, frontal, parkinsonian, neuropathic, hemiparetic, spastic) using previously described methods (see Verghese et al13,14 for descriptions and weblinks to videos of abnormal gait subtypes). Abnormalities were graded as mild (walks without assistance), moderate (uses walking aid, eg, cane), or severe (wheelchair or stands only with assistance). Subjects without a diagnosis of neurologic or non-neurologic gait abnormalities were classified as having “clinical normal gaits.”
We reported 89% agreement (κ=0.6) on gait classification as neurologic or non-neurologic during study evaluations done a year apart done by multiple clinicians in 189 subjects in the Bronx Aging Study.13 The interrater reliability studied prospectively between 2 study clinicians who independently examined and classified gait (normal vs abnormal) in 30 subjects from our present cohort was good (κ=0.8).10
Covariates
Subjects and caregivers were interviewed at study visits to obtain information on sociodemographic variables such as education, age of parents at their death, medical illnesses, and medications. Medical records and primary care providers were also consulted. We developed a summary score (illness index) based on the presence of 9 medical conditions: myocardial infarction, congestive heart failure, angina, hypertension, diabetes, strokes, arthritis, falls, and cancer. Depressive symptoms15 and cognition were assessed with a neuropsychologic test battery. Herein, we report Blessed Information-Memory-Concentration test scores, a general mental status test validated in our study and highly correlated with Alzheimer pathology.16 We examined performance on the following 7 activities of daily living: bathing, dressing, walking inside the house, transferring from a chair, toileting, feeding, and grooming. Based on previous studies,17,18 each task was scored as 0 (no difficulty), 1 (difficulty but no help), and 2 (help regardless of difficulty). Disability was defined as inability to independently perform (score of 2) any of these tasks. A summary disability score was generated with a range of 0 to 14. The testretest reliability of this scale has been reported to be excellent.17,18
Statistical Analysis
Baseline characteristics of nonagenarians were compared with young-old controls using descriptive statistics, applying nonparametric tests as appropriate after examining distributions of variables. Quantitative gait parameters are reported as medians with interquartile ranges to account for skewed distributions. All tests were 2-tailed with an α level of .05. Most studies do not account for the presence of clinical gait abnormalities while reporting quantitative gait measures. We report quantitative gait parameters in the overall group as well as for subjects with clinically normal gaits. Use of angiotensin-converting enzyme (ACE) inhibitors has been reported to be associated with faster walking speeds in older adults.19,20 Hence, we also examined velocity in hypertensive nonagenarians on ACE inhibitors.
We used linear regression analysis to identify determinants of gait velocity in our nondisabled nonagenarians. We chose gait velocity, among the various quantitative parameters, as it is the most common measure used to describe gait in clinical and research settings. In view of the small sample, we restricted independent variables to those identified in previous reports (age, sex, cognition, depressive symptoms, chronic illnesses, gait abnormalities) to be associated with gait performance in older adults.
Slow gait has been reported to predict death in older adults. We, therefore, examined the relationship of baseline gait velocity with one year risk of death using Cox proportional hazard models adjusted for age, male sex, Blessed scores, depressive symptoms, and illness index.21
RESULTS
Baseline
Baseline characteristics are shown in table 1. The mean age at enrollment was 91.9±2.4 years (range, 90-98y). Of the 31 nonagenarians, 14 were men and 17 women. The average height was 158.9±9.7cm and average weight was 65.1±9.7kg. None of the subjects was disabled. The mean disability score was 0.2 (median, 0.7). The chronic disease burden was low as measured by the illness index (mean, 2.35). The average age at death of the subjects’ fathers was 70.2±16.4 years, and mothers, 70.7±15.8 years. Clinical gait abnormalities were diagnosed in 21 of 31 subjects, and rated as mild in 15. Of note, mild abnormalities were diagnosed on visual inspection by experienced clinicians and not necessarily associated with slow gait. Gait abnormality was rated moderate (requiring a walking aid) in 6 subjects.
Table 1.
Baseline Characteristics Overall and by Sex
| Variables | Nonagenarian (n=31) | Young-Old (n=170) | P |
|---|---|---|---|
| Age (y) | 91.87±2.35 | 77.40±3.81 | <.001 |
| Education (y) | 12.29±3.04 | 14.1±3.4 | .04 |
| BIMC score | 4.97±4.19 | 1.67±1.86 | .03 |
| GDS score | 3.26±2.10 | 2.21±2.41 | .07 |
| No. of medications | 2.80±2.22 | 2.60±1.90 | .21 |
| Illness index score* | 2.35±1.43 | 1.86±1.19 | .16 |
| Clinical gait abnormality (n) | 21 | 64 | .001 |
| Mild | 15 | 45 | |
| Moderate | 6 | 18 | |
| Severe | 0 | 1 | |
| Neurologic gait (n) | 17 | 42 | <.001 |
| Low physical activity† (n) | 15 | 30 | <.001 |
NOTE. Values are mean ± standard deviation or as otherwise stated.
Abbreviations: BIMC, Blessed Information-Memory-Concentration test scores (range, 0-32; higher scores worse); GDS, Geriatric Depression Scale scores (range, 0-15; higher scores worse).
Illness index is a summary score based on the presence of the following 9 self-reported medical conditions: myocardial infarctions, congestive heart failure, angina, hypertension, diabetes, strokes, arthritis, falls, and cancer.
Low physical activity was defined as less than weekly participation.
The young-old controls had more years of education and lower Blessed scores (higher scores worse) than the nonagenarians. However, the Blessed scores were within the normative range (0-7) for both groups.13,16 There were no significant differences on depressive symptoms, medication use, or illness index. Nonagenarians had a higher prevalence of clinical gait abnormalities, especially neurologic, than the young-old.
Sex
Among nonagenarians, there were no significant differences by sex in age (men, 91.4±1.7y vs women, 92.2±2.8y), Blessed test scores (4.6±3.4 vs 5.2±4.8), depressive symptoms (3.9±1.8 vs 2.8±2.3), or disability scores (1.0±1.4 vs 0.6±0.9). Nonagenarian men were taller (167.1±7.2 cm vs 152.3±5.3cm, P<.05) and heavier (72.6±5.9kg vs 58.7±7.1kg, P<.05) than women. Seven of the 14 men had normal gaits, and 7 had mild gait abnormalities. Three of the 17 women had normal gaits, and 8 had mild gait abnormalities. Moderate gait abnormalities were seen in 6 women and none of the men (P=.011). All abnormal gaits in the men were neurologic. Among women, 10 had neurologic gaits and 4 had non-neurologic gaits. Prevalence of any gait abnormalities or neurologic gait abnormalities was not significantly different.
Quantitative Gait
Unadjusted quantitative gait parameters for this nondisabled nonagenarian group as well as for the subgroup of 10 subjects with clinically normal gaits are presented in table 2. Quantitative gait parameters for 170 young-old subjects (104 clinically normal gaits) are presented for comparison. Gait performance was significantly better in young-old controls compared to nonagenarians both overall as well as in the subgroup with clinically normal gaits (see table 2). Gait performance was better for both age groups in subjects with clinically normal gaits. Except for cadence, all gait parameters were significantly better in men than women (data not shown).
Table 2.
Quantitative Gait Parameters in Nondisabled Nonagenarians and Young-Old Controls (70-85y)
| Gait Parameters | Overall Group | Clinically Normal Gait | ||
|---|---|---|---|---|
| Age Groups | <85 Years (n=170) | ≥ 90 Years (n=31) | <85 Years (n=104) | ≥90 Years (n=10) |
| Velocity (cm/s) | 96.9 (77.5-122.8) | 76.1 (61.9-89.6) | 105.2 (92.2-118.5) | 91.1 (62.4-104.8) |
| Cadence (steps/min) | 102.5 (94.2-104.2) | 108.0 (96.5-113.7) | 105.0 (97.2-118.1) | 109.4 (105.2-116.6) |
| Step length right (cm) | 56.4 (48.8-63.3) | 43.5 (38.4-51.6) | 60.7 (54.6-65.7) | 48.8 (38.7-55.5) |
| Stride length right (cm) | 113.9 (98.0-127.6) | 89.5 (75.9-98.4) | 120.2 (110.8-131.1) | 98.1 (78.0-112.7) |
| Double support time (%) | 26.9 (24.2-29.8) | 27.7 (24.3-30.3) | 25.7 (23.9-28.4) | 25.3 (22.2-26.3) |
| Support base (cm) | 9.67 (7.37-12.17) | 12.36 (8.11-16.65) | 9.21 (7.12-11.23) | 10.10 (8.90-14.37) |
NOTE. Values are median and interquartile range.
There were 14 nonagenarians subjects in our sample with a history of hypertension. The 6 hypertensive subjects on ACE inhibitors had faster gait velocity (median, 103.1cm/s) compared with the remaining eight nonagenarians on other antihypertensive medications (median, 77.5cm/s; P=.029).
Regression
Results from univariate and multivariate linear regression analysis examining determinants of gait velocity are presented in table 3. The final model included age, sex, Blessed scores, depressive symptoms, neurologic gait abnormalities, and illness index as covariates. Within this very old group, age in itself was not associated with gait velocity. Male sex (β=.58, 95% confidence interval [CI], 9.95-38.89) was significantly associated with gait velocity. Depressive symptoms did not have a significant univariate association. However, depressive symptoms (β=-.34; 95% CI, -6.73 to -0.04; P=.047) but not cognitive status was significantly associated with gait velocity in the final model. There was a significant interaction between depression and male sex (P<.001), which may account for its significance in the final model. Only two nonagenarians had clinical depression necessitating therapy. Neurologic gait abnormalities, which are associated with slow gait, were not significant in this model.
Table 3.
Results of Univariate and Multivariate Linear Regression of Risk Factors Associated With Gait Velocity in Nondisabled Nonagenarians
| Variables | Univariate β ± SE (95% CI) | P | Multivariate β ± SE (95% CI) | P |
|---|---|---|---|---|
| Age (y) | -1.871±1.677 (-5.125 to 7.455) | 0.322 | -0.079±1.527 (-3.872 to 2.444) | .644 |
| Male sex | 0.5277±6.802 (8.363 to 36.232) | <.001 | 0.577±6.991 (9.947 to 38.892) | .002 |
| BIMC score | -0.130±0.938 (-2.573 to 1.270) | .493 | -0.020±0.838 (-1.833 to 1.633) | .906 |
| GDS score | - 0.181±1.860 (-5.619 to 2.001) | .339 | -0.338±1.618 (-6.734 to -0.039) | .047 |
| Illness index | 0.248±2.695 (-1.876 to 9.745) | .187 | 0.182±2.411 (-2.308 to 7.672) | .278 |
| Neurologic gait | -0.219±7.756 (-25.502 to 6.692) | .246 | -0.149±6.876 (-20.476 to 7.973) | .373 |
Abbreviations: see table 1.
To account for anthropometric features that may determine gait velocity, we repeated the analysis using normalized velocity (velocity divided by leg length) as the dependent variable. While the strength of the associations was reduced, male sex (β=.17; 95% CI, .04-.38; P=.021) and depression (β=-.15; 95% CI, -.82 to -.03; P=.044) were still significant.
Survival
Over 11.8±5.3 months of follow-up, 5 of the 31 subjects died. Gait velocity (hazard ratio, 1.02; 95% CI, 0.59-1.76; P=.297) did not predict death over this short follow-up period. Age, sex, cognitive status, depressive symptoms, and chronic illness were also not significant predictors in this model.
DISCUSSION
We reported gait characteristics in community-residing nondisabled nonagenarians using systematic clinical and quantitative gait assessments. Male sex and depressive symptoms were important determinants of gait velocity in nondisabled nonagenarians. Our secondary analyses showed an interesting interaction between these 2 variables, depressive symptoms in men was associated with slower gait, corroborating previous findings in slightly younger age groups.5 However, cognitive status and comorbid illnesses, which are associated with gait in younger age groups in other studies,5,22,23 were not associated with gait velocity in our nondisabled nonagenarians. While direct comparisons with other studies are limited, slow gait was associated with cognitive impairment, depressive symptoms, and dizziness in another community-based study of 85-year-old subjects.5
While we and others have reported that gait abnormalities are associated with death in older adults, 6,7,14 gait velocity was not a significant predictor of death in our nonagenarian subgroup. The lack of association between gait velocity and death has also been noted in a previous study of centenarians.24 We have recently reported that clinical gait abnormalities predicted institutionalization and death in our full cohort.14 Hence, gait measures that are risk factors for adverse outcomes such as death in younger age groups may not have the same function in the oldest age groups. Given our small sample size these results should be viewed as preliminary and confirmed in larger samples.
Compared to young-old, nonagenarians had worse quantitative gait measures. The magnitude of difference is less when restricted to with subjects with normal gaits. For instance, gait velocity was 21.5% slower in nonagenarians compared with young-old. However, gait velocity was only 13.4% slower when restricted to subjects with normal gaits. Based on our findings we recommend that slow gait should not be assumed to be part of normal aging in clinical practice. Mild neurologic gait abnormalities or underlying chronic illnesses should be considered while assessing older adults with slow gait.5,14 A caveat is that clinical gait assessment is fallible, and misclassification of subjects with very mild gait abnormalities will lead to underestimation of differences between age groups. Hence, our findings should be replicated with larger samples.
Sex differences in gait in nonagenarians may result from differences in anthropometric, genetic, metabolic, or survival characteristics. Men were taller than women, but male sex was still significant when normalized velocity was used as the dependent variable. Parental ages in our subjects were above population norms of their times, but there were no sex differences in parental age. The increasing prevalence of sarcopenia and frailty with advancing age, which is more pronounced in women,25 may result in slower walking speeds. The sex ratio in older age groups favors women.26 Nonagenarian men may walk better due to healthy survivor effects. Men who are less healthy die at younger ages leaving healthier survivors with superior gait performance. Women on the average live longer, and may be expected to survive to advanced ages with worse health characteristics than men. Sex differences in gait should be further explored.
Depressive symptoms were associated with slower gait velocity in nonagenarians. Both depressive symptoms and history of depression (adjusted for antidepressant use) were previously reported to be associated with decline in walking speeds in older adults.27 Depressed mood is associated with high plasma levels of inflammatory markers such as interleukin-6, tumor necrosis factor-alpha, and C-reactive protein in well-functioning older adults.28 High levels of inflammatory markers are also reported to predict decline in walking ability in older adults.29 Inflammatory mechanisms may be a possible link between depression and slow gait.
Hypertensive subjects on ACE inhibitors had faster gait velocity than those not on ACE inhibitors in our study, supporting previous reports,19,20 In the Women’s Health and Aging study,19 ACE inhibitor use in hypertensive older women was associated with reduced decline in walking speed. The SAGE study20 reported an association between ACE inhibitors and reduced functional decline in older adults with congestive heart failure. Possible explanations for the effect of ACE inhibitors on gait include direct effects on muscle membrane, modulating proinflammatory responses triggered by angiotensin, and improved cardiac function.19,20
The strengths of this study include the systematic gait evaluations using validated techniques and a nondisabled community-residing sample. There is a paucity of quantitative gait studies in this age group. Our sample of convenience is not representative of all nonagenarians in the population. We included only nondisabled adults. However, nonagenarians with gait abnormalities or who are disabled are more likely to be seen in institutional settings.30,31 The small sample size reflects the low prevalence of nondisabled oldest-old adults living in the community. Nonagenarians constitute just .55% of the total U.S. population.31 Approximately one-fifth of the adults over age 85 live in nursing facilities.30 The challenges of recruiting older subjects, especially among the oldest-old, have been discussed previously.32 Our results and any conclusions should be considered as preliminary given the small sample, and should be verified in other population-based samples.
CONCLUSIONS
Our findings provide a description of gait characteristics in nonagenarians, and sheds light on factors associated with gait velocity in this very old cohort such as sex differences, depressive symptoms, and ACE inhibitor use. While the nonagenarians have worse gait performance than young-old controls, the differences are less marked in subjects with clinically normal gaits. The quantitative gait parameters in this nondisabled nonagenarian sample can be used to define mobility and disability in the oldest-old, and serve as a reference for future studies.
Footnotes
Supported by the National Institutes on Aging (grant nos. AGO3949, RO1 AGO25119) and a Paul B Beeson Career Development Award (grant no. K23 AG024848).
No commercial party having a direct financial interest in the results of the research supporting this article has or will confer a benefit upon the authors or upon any organization with which the authors are associated.
Supplier
CIR Systems, 60 Garlor Dr, Havertown, PA 19083.
References
- 1.Kannisto V. Development of oldest-old mortality, 1950-1990: evidence from 28 developed countries. Odense Univ Pr; Odense: 1994. Odense Monographs on Population Aging 1.
- 2.Andersen-Ranberg K, Christensen K, Jeune B, Skytthe A, Vasegaard L, Vaupel JW. Declining physical abilities with age: a cross-sectional study of older twins and centenarians in Denmark. Age Aging. 1999;28:373–7. doi: 10.1093/ageing/28.4.373. [DOI] [PubMed] [Google Scholar]
- 3.Rowe JW, Kahn RL. Human aging: usual and successful. Science. 1987;237:143–9. doi: 10.1126/science.3299702. [DOI] [PubMed] [Google Scholar]
- 4.Berkman LF, Seeman TE, Albert M, et al. High, usual and impaired functioning in community-dwelling older men and women: findings from the MacArthur Foundation Research Network on Successful Aging. J Clin Epidemiol. 1993;46:1129–40. doi: 10.1016/0895-4356(93)90112-e. [DOI] [PubMed] [Google Scholar]
- 5.Bootsma-van der Wiel A, Gussekloo J, De Craen AJ, Van Exel E, Bloem BR, Westendorp RG. Common chronic diseases and general impairments as determinants of walking disability in the oldest-old population. J Am Geriatr Soc. 2002;50:1405–10. doi: 10.1046/j.1532-5415.2002.50363.x. [DOI] [PubMed] [Google Scholar]
- 6.Bennett DA, Beckett LA, Murray AM, et al. Prevalence of parkinsonian signs and associated mortality in a community population of older people. N Engl J Med. 1996;334:71–6. doi: 10.1056/NEJM199601113340202. [DOI] [PubMed] [Google Scholar]
- 7.Bloem BR, Gussekloo J, Lagaay AM, Remarque EJ, Haan J, Westendorp RG. Idiopathic senile gait disorders are signs of subclinical disease. J Am Geriatr Soc. 2000;48:1098–101. doi: 10.1111/j.1532-5415.2000.tb04786.x. [DOI] [PubMed] [Google Scholar]
- 8.Bloem BR, Haan J, Lagaay AM, van Beek W, Wintzen AR, Roos RA. Investigation of gait in elderly subjects over 88 years of age. J Geriatr Psychiatry Neurol. 1992;5:78–84. doi: 10.1177/002383099200500204. [DOI] [PubMed] [Google Scholar]
- 9.Lipton RB, Katz MJ, Kuslansky G, et al. Screening for dementia by telephone using the memory impairment screen. J Am Geriatr Soc. 2003;51:1382–90. doi: 10.1046/j.1532-5415.2003.51455.x. [DOI] [PubMed] [Google Scholar]
- 10.Verghese J, Katz MJ, Derby CA, Kuslansky G, Hall CB, Lipton RB. Reliability and validity of a telephone-based mobility assessment questionnaire. Age Ageing. 2004;33:628–32. doi: 10.1093/ageing/afh210. [DOI] [PubMed] [Google Scholar]
- 11.Verghese J, Buschke H, Viola L, et al. Validity of divided attention tasks in predicting falls in older individuals: a preliminary study. J Am Geriatr Soc. 2002;50:1572–6. doi: 10.1046/j.1532-5415.2002.50415.x. [DOI] [PubMed] [Google Scholar]
- 12.Bilney B, Morris M, Webster K. Concurrent related validity of the GAITRite walkway system for quantification of the spatial and temporal parameters of gait. Gait Posture. 2003;17:68–74. doi: 10.1016/s0966-6362(02)00053-x. [DOI] [PubMed] [Google Scholar]
- 13.Verghese J, Lipton RB, Katz MJ, Hall CB, Kuslansky G, Buschke H. Gait abnormality as a predictor of non-Alzheimer dementia. N Engl J Med. 2002;347:1760–7. doi: 10.1056/NEJMoa020441. [DOI] [PubMed] [Google Scholar]
- 14.Verghese J, LeValley A, Hall CB, Katz MJ, Ambrose AF, Lipton RB. Epidemiology of gait disorders in community residing older adults. J Am Geriatr Soc. 2006 doi: 10.1111/j.1532-5415.2005.00580.x. in press.
- 15.Yesavage JA, Brink TL, Rose TL, et al. Development and validation of a geriatric depression rating scale: a preliminary report. J Psychiatr Res. 19821983;17:37–49. doi: 10.1016/0022-3956(82)90033-4. [DOI] [PubMed] [Google Scholar]
- 16.Blessed G, Tomlinson E, Roth M. The association between quantitative measures of dementia and of senile change in the cerebral grey matter of elderly subjects. Br J Psychiatry. 1968;114:797–811. doi: 10.1192/bjp.114.512.797. [DOI] [PubMed] [Google Scholar]
- 17.Gill TM, Baker DI, Gottschalk M, et al. A rehabilitation program for physically frail community-living older persons. Arch Phys Med Rehabil. 2003;84:394–404. doi: 10.1053/apmr.2003.50020. [DOI] [PubMed] [Google Scholar]
- 18.Gill TM, Hardy SE, Williams CS. Underestimation of disability among community-living older persons. J Am Geriatr Soc. 2002;50:1492–7. doi: 10.1046/j.1532-5415.2002.50403.x. [DOI] [PubMed] [Google Scholar]
- 19.Onder G, Penninx BW, Balkrishnan R, et al. Relation between use of angiotensin-converting enzyme inhibitors and muscle strength and physical function in older women: an observational study. Lancet. 2002;359:926–30. doi: 10.1016/s0140-6736(02)08024-8. [DOI] [PubMed] [Google Scholar]
- 20.Gambassi G, Lapane KL, Sgadari A, et al. Effects of angiotensin-converting enzyme inhibitors and digoxin on health outcomes of very old patients with heart failure. SAGE Study Group. Systematic Assessment of Geriatric drug use via Epidemiology. Arch Intern Med. 2000;160:53–60. doi: 10.1001/archinte.160.1.53. [DOI] [PubMed] [Google Scholar]
- 21.Cox DR. Regression models and life tables. J R Stat Soc [B] 1972;34:187–220. [Google Scholar]
- 22.Goldman WP, Baty JD, Buckles VD, Sahrmann S, Morris JC. Motor dysfunction in mildly demented AD individuals without extrapyramidal signs. Neurology. 1999;53:956–62. doi: 10.1212/wnl.53.5.956. [DOI] [PubMed] [Google Scholar]
- 23.Bendall MJ, Bassey EJ, Pearson MB. Factors affecting walking speed of elderly people. Age Ageing. 1989;18:327–32. doi: 10.1093/ageing/18.5.327. [DOI] [PubMed] [Google Scholar]
- 24.Shimizu K, Hirose N, Arai Y, Gondo Y, Wakida Y. Determinants of further survival in centenarians. Geriatr Gerontol Int. 2001;1:14–7. [Google Scholar]
- 25.Fisher AL. Of worms and women: sarcopenia and its role in disability and mortality. J Am Geriatr Soc. 2004;52:1185–90. doi: 10.1111/j.1532-5415.2004.52320.x. [DOI] [PubMed] [Google Scholar]
- 26.United Nations. Department of International Economic and Social Affairs. Population Division Sex differentials in life expectancy and mortality in developed countries: an analysis by age groups and causes of death from recent and historical data. Popul Bull UN. 1988;25:65–107. [PubMed] [Google Scholar]
- 27.Penninx BW, Guralnik JM, Ferrucci L, Simonsick EM, Deeg DJ, Wallace RB. Depressive symptoms and physical decline in community-dwelling older persons. JAMA. 1998;279:1720–6. doi: 10.1001/jama.279.21.1720. [DOI] [PubMed] [Google Scholar]
- 28.Penninx BW, Kritchevsky SB, Yaffe K, et al. Inflammatory markers and depressed mood in older persons: results from the Health, Aging and Body Composition study. Biol Psychiatry. 2003;54:566–72. doi: 10.1016/s0006-3223(02)01811-5. [DOI] [PubMed] [Google Scholar]
- 29.Ferrucci L, Penninx BW, Volpato S, et al. Change in muscle strength explains accelerated decline of physical function in older women with high interleukin-6 serum levels. J Am Geriatr Soc. 2002;50:1947–54. doi: 10.1046/j.1532-5415.2002.50605.x. [DOI] [PubMed] [Google Scholar]
- 30.Jones A. The National Nursing Home Survey: 1999 summary. Vital Health Stat. 2002;13(152):1–116. [PubMed] [Google Scholar]
- 31.U.S. Census Bureau Table 1: Annual estimates of the population by sex and five-year age groups for the United States - April 1, 2000 to July 1, 2003 Available at: http://www.census.gov/popest/national/asrh/NC-EST2003/NC-EST2003-01.pdf. Accessed January 10, 2006.
- 32.Ory MG, Lipman PD, Karlen PL, et al. FICSIT Group Frailty and Injuries: Cooperative Studies of Intervention Techniques. Recruitment of older participants in frailty/injury prevention studies. Prev Sci. 2002;3:1–22. doi: 10.1023/a:1014610325059. [DOI] [PubMed] [Google Scholar]