

Abstract
Genetic and environmental influences on childhood antisocial and aggressive behavior (ASB) during childhood were examined in 9- to 10-year-old twins, using a multi-informant approach. The sample (605 families of twins or triplets) was socioeconomically and ethnically diverse, representative of the culturally diverse urban population in Southern California. Measures of ASB included symptom counts for conduct disorder, ratings of aggression, delinquency, and psychopathic traits obtained through child self-reports, teacher, and caregiver ratings. Multivariate analysis revealed a common ASB factor across informants that was strongly heritable (heritability was .96), highlighting the importance of a broad, general measure obtained from multiple sources as a plausible construct for future investigations of specific genetic mechanisms in ASB. The best fitting multivariate model required informant-specific genetic, environmental, and rater effects for variation in observed ASB measures. The results suggest that parent, children, and teachers have only a partly “shared view” and that the additional factors that influence the “rater-specific” view of the child's antisocial behavior vary for different informants. This is the first study to demonstrate strong heritable effects on ASB in ethnically and economically diverse samples.
Keywords: antisocial behavior, aggression, genes, environment
Why do some children grow up to be prosocial, law-abiding individuals, whereas others engage in patterns of disruptive, defiant, and delinquent behavior, even falling into the criminal justice system well before reaching adulthood? A plethora of studies have investigated the etiology of such individual differences, with abundant evidence demonstrating the importance of both social circumstances and biological risk factors in antisocial behavior across the life span (Baker, 1999; Raine, 1993, 2002; Raine, Brennan, Farrington, & Mednick, 1997; Stoff, Breiling, & Maser, 1997). Among these risk factors, genetic and environmental influences have been of considerable interest and are likely to play a key role in our understanding of aggression and other antisocial behaviors and, thus, our ability to avert them.
In fact, genetic and environmental influences in aggressive and antisocial behavior (ASB) have been studied extensively. Several early adoption studies in both Scandinavia and the United States have provided the intriguing finding that not only does the risk for adult criminal offending run in families but familial similarity is due primarily to shared genetic risk (Bohman, 1978; Cadoret, 1978; Hutchings & Mednick, 1971; Loehlin, Willerman, & Horn, 1985; Sigvardsson, Cloninger, Bohman, & Von Knorring, 1982). Genetic predispositions have also been shown to play a significant role in the normal variation in adult aggressive behavior, perhaps especially in more impulsive forms (Coccaro, Bergeman, Kavoussi, & Seroczynski, 1997). In contrast, studies that have included adolescents and younger children vary widely in their estimates of the relative importance of genes and environment, with heritability estimates (h2) indicating that genetic effects could explain as little as nil or upward of three fourths of the variance in ASB (see Rhee & Waldman, 2002, for the most recent review).
Using meta-analysis of key behavioral genetic studies in ASB, Rhee and Waldman (2002) found that, combining results across studies, there were significant effects of additive genetic influence (a2 = .32), of nonadditive genetic influences (d2 = .09), and of shared (e2s = .16) and nonshared environment (e2ns = .43). These genetic and environmental effects were found to differ, however, according to the definition and method of assessing ASB, as well as by the age at which ASB was studied. The nonadditive genetic effects appear most strongly for studies of criminal convictions compared with all other definitions of ASB. Shared environmental effects were stronger for parental reports of ASB compared with self-reports and with official records, and these shared environmental effects appear to diminish from childhood to adulthood.
It is also noteworthy, however, that age and method of assessment are confounded across studies—investigations of younger children tend to rely on parent or teacher reports, whereas studies of older adolescents and adults are more apt to use official records or self-report measures of ASB. Thus, the larger effect of shared environment during childhood may be due to greater reliance on parental or teacher ratings. Given these methodological confounds across studies, it is impossible to know the strength of genetic and environmental influences on individual differences in childhood ASB in particular. Additional studies are required to resolve the effects of genes and environment in ASB in children.
Defining Antisocial Behavior
Definitions of ASB vary widely across studies and include violations of rules and social norms (e.g., lawbreaking), various forms of aggression (e.g., self-defense or other reactive forms and proactive behaviors such as bullying), and serious patterns of disruptive and aggressive behavior such as those observed in clinical disorders like conduct disorder and oppositional defiant disorder in children or antisocial personality disorder in adults. The variability found in the definitions of these key concepts is also found in the methods of measuring ASB; some studies are based on official records such as police arrests, court convictions, or school records, whereas others rely on behavioral ratings provided by parents or teachers or on self-reports about the participant's own ASB. Each assessment method has its advantages and disadvantages with no one definition or method of assessment being clearly superior.
Nevertheless, in spite of the wide variations in definitions of ASB, as well as the possibility that the relative importance of genetic and environmental factors may vary for different measures (e.g., Eley, Lichtenstein, & Moffitt, 2003; Mednick, Gabrielli, & Hutchings, 1984; also see Rhee & Waldman, 2002, for review), there is also considerable evidence for a general externalizing dimension of problem behavior underlying these various behaviors and tendencies. Similar to the problem/behavior syndrome described earlier by Jessor and Jessor (1977), a broad latent factor has been purported to be a common link among antisocial behavior, substance dependence, and disinhibited personality traits (Krueger et al., 2002). The externalizing dimension has been found to be more continuous than categorical, with shades of gray describing a range of deviant behaviors across individuals (Markon & Krueger, 2005; Young, Stallings, Corley, Krauter, & Hewitt, 2000). Moreover, this common externalizing factor has been shown to have a strong heritability among adolescents (h2 = .80), accounting for much of the covariation among various aspects of antisocial behavior and disinhibition (Krueger et al., 2002). Among adults, there is also evidence for separate genetic factors for internalizing versus externalizing dimensions of psychopathology (Kendler, Prescott, Myers, & Neale, 2003). This general externalizing factor found across many studies may reflect an overall tendency to act in an unconstrained manner, a genetically based characteristic that manifests itself in various ways depending on the environment (Krueger, 2002). The higher heritability found for this externalizing factor compared with heritabilities obtained from studies that have focused on only one type of antisocial behavior suggests that using a composite measure based on different types of antisocial behavior may be a useful method in molecular genetic research.
Informant Variation
Another important aspect to consider when comparing results across studies is the source of the information about ASB. It is well-known that different informants produce different reports of a child's behavior. Correlations between raters of the same child are typically about .60 between mother and father ratings, .28 between parent and teacher ratings, and .22 between the parent and child ratings (Achenbach, McConaughy, & Howell, 1987). Largely, each rater provides a unique perspective on the child's behavior. Children would seem to be the most knowledgeable source to report on their own behavior (particularly covert actions) as well as their motivations, although their cognitive development, truthfulness, and social desirability factors may limit the accuracy of their reports. Parents may be more able to objectively report on a child's externalizing behaviors, although they may be unaware of covert actions or unwilling to report them to researchers. Although teachers' reports may also have the advantage of greater objectivity, teachers may have limited knowledge of the child's antisocial behavior, particularly as it may occur outside of classroom or other school settings. Although researchers sometimes combine ratings across reporters in an attempt to increase scale reliability, different etiologies may exist for scales derived from different informants (Bartels et al., 2003, 2004; Saudino & Cherny, 2001). Thus, the best way to model information from multiple informants is to use a multivariate, factor-based approach that allows for both differences and correlations across informants simultaneously (Kraemer et al., 2003).
There are at least three advantages to using a factor-based approach when dealing with multiple informants in twin studies. First, such a model allows for the possibility that there may be different genetic and environmental etiologies depending upon the perspective of the rater. Second, it allows one to explicitly model and test for the significance of certain types of rater bias. Finally, because the underlying common factor will represent (by definition) a “shared view” of antisocial behavior across informants, the heritability of the common factor may be higher than the heritabilities obtained through any one informant. If this is the case, then combining information from different types of reporters may yield stronger genetic signals in molecular genetic studies. Previous studies of ASB in preadolescent children have relied heavily on either parent or teacher reports, although a few studies have obtained data from multiple reporters, most commonly from the mother and the father (e.g., Bartels et al., 2003, 2004; Neale & Stevenson, 1989; Hewitt, Silbert, Neale, Eaves, & Erickson, 1992) or from parent(s) and teachers (e.g., Hudziak et al., 2003; Martin, Scourfield, & McGuffin, 2002; Vierikko, Pulkkinen, Kaprio, & Rose, 2004) and occasionally from parents and children (e.g., Simonoff et al., 1995). We are unaware, however, of any published studies of externalizing disorder that have used reports from care-givers, teachers, and children simultaneously.
Sex Differences
A final question to consider is whether there are sex differences in the relative importance of genetic and environmental factors for antisocial behavior. In spite of the fact that males are far more likely than females to engage in antisocial, aggressive, and criminal behavior, there are no apparent differences between the sexes in the relative importance of genetic factors (i.e., heritability) in explaining individual differences in antisocial behavior among adults. Heritability of liability toward nonviolent criminality appears equivalent for men and women, in studies of both twins (Cloninger & Gottesman, 1987) and adoptees (Baker, Mack, Moffitt, & Mednick, 1989), although the average genetic predispositions do appear greater for criminal women compared with criminal men (Baker et al., 1989; Sigvardsson et al., 1982). A few studies of childhood and adolescent ASB have examined sex differences in genetic and environmental etiology, although the results are not consistent. Some studies have found genetic effects to be of greater importance in boys and common environment more important in girls using parental ratings (Silberg et al., 1994), whereas others have found the opposite result using retrospective reports for adolescents (Jacobson, Prescott, & Kendler, 2002), and still others have not found sex-specific etiologies (Eley, Lichtenstein, & Stevenson, 1999). Aggregating across studies in their meta-analysis, Rhee and Waldman (2002) found that the relative importance of genetic and environmental factors in ASB does not differ for males and females, although it should be noted that their analyses did not investigate the extent to which sex differences in etiology might vary across development or method of assessment (i.e., rater). Overall, the question about different etiologies of ASB for males and females remains open.
The University of Southern California (USC) Twin Study of Risk Factors for ASB
This is one of the first prospective twin studies of preadolescent children to focus on aggressive and antisocial behavior using a multitrait, multi-informant approach. In this article we present results for the comprehensive phenotypic assessments of aggressive and antisocial behavior conducted during the first wave of the study, while the participants are at the brink of adolescence (ages 9 and 10 years old), and use multivariate genetic factor models to examine the extent to which genetic and environmental influences account for agreement and disagreement across raters. This study expands on previous research in the following important ways. First, it examined the relative influence of genetic and environmental factors on antisocial behavior using an ethnically and socioeconomically diverse sample. The ethnic and socioeconomic variability of the sample may allow for greater generalizability of results to the diverse populations in urban areas, where antisocial, aggressive, and violent behaviors present serious threats to the community at large. Second, it used multiple indices of antisocial behavior. Rather than relying on univariate comparisons of heritability estimates for various types and severities of antisocial behavior, the use of a composite measure based on all of the different indices may yield a stronger genetic signal than any one index of antisocial behavior alone. Third, the study relied on reports of antisocial behavior from multiple informants. This allowed us to (a) examine whether there are significant differences across raters; (b) test formally the extent to which rater bias may influence results; and (c) combine information from different raters in a multivariate model, allowing for the presence of a “shared” view of antisocial behavior that may be more reliable than any single viewpoint. Fourth, our sample consisted of both male and female twins, including opposite-sex pairs, allowing us to examine potential sex differences in the etiology of a shared view of ASB. Finally, it should be noted that although the present results are cross-sectional, they are part of a larger, ongoing longitudinal study. Therefore, in future analyses, we will be able to compare and contrast our results as participants move from the brink of adolescence into adolescence and young adulthood.
Method
Overview of the USC Twin Study of Risk Factors for Antisocial Behavior
The USC Twin Study of Risk Factors for Antisocial Behavior is a longitudinal study of the interplay of genetic, environmental, social, and biological factors on the development of antisocial behavior across adolescence. The first wave of assessment occurred during 2001 to 2004, when the twins were 9 to 10 years old, with a 2-year follow-up assessment in the laboratory when twins were ages 11 to 12. Two additional follow-up assessments will be conducted when the twins are ages 14 to 15 (third wave) and 16 to 17 years old (fourth wave). The present analyses are based on data from the first wave. Comprehensive assessment of each child was made, including cognitive, behavioral, psychosocial, and psycho-physiological measures based on individual testing and interviews of the child and primary caregiver during the laboratory visit, with additional teacher surveys completed and returned by mail. A detailed description of the study, including a summary of the measures, can be found in Baker, Barton, Lozano, Raine, and Fowler (2006).
Participant Recruitment
The twins and their families who are part of the USC Study of Risk Factors for Antisocial Behavior were recruited from the larger Southern California Twin Register, which contains over 1,400 total pairs of school-age twins born between 1990 and 1995. Participants in the Twin Register are volunteers, and families were ascertained primarily through local schools, both public and private, in Los Angeles and the surrounding communities—see Baker, Barton, and Raine (2002) for a detailed description of the recruitment process and Twin Register from which the twins were sampled. Families identified as having twins in the target age range were sent letters briefly describing the study and inviting them to participate.
Study participation required that the twins be (a) proficient in English and (b) 9 or 10 years old at first assessment (see Baker et al., 2006). In addition, either English or Spanish proficiency was required for the twins' primary caregiver. Of the 1,400 families who joined the USC Twin Register and were in the target age range, approximately 860 families were contacted by phone to explain the study in greater detail and to schedule a testing session. The sample of 605 tested families thus constituted a 70% participation rate of those families whom we were able to contact. Approximately 30 families (3% of the total eligible sample) did not qualify because of limited English proficiency in the children. The remaining families were either never scheduled, cancelled, or did not show up for their testing session.
Procedure
Laboratory visit protocol
Testing and interviews of the child and caregiver were made during a 6- to 8-hr visit to the USC laboratories. The details of the protocol can be found in Baker et al. (2006). Briefly, the visit included behavioral interviews, neurocognitive testing, social risk factor assessment, and psychophysiological recording of the twins. Caregivers were also interviewed about their twins' behavior, as well as their own behavior and relationship to each twin. Cheek swab samples were also collected from the participating families in order to extract DNA and test for zygosity.
Participating families were compensated for their visit to USC and provided with additional incentives for keeping scheduled appointments in a timely fashion (total payments were up to $125). Families were also provided with group summaries of study results and individual reports of their twins' zygosity and each child's cognitive testing results.
Given the sensitive nature of the information provided by the twins and their caregivers (including illegal behaviors), a Certificate of Confidentiality was obtained for this study from the National Institute of Mental Health to help protect the privacy of the participants. All participants were assured that the information they provided would be coded numerically and not linked to their names and that their individual information would not be shared with anyone outside the research team. The laboratory procedures and all aspects of the study were reviewed by the USC Institutional Review Board and were compliant with federal regulations at the time.
Assessments were conducted by rigorously trained examiners (see Baker et al., 2006, for details). All child interviews were conducted in English; caregiver interviews were conducted in either English (n = 492; 81.3%) or Spanish (n = 113; 18.7%), depending on the language preference of the participant. Less than half of the Hispanic caregivers (44.0%) preferred to be interviewed in Spanish. All caregiver surveys were translated into Spanish and back-translated into English by professional translators.
Teacher surveys
The twins' teachers were asked to complete surveys about each child's school behaviors and to return their survey packets to USC in prepaid, addressed envelopes. Teachers were not paid for their participation. Excluding pairs (n = 15) who were either homeschooled or for whom parents felt the teachers did not know their children well enough to rate their child, there was a 60% individual return rate for teacher surveys. Although we did not receive teacher surveys for all twins, we did have information on whether twins were in the same class at school for all but 18 twin pairs. Among the entire sample, 31.4% of twins were in the same classroom. Among the 269 pairs for whom both twins had teacher reports (see the Missing data section for details), 41.4% were in the same classroom at school and were therefore rated by the same teacher. This suggests that teachers were somewhat more willing to return surveys if both twins were in the same class at school. Female–female twin pairs were slightly more likely to be placed in the same classroom than male–male twin pairs (34.8% vs. 31.5%), and monozygotic (MZ) twins were slightly more likely than dizygotic (DZ) twins to be placed in the same class (36.0% vs. 29.0%). However, chi-square analysis revealed that neither of these effects was statistically significant (p = .46 and p = .14, respectively), indicating that our results for teacher reports are unlikely to be biased by differential response patterns.
Sample Characteristics
Participants in the present study consisted of 605 families of twins (n = 596 pairs) or triplets (n = 9 sets) and their primary caregivers who participated in the first wave of assessment in the USC Study of Risk Factors for ASB. To avoid problems of additional familial interdependency associated with the small number of triplet pairs, a single pair consisting of 2 of the 3 triplets was randomly selected for these analyses. The sample was composed of both male and female MZ and DZ pairs, including both same-and opposite-sex DZ twins. Among the 1,219 child participants, there was approximately equal gender distribution with 48.7% boys (n = 594) and 51.3% girls (n = 625); the 605 caregivers were primarily female (94.2%).
Caregiver participants were primarily biological mothers of the twins and triplets (91.4%; n = 553), although other relatives were also interviewed, including biological fathers (n = 35; 5.8%), stepparents (n = 2; 0.3%), adoptive parents (n = 4; 0.7%), grandparents (n = 7; 1.2%), or other relatives (n = 4; 0.6%). At the time of first-wave assessment, nearly two thirds of the children were living with both biological parents, who were either married or living together but unmarried (55.5% and 7.2% of total sample of families, respectively). Among the remaining families in which the biological parents were not living together (because of separation, divorce, death of the parent, or never having been married), the majority of these were not married or living with a partner at the time of first-wave testing—only 6.2% of the total sample was remarried to another partner. Thus, the majority of the children lived in two-parent households, although 114 twin or triplet pairs (18.8%) did live in a single-parent household with no other adult in the home. The remainder of the children (12.2%) resided with a single parent as well as one or more other adults (mostly grandparents).
The child's ethnicity was determined by the ethnicity of their two biological parents as reported by the primary caregiver. As such, the twin–triplet sample was 26.6% Caucasian (n = 161 pairs), 14.3% Black (n = 86 pairs), 37.5% Hispanic (n = 227 pairs), 4.5% Asian (n = 27 pairs), 16.7% Mixed (n = 101 pairs), and 0.3% other ethnicities (n = 2 pairs). Among the Mixed group, most children (57.4%; n = 58 pairs) had one Hispanic parent, and thus nearly half of the sample (47.1%; n = 281 twin or triplet sets) was of at least partial Hispanic descent. This ethnic distribution is comparable to that in the general Los Angeles population (http://www.census.gov/main/www/cen2000.html) and therefore provides a diverse community sample representative of a large urban area.
Median family income was in the $40,000 to $54,000 range (the midpoint of which is $45,500), which is comparable to the median income in Southern California (including Los Angeles, Orange, Riverside, Ventura, and San Bernardino counties) between 2000 and 2002 (average Mdn = $43,042; http://www.census.gov/cgibin/saipe/saipe.cgi) and the state of California between 2001 and 2003 (average Mdn = $48,979; http://www.census.gov/hhes/income/income03/statemhi.html). Education levels, measured on a 6-point scale, ranged from 1 (less than high school) to 6 (postgraduate degree). Maternal and paternal education levels were significantly correlated (r = .61, p < .01), and significantly higher mean levels of education were reported for mothers (M = 3.70, SD = 1.58) than for fathers (M = 3.53, SD = 1.63), t(552) = 3.43, p < .001. A composite measure of both parents' education levels, occupational status, and family income (Hollingshead, 1975) was used as an index of socioeconomic status (SES) in this study. The distribution of the SES factor was slightly skewed toward higher levels, although there was considerable range in SES in this study.
Zygosity of the same-sex twin pairs was determined for the majority of pairs (398/458 = 87%) through DNA microsatellite analysis (seven or more concordant and zero discordant markers = MZ; one or more discordant markers = DZ). A Twin Similarity Questionnaire (Lykken, 1978) was used to infer zygosity for the remaining 60 pairs for whom adequate DNA samples or results were not available. When both questionnaire and DNA results were available, there was 90% agreement between the two.
The frequencies of the five gender and zygosity groups are presented in Table 1, along with mean age and ethnic distribution. The mean ages during first-wave assessment were 9.60 years (SD = 0.60) for the total sample of children and 40.14 years (SD = 6.61) for their caregivers. Although zygosity groups did not differ in mean age of children at first-wave assessment, F(4, 604) = 0.70, p = .59, there were significant differences in current age of biological mother across groups, F(4, 594) = 3.64, p < .01—mothers of DZ pairs were significantly older compared with mothers of MZ pairs. There was also significant ethnic group variation across these five zygosity groups, χ2(16, N = 605) = 33.82, p < .01—Blacks and Caucasians appeared to be more frequently represented in the DZ groups, whereas a higher percentage of Asians and Hispanics were seen in the MZ groups, particularly among the male participants. These differences may stem from different twinning rates across ethnic groups, due in part to differences in maternal age and use of assisted reproduction methods when conceiving the twins. Although the overall zygosity distribution among same-sex pairs (60.2% MZ) was significantly greater than the expected 50% (p < .01), it was not as markedly high as in most other volunteer samples, in which two thirds of same-sex pairs are typically MZ (Lykken, McGue, & Tellegen, 1987). This sample of children and caregivers appears to be quite representative of both the multiple birth and general population in southern California.
Table 1.
Sample Characteristics
| Pairs |
Child age |
Mom age |
Child's ethnicity |
||||||||
|---|---|---|---|---|---|---|---|---|---|---|---|
| Zygosity-sex | n | % | M | SD | M | SD | % Caucasian | % Hispanic | % Black | % Asian | % Mixed-other |
| MZ male | 138 | 22.9 | 9.57 | 0.55 | 37.56 | 5.63 | 19.6 | 46.4 | 9.4 | 8.7 | 15.9 |
| MZ female | 139 | 23.0 | 9.66 | 0.61 | 38.54 | 6.92 | 21.6 | 38.1 | 12.2 | 4.3 | 23.7 |
| DZ male | 84 | 13.9 | 9.64 | 0.60 | 39.88 | 5.74 | 28.6 | 31.0 | 15.5 | 2.4 | 22.6 |
| DZ female | 97 | 16.0 | 9.55 | 0.55 | 39.43 | 5.29 | 35.1 | 32.0 | 17.5 | 2.1 | 13.4 |
| DZ male-female | 147 | 24.3 | 9.58 | 0.59 | 39.90 | 5.90 | 31.3 | 36.1 | 17.7 | 3.4 | 11.6 |
| Total | 605 | 9.60 | 0.58 | 38.98 | 6.03 | 26.6 | 37.5 | 14.2 | 4.5 | 17.2 | |
Note. Age of biological mother is shown, to allow comparison across zygosity groups for maternal age at birth of twins. Mean age of all caregiver participants was 40.14 years (SD = 6.61). MZ = monozygotic; DZ = dizygotic.
Measures
The present study used a total of 18 different measures of antisocial behavior taken from five different instruments from a total of three unique informants (caregivers, teachers, and children). Instruments varied in terms of their mode of assessment, with some being administered through semistructured interviews (i.e., the Diagnostic Interview Schedule for Children—Version IV [DISC–IV]) and others through questionnaires administered either in an interview format (i.e., the Childhood Aggression Questionnaire [CAQ] and the Child Psychopathy Scale [CPS]) or in paper-and-pencil format (i.e., the Child Behavior Checklist [CBCL]). Each instrument was given to at least two of the three possible informants. The following sections provide detailed information about each of the five instruments, including information about the instrument itself, mode of assessment, informant type, and use of any relevant subscales.
DISC–IV (Schaffer, Fisher, Lucas, Dulcan, & Schwab-Stone, 2000)
The DISC–IV is a highly structured interview designed to assess psychiatric disorders, adapted from the Diagnostic and Statistical Manual of Mental Disorders (4th ed.; DSM–IV; American Psychiatric Association, 1994), and symptoms in children and adolescents ages 6 to 17 years. The DISC was designed to be administered by well-trained lay interviewers for epidemiological research. It has a youth as well as a parallel parent version, both of which inquire about the child's psychiatric symptoms. The Conduct Disorder module was administered using both youth and parent versions in the present study. Although not a focus of the current report, additional modules assessing oppositional defiant disorder, attention-deficit/hyperactivity disorder, major depression, and generalized anxiety in each child were also administered in the parent version. Both symptom counts and diagnoses were provided through computerized scoring of the DISC–IV Conduct Disorder module.
Conduct disorder diagnoses (for the past year) were made for 16 boys (2.7%) and 8 girls (1.3%) based on caregiver reports in the DISC–IV and for 9 boys (1.6%) and 2 girls (0.3%) based on child self-report. Although symptom counts for conduct disorder were significantly correlated between caregiver and youth reports (r = .31, p < .001), it is noteworthy that there was no overlap in conduct disorder diagnoses—that is, no single child reached conduct disorder criteria for both child and caregiver reports. Most likely, this pattern of results is due to the relatively young age of this sample and the fact that this is a population-based (nonclinical) sample. Although diagnosed cases according to one of the raters had elevated symptoms reported by the other rater, these individuals fell short of receiving a corresponding diagnosis from the other rater. In addition, the focus on conduct disorder behaviors during the past year (rather than lifetime prevalence used in most retrospective studies of twins) may have reduced both the prevalence of conduct disorder and the agreement among raters. Nevertheless, given the low prevalence of diagnosable conduct disorder at this age, number of conduct disorder symptoms was used rather than conduct disorder diagnosis. According to caregiver reports, 54.5% of boys and 39.2% of girls had at least one conduct disorder symptom. The corresponding figures for child reports were 47.8% of boys and 30.3% of girls.
The CAQ
This instrument was developed to assess overall, as well as various forms of, aggression. Three parallel forms of this questionnaire were used: (a) child self-report, (b) caregiver's report of child's behavior, and (c) teacher's report of child's behavior. The majority of the items were taken from Raine and Dodge's Reactive and Proactive Aggression Questionnaire (Raine et al., 2006), including 11 reactive items (e.g., “I damage things when I am mad”; “I get mad or hit others when they tease me”) and 12 proactive items (e.g., “I threaten and bully other kids”; “I damage or break things for fun”). In addition, 5 items were added to yield relational aggression in the child and teacher versions (e.g., “I tell stories about people behind their back when I am mad at them”; “When I am mad at someone I tell my friends not to play with them”). Each of the items in the CAQ was rated on a 3-point scale (0 = never, 1 = sometimes, 2 = often), and responses were summed within each of the subtypes, for each of the 3 informants, separately. All three scales showed good internal consistency (Cronbach's alpha ranged from .73 to .76 for child self-report, from .76 to .83 for mother ratings, and from .90 to .92 for teacher ratings).
The CPS (Lynam, 1997)
The CPS is composed of 14 sub-scales (based on 55 yes or no items), which consist of assessments of Glibness, Untruthfulness, Lack of Guilt, Callousness, Impulsiveness, Boredom Susceptibility, Manipulation, Poverty of Affect, Parasitic Lifestyle, Behavioral Dyscontrol, Lack of Planning, Unreliability, Failure to Accept Responsibility, and Grandiosity. Minor changes were made to the wording of some items for ease of understanding by 9- to 10-year-old children. Parallel versions of the CPS were administered to both the child and the caregiver in interview form. The two classic factors of psychopathy (Factor 1: Callous–Unemotional; Factor 2: Impulsive–Irresponsible) were derived in each of the caregiver and child self-reports, based on composites of the 14 subscales in the CPS within each rater. Both Factor 1 and Factor 2 showed reasonable internal consistency in caregiver ratings (α = .71 and .74, respectively), with somewhat lower values in child self-report (α = .63 and .61).
The CBCL (Achenbach, 1991)
The CBCL is a caregiver rating scale composed of 112 items concerning a child's behavior within the past 12 months. Items are rated on a 3-point scale (0 = not true, 1 = sometimes or somewhat true, 2 = very true or often true) and are used to derive eight subscales: Withdrawn, Anxious/ Depressed, Social Problems, Thought Problems, Attention Problems, Delinquent Behavior, Somatic Complaints, and Aggressive Behavior (Achenbach, 1991). For the purposes of the present article, however, only the Delinquent Behavior (13 items) and Aggressive Behavior (20 items) subscales were used in our analyses. The CBCL was administered during the laboratory visit to the caregivers in either survey (paper) or interview form. The CBCL was administered to the caregivers in interview form rather than in paper form if the subject's reading comprehension skills were determined to be at or below a second-grade level as determined by the Woodcock–Johnson Reading Achievement Test (Woodcock & Johnson, 1989). Teachers were also given the parallel form of the CBCL (the Teacher Report Form) as part of the mail survey packet.
Short-Term Reliability
Thirty randomly selected families with complete data (both cotwins and their caregiver) completed the entire first-wave assessment a second time, approximately 6 months following their original laboratory visit. These retest families included exactly 50% of each gender (n = 30 boys; n = 30 girls) and were used to evaluate test–retest reliability for all measures used in this study. This sample was the basis for testing reliability of the measures across time. Test–retest correlations are presented in Table 2, separately for boys and girls, as well as for the combined sample. There was remarkable stability for these measures, although the correlations varied somewhat across rater and sex of child. Greatest stability was observed for caregiver reports, especially for ratings of boys. The lowest correlations in Table 2 are for caregiver ratings of conduct disorder symptoms (.57) and CBCL Delinquency (r = .47) in girls and for girls' self-reported conduct disorder symptoms (r = .56). Inspecting graphical summaries of these correlations, however, revealed 1 outlier—a girl who received low ratings on these measures in the first testing and considerably higher ratings in the second. Written comments from the examiners for this family indicated that this girl had indeed experienced significant behavioral changes in the 6 months in between the two testing sessions (confirmed by both the caregiver and child examiners). Removing this case from this small sample of retest families resulted in higher retest correlations (r > .60 for all three instances). Thus, although there does appear to be considerable reliability in these measures, we must be cognizant of the fact that the potential for developmental change is possible at this age. Therefore, we suspect that these estimates of “short-term” reliability are actually conservative estimates (i.e., underestimates) of the true reliabilities.
Table 2.
Six-Month Test-Retest Correlations for Antisocial Behavior Measures
| Caregiver reports rTime 1-Time 2 |
Child reports rTime 1-Time 2 |
|||||
|---|---|---|---|---|---|---|
| Scale | Boys | Girls | All | Boys | Girls | All |
| Reactive aggression | .93 | .60 | .81 | .78 | .46 | .64 |
| Proactive aggression | .84 | .70 | .79 | .74 | .60 | .67 |
| Relational aggression | — | — | — | .79 | .77 | .68 |
| CPS Factor 1 | .85 | .77 | .81 | .54 | .62 | .61 |
| CPS Factor 2 | .87 | .73 | .81 | .67 | .51 | .61 |
| Conduct disorder symptoms | .88 | .57 | .88 | .75 | .56 | .64 |
| CBCL delinquency | .87 | .47 | .85 | — | — | — |
| CBCL aggression | .84 | .80 | .82 | — | — | — |
| First principal component | .95 | .88 | .94 | .82 | .83 | .81 |
Note. All correlations were highly significant (p < .01). CPS = Child Psychopathy Scale; CBCL = Child Behavior Checklist.
Statistical Analyses
General issues
Descriptive statistics, mean level comparisons, phenotypic correlations, and factor analyses were all conducted using the SPSS (Version 11.5) statistical package. Multivariate genetic analysis of the rater effects models was conducted using the structural equation modeling (SEM) program Mx (Neale, Boker, Xie, & Maes, 2003).
Missing data
Missing data for child- or caregiver reports of the different antisocial behavior measures were quite rare. For most measures, we had valid data for 1,210 to 1,219 of our total sample of 1,219 individual children. Missing data were somewhat greater for child and caregiver ratings of conduct disorder; still, we had complete child and caregiver data for more than 95% of the sample (see Table 3 for individual sample sizes for each measure). As detailed in the methods, the overall teacher response was approximately 60%; however, valid teacher-report data on the antisocial behavior measures were obtained for approximately 700 individual twins (57.4%). Of the 605 individual twin pairs, 269 pairs (44.5%) had teacher reports for both twins, and an additional 143 pairs (23.6%) had teacher reports of antisocial behavior for at least one of the two twins. Of the 269 pairs for whom we had valid teacher-report data for both twins, 111 pairs (41.4%) were in the same classroom at school and were thus rated by the same teacher informant.
Table 3.
Aggression, Delinquency, and Psychopathy: Means and Standard Deviations by Sex and Informant
| Child report |
Caregiver report |
Teacher report |
||||||||
|---|---|---|---|---|---|---|---|---|---|---|
| Scalea | Child's sexb | M | SD | N | M | SD | N | M | SD | N |
| Reactive aggression | Malec,d,e | 1.66 | 0.34 | 593 | 1.71 | 0.33 | 594 | 1.41 | 0.39 | 341 |
| Femaled,e | 1.61 | 0.31 | 623 | 1.63 | 0.33 | 625 | 1.28 | 0.30 | 356 | |
| Proactive aggression | Maled,e | 1.09 | 0.17 | 593 | 1.11 | 0.17 | 594 | 1.16 | 0.26 | 341 |
| Femalec,d,e | 1.06 | 0.12 | 623 | 1.08 | 0.14 | 625 | 1.10 | 0.18 | 356 | |
| Relational aggression | Malee | 1.24 | 0.29 | 593 | — | — | — | 1.28 | 0.35 | 339 |
| Femalee | 1.20 | 0.24 | 623 | — | — | — | 1.28 | 0.35 | 356 | |
| CPS Factor 1 | Malec | 1.30 | 0.10 | 589 | 1.32 | 0.12 | 594 | — | — | — |
| Femalec | 1.27 | 0.08 | 621 | 1.30 | 0.12 | 625 | — | — | — | |
| CPS Factor 2 | Malec | 1.25 | 0.15 | 589 | 1.27 | 0.19 | 594 | — | — | — |
| Femalec | 1.23 | 0.14 | 621 | 1.21 | 0.16 | 625 | — | — | — | |
| CBCL aggression | Male | — | — | — | 6.36 | 5.34 | 589 | 5.76 | 8.25 | 339 |
| Femaled | — | — | — | 5.27 | 5.20 | 624 | 3.64 | 6.46 | 359 | |
| CBCL delinquency | Male | — | — | — | 1.53 | 1.86 | 589 | 1.28 | 2.10 | 339 |
| Femaled | — | — | — | 1.08 | 1.45 | 624 | 0.67 | 1.44 | 359 | |
| Conduct disorder symptoms (DISC-IV) | Malec | 1.12 | 1.91 | 575 | 1.44 | 2.02 | 588 | — | — | — |
| Femalec | 0.64 | 1.29 | 602 | 0.90 | 1.54 | 611 | — | — | — | |
Note. CPS = Child Psychopathy Scale; CPS Factor 1 = Callous-unemotional; CPS Factor 2 = Impulsive-irresponsible; CBCL = Child Behavior Checklist; DISC-IV = Diagnostic Interview Schedule for Children—Version IV.
Possible range of scores is 1–3 for Reactive, Proactive, and Relational Aggression and 1–2 for Child Psychopathy Factor 1 and Factor 2. CBCL scales reported are raw scores, indicating number of items endorsed within each scale, with a maximum possible of 40 for Aggression, 26 for Delinquency, 0–13 for Conduct Disorder Symptoms.
Means for boys and girls are significantly different (p < .01) within each rater for every scale except teacher ratings of relational aggression.
Significant (p < .05) mean differences between caregiver and child.
Significant (p < .05) mean difference between caregiver and teacher.
Significant (p < .05) mean difference between child and teacher.
Missing data were handled in a variety of different ways. For phenotypic analyses of mean level differences and correlations among individual subscales of ASB, a listwise deletion procedure was used, as these analyses are conducted for descriptive purposes only. For the creation of the factor-based composite scores, individuals with missing data on a given measure, within rater, were assigned a missing value for the composite scale. As missing data on individual measures were relatively rare among children and caregivers, we had valid factor scores for more than 96% of the sample (N = 1,175 for child-based factor scores, and N = 1,193 for caregiver-based factor scores). Among the 698 teachers who reported on the antisocial behavior of the children, we could create factor scores for more than 97% of them (N = 681; 55.9% of the total sample of 1,219 individuals).
One of the reasons for selecting Mx for the multivariate twin analyses is that it uses full information maximum-likelihood when fitting models to the raw data. Thus, all pairs in which at least 1 twin has nonmissing data on at least one measure can be included in the analyses, and fit functions are based on the calculation of twice the negative log-likelihood of all nonmissing observations (where an observation is defined by measure, not by individual). For the present analyses, only 1 of the 605 possible pairs did not have any usable data and was excluded from the twin analyses. Nearly all of the 605 pairs (N = 591 pairs, 97.8%) had valid composite scores for both twins based on the caregiver ratings. Over 90% (N = 559 pairs, 92.4%) of the pairs sample had both caregiver and child-report composite scores for both twins, and 42.0% of the sample (N = 254 pairs) had valid data for both twins from caregiver, child, and teacher reports. An additional 130 pairs (21.5% of the sample) had complete data from caregiver and child reports, and teacher report data for 1 member of the twin pair. Although these latter pairs could not contribute information regarding covariance across twins for teacher reports, they did provide information for the sample means and variance of the teacher reports, as well as for the within-person correlations across informants. Thus, including all 384 pairs (63.5%) for whom we had valid teacher reports for at least 1 of the 2 twins minimized potential sampling bias. Patterns of missingness did not vary significantly by sex or zygosity (results of the chi-square analyses are available upon request). For example, valid teacher report data for both twins were available from 40.8% to 48.8% of any given zygosity group. Complete pairwise data for caregiver and child reports were available for more than 92% of any given zygosity group.
Genetic models
The rater models used were based on extensions of the traditional ACE model that is typically used in behavioral genetic studies. These models use information from the observed twin variances and covariances (calculated from the raw data) to partition the overall variance into additive genetic (A), common (or shared) environmental (C), and nonshared environmental (E) influences (Neale & Cardon, 1992).1 In behavioral genetic models, additive genetic influences are correlated 1.0 among MZ twin pairs, as MZ twins have identical genotypes. In contrast, DZ twins share, on average, half of their segregating genes; thus, these models assume a correlation of .5 among DZ pairs. The proportion of variation that is due to genetic influences is called the heritability. Shared environmental factors include those environmental factors that serve to make individuals in a family similar to one another but that may differ across families. Thus, shared environmental influences can include such factors as SES, family structure, and shared peer influences, as well as broader contextual factors (e.g., school or neighborhood effects). In the ACE model, shared environmental influences are correlated 1.0 across twin pairs, regardless of zygosity. Nonshared environmental influences are any environmental influences that serve to make individuals dissimilar, including measurement errors (which are assumed to be random). By definition, nonshared environmental influences do not correlate across either MZ or DZ pairs.
By combining data from all three informants simultaneously in multivariate genetic models, we are able to differentiate genetic and environmental factors that influence a shared view of antisocial behavior from genetic and environmental factors that influence each informant's own particular rating. Moreover, we can also investigate the extent to which rater effects may have biased estimates of heritability of ASB. Figure 1 shows the three multivariate models used to address this issue. All three models are variants of a common pathways model, which allowed for genetic and environmental influences on observed measures to operate through a single underlying phenotype (i.e., AC, CC, and EC; see Kendler, Heath, Martin, & Eaves, 1987; McArdle & Goldsmith, 1990, for details on common pathways models).2 In multiple-rater analyses, the underlying latent variable that allows for correlations across raters reflects a common, or shared, view of the child's antisocial behavior. The genetic and environmental factors that influence this underlying shared view are further unbiased by either rater effects or measurement error, as these latter effects influence only the rater-specific views (this is discussed in more detail later). Each rater's individual view loads on the underlying latent factor through the paths marked λ (with subscripts M, K, and T referring to caregiver [mother], child [kid], and teacher reports, respectively). Genetic and environmental influences that account for variation in the shared view of ASB are depicted through paths aC, cC, and eC (whereby the subscript C refers to influences that are common across raters). As described earlier, all additive genetic influences (A) correlate 1.0 across MZ twins and 0.5 across DZ twins, shared environmental (C) effects correlate 1.0 across twins, regardless of zygosity, and nonshared environmental influences (E) did not correlate across twins. All three models allow for informant-specific nonshared environmental influences (EM, EK, and ET), as any given measure is an imperfect estimate of the underlying “true score”; thus, informant-specific nonshared environmental effects in this model include errors of measure. In contrast, the nonshared environment that influences the common latent factor (EC) represents environmental factors that vary across twins in the same family, which are systematically associated with ASB (e.g., differential parental treatment or different peer groups).
Figure 1.
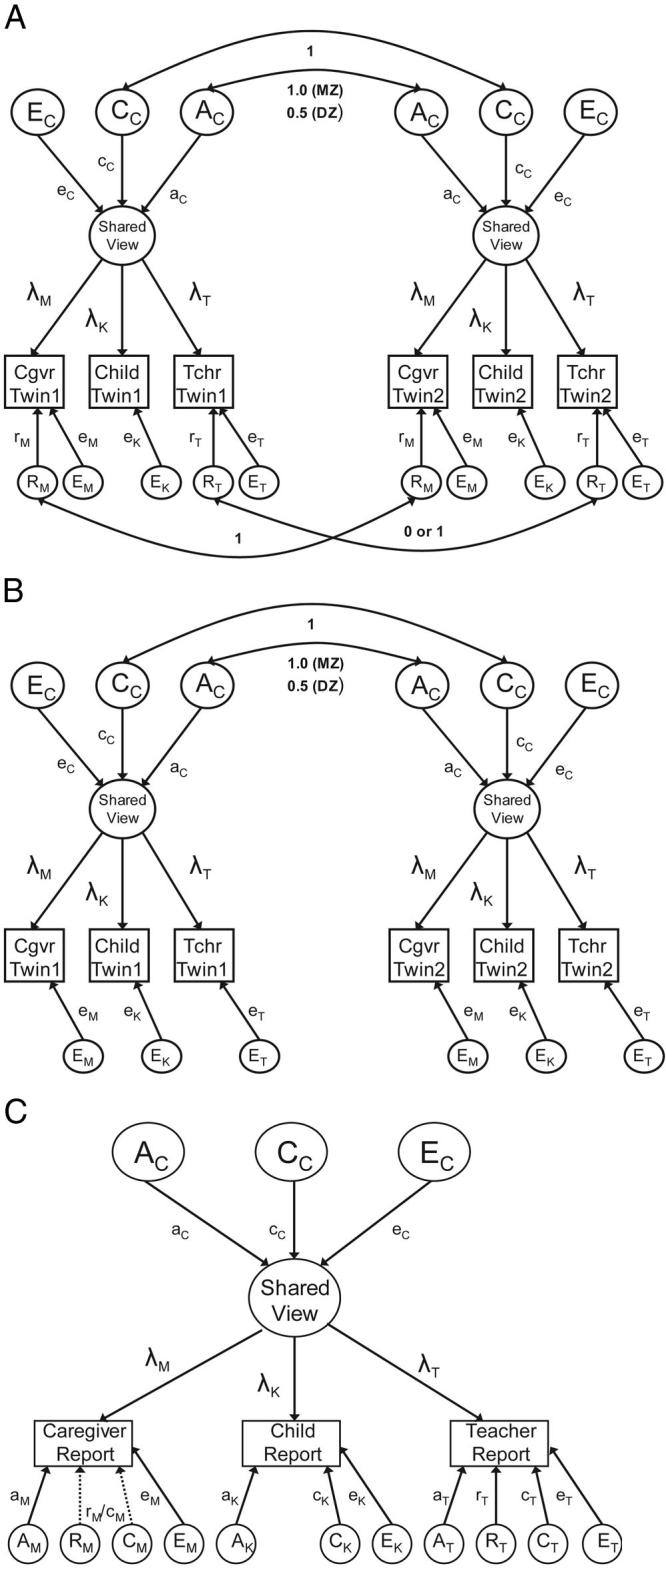
(a) Rater effects model. (b) Measurement model. (c) Full common pathways model. Observed variables are represented by rectangles; latent variables are represented by circles. A = additive genetic effects; C = shared (common) environmental influences; E = nonshared environmental influences; R = rater effects; MZ = monozygotic; DZ = dizygotic; Cgvr = caregiver; Tchr = teacher. Path coefficients with a, c, e, and r correspond to the effects of these latent factors on the observed variables. Paths marked with λ represent the factor loadings on the shared view of antisocial behavior for each individual rater. Factors and corresponding path coefficients that reflect influences on the shared view of antisocial behavior are subscripted with C. The subscripts M, K, and T refer to factors and corresponding path coefficients that are specific to the caregiver (M), child (K), and teacher (T) reports, respectively. All latent A, C, E, and R factors have an assumed variance of 1.0; the variance in the factor representing the shared view has likewise been constrained to unity.
Figure 1a presents the rater effects model, which allows for additional within-informant correlation across twins for caregivers and teachers, due to the fact that the same rater is reporting on behavior for both twins. Individual twins only reported on their own behavior; therefore, it was not possible to estimate rater effects for child reports. As can be seen in Figure 1a, this model (also referred to as the correlated errors model; Simonoff et al., 1995) allows for latent variables representing rater effects to influence variation in caregiver and teacher reports (RM and RT, respectively). To the extent that ratings are influenced by the qualities of the informant, this would affect the ratings of both twins in a pair and may lead to overestimations of the twin correlations. As Figure 1a shows, the correlation for the rater effect among caregiver reports was 1.0, because all caregivers in our sample reported on the behavior of both twins. In contrast, the correlation of the rater effect for teachers could be either 1.0 or 0, depending on whether the same teacher rated both twins (a correlation of 1.0) or whether a different teacher rated each twin (a correlation of 0). By using a feature of Mx that allows for the use of definition variables as moderators of individual parameters (Neale et al., 2003), we were able to use a dummy code for each twin pair as a definition variable that represented whether the twins were in the same classroom (and thus were rated by the same teacher) to multiply the parameter for the teacher rater effect (rT) by either 1.0 (same class) or 0 (different class). If rT > 0, this would predict higher correlations among twins rated by the same teacher.
Figure 1b shows an alternative multivariate model known as the measurement model. This model, which is a restricted version of the model presented in Figure 1a, eliminates the rater effects for caregiver and teacher reports. The critical assumption of the measurement model is that the latent variable representing the shared view is the “true” representation of ASB and that all meaningful genetic and environmental influences on variation in reports of ASB are operating through the latent phenotype. Any residual variance on each rater's individual perception of ASB that is not explained by the latent phenotype is assumed to be random measurement error that is not systematically related to characteristics of the rater and is, therefore, modeled as nonshared environment (E). Thus, the amount of variance accounted for by rater-specific E should be consistent with estimates of the reliability of each rating.
Figure 1c shows the third and final model, which is the full version of the common pathways model for multiple raters. In addition to allowing for the uncorrelated errors of measurement and rater effects (i.e., correlated errors of measurement) found in the aforementioned rater effects and measurement models, this model further allows for specific genetic and shared environmental factors to influence variation in each informant's own ratings of the child's ASB. For simplicity, the model is shown for 1 twin only; however, the specific A and C influences on each informant's report of ASB correlate across twin pairs in the manner described earlier. As shown, the model allows for genetic influence on the specific viewpoints of each rater (AM, AK, and AT). The general assumption is that these genetic factors represent valid genetic variance that arises because each rater “sees” different aspects of ASB (but see the Discussion section for alternative explanations). Similarly, different rater perceptions of ASB can also be influenced by shared environmental factors (CM, CK, and CT). In this model, the potential effect of shared environmental influence on caregiver's reports of ASB is confounded by potential rater effects, both of which would increase correlations of care-giver ratings across twins, regardless of zygosity (see Hewitt et al., 1992, for details). This is represented by the dashed lines for the RM and CM effects. Because of this confound, only one parameter can be estimated in the common pathways model, and this parameter may represent shared environment influences, a rater effect, or some combination of both. In contrast, because only some teachers rate only 1 twin per family, and others rate both twins, the shared environmental influences on teacher reports can be statistically differentiated from potential rater bias. As explained earlier, children reported only on their own behaviors; thus, the common pathways model cannot estimate rater effects for child reports.
The critical difference between this model and the models presented in Figure 1a and 1b is that this model treats differences in reports of ASB across raters as meaningful. In other words, this model assumes that there are systematic causes for disagreement among parents, teachers, and children that are not solely due to random errors of measurement and/or perceptual biases. This model would be consistent with the notion that parents, teachers, and children provide a unique perspective on the child's behavior and that no single informant may necessarily be considered more valid or reliable than another.
Model comparisons
One of the advantages of using SEM to estimate genetic and environmental influences on variation and covariation among traits or behaviors is that SEM provides a framework for evaluating how well the theoretical model (or models) fits the observed behavior. Traditionally, two statistics have been used to compare the fit of two nested models: the likelihood-ratio test (LRT) statistic (Neale & Cardon, 1992) and the Akaike information criterion (AIC; Akaike, 1987; Medsker, Williams, & Holahan, 1994). The LRT is obtained by comparing the −2 log-likelihood (−2 LL) of a comparison model to the −2 LL of a nested (reduced) model. The LRT statistic is the difference in −2 LL between the two models, which is distributed as a chi-square statistic with degrees of freedom equal to the difference in degrees of freedom between the two models. The AIC is calculated as the LRT minus twice the difference in degrees of freedom; it indexes both goodness of fit and parsimony: The more negative the AIC, the better the balance between goodness of fit and parsimony. More recently, the Bayesian information criterion (BIC) is also being used to evaluate model fit. The BIC is similar to the AIC, except that it also adjusts for sample size (for details on the BIC and a comparison of fit statistics using simulated data, see Markon & Krueger, 2004). In this article, we present all three fit statistics, although when there is discrepancy, preference was given to the BIC (adjusted for sample size), based on the results of independent simulation studies (Markon & Krueger, 2004).
Evaluation of model fit for the multivariate analyses is done at two different levels. First, a model is fit to the data that perfectly recaptures the observed means, variances, and within- and cross-twin covariances from the three informants simultaneously. This “saturated” model provides a −2 LL statistic that can be used as the base likelihood from which the AIC and BIC statistics from each theoretical model are calculated, providing a standardized estimate of AIC and BIC values for comparison. Moreover, by comparing the fit of each of our ACE models to the fit of this saturated model using the LRT, we obtain an “absolute” estimate of how well each of our hypothesized models fits the observed data. Second, we can also calculate an LRT statistic by comparing ACE models that are “nested” within each other. We note that the measurement model (Figure 1b) is a nested submodel of the rater effects model (Figure 1a), which is itself a nested submodel of the full common pathways model (Figure 1c); therefore, LRT statistics can be calculated for each set of comparisons. Moreover, the significance of potential sex differences can also be calculated by obtaining LRT, AIC, and BIC values from a model where A, C, and E parameters are allowed to vary by sex with a model that constrains the parameters to be equal for boys and girls.
Results
Sex and Informant Differences in Mean Level ASB
Descriptive statistics (means and standard deviations) for the various rating scales of aggression and delinquency are provided in Table 3, separately for caregiver, child, and teacher reports for boys and girls. These include proactive, reactive, and relational aggression, measured using the CAQ; psychopathy Factor 1 (Callous–Unemotional) and Factor 2 (Impulsive–Irresponsible) obtained on the CPS; the Aggression and Delinquency subscales from the CBCL; and conduct disorder symptom counts from the DISC–IV. Mean differences in ASB were examined between boys and girls, as well as among different informants. Significant sex differences (p < .01) emerged in the expected direction (boys > girls) for all scales except for teacher ratings of relational aggression, which showed no significant sex difference. Antisocial behavior was clearly more prevalent in boys than in girls at this age. These mean level differences were confirmed in the genetic analyses (results are available upon request); thus, means were estimated separately for males and females in all of the twin models. Although not shown in the table, it is noteworthy that diagnostic rates of disorders in this community sample are comparable to those reported in DSM–IV, for both conduct disorder (n = 25 boys, 4.2%; n = 10 girls, 1.6% received diagnoses from either youth or parent interviews) and oppositional defiant disorder (n = 70 boys, 11.9%; n = 49 girls, 8.1%; see Baker et al., 2006). Both the level and the range of ASB in this ethnically diverse community sample of twins thus appear to be comparable to those in other nontwin populations of children.
Several significant differences among informants also emerged (see Table 3). Caregivers provided significantly higher ratings than boys' ratings of themselves for four of the five scales they had in common (reactive aggression, CPS Factors 1 and 2, and conduct disorders, but not proactive aggression). For girls, a similar pattern of higher ratings by caregivers than self-reports was also evident for several scales (proactive aggression, CPS Factor 1, and conduct disorder symptoms), although caregiver ratings of girls were lower for CPS Factor 2 and not significant for reactive aggression. Caregivers thus did not generally rate children higher or lower than children rated themselves across the board, although some rater differences were evident for both genders. Comparisons of teacher and caregiver ratings of boys also revealed significant differences for all scales except CBCL Aggression and Delinquency, although direction of difference again depended on the scale (i.e., teacher ratings lower for reactive aggression, but higher for proactive and relational aggression). The pattern of caregiver–teacher differences was similar in girls, whereby teachers again provided significantly lower ratings for reactive aggression, and all three CBCL scales, but higher ratings for proactive aggression. Teacher ratings were also significantly lower than child self-report for reactive aggression in both boys and girls, but higher for proactive aggression. Although not shown in the table, there were no differences in caregiver or child reports between children with teacher reports and children without teacher reports (results are available upon request).
The Unidimensionality of ASB in Childhood
Phenotypic correlations
We next tested whether each of the indices of antisocial behavior could be considered manifestations of a single higher order construct of externalizing behavior. We examined this through both correlational and principal-components analysis of the various ASB measures obtained through each rater. Table 4 presents the full correlation matrix (18 × 18) for boys (above the diagonal) and girls (below the diagonal). Moderate to high correlations were found among the scales of aggression and delinquency within each rater, with correlations ranging from .47 to .66 among child report measures, from .40 to .62 among caregiver report measures, and from .61 to .78 among the teacher report measures.
Table 4.
Phenotypic Intercorrelations Between Aggressive and Antisocial Behavior Measures for Boys (Above the Diagonal) and Girls (Below the Diagonal)
| Measure | 1 | 2 | 3 | 4 | 5 | 6 | 7 | 8 | 9 | 10 | 11 | 12 | 13 | 14 | 15 | 16 | 17 | 18 |
|---|---|---|---|---|---|---|---|---|---|---|---|---|---|---|---|---|---|---|
| Child self-report | ||||||||||||||||||
| 1. Reactive aggression | — | .46 | .56 | .40 | .48 | .42 | .24 | .13 | .17 | .18 | .18 | .20 | .22 | .28 | .17 | .12 | .16 | .23 |
| 2. Proactive aggression | .48 | — | .69 | .52 | .47 | .45 | .16 | .24 | .18 | .15 | .29 | .20 | .23 | .19 | .24 | .17 | .24 | .23 |
| 3. Relational aggression | .54 | .62 | — | .53 | .47 | .47 | .18 | .23 | .21 | .18 | .30 | .25 | .25 | .28 | .29 | .26 | .28 | .31 |
| 4. CPS Factor 1 | .39 | .48 | .52 | — | .60 | .50 | .14 | .16 | .17 | .24 | .28 | .24 | .21 | .21 | .16 | .15 | .20 | .22 |
| 5. CPS Factor 2 | .46 | .41 | .50 | .57 | — | .47 | .15 | .12 | .11 | .24 | .21 | .18 | .18 | .20 | .16 | .10 | .19 | .17 |
| 6. Conduct disorder symptoms | .34 | .39 | .40 | .49 | .37 | — | .11 | .21 | .18 | .16 | .26 | .16 | .29 | .27 | .29 | .18 | .27 | .26 |
| Caregiver ratings | ||||||||||||||||||
| 7. Reactive aggression | .19 | .15 | .06 | .09 | .13 | .10 | – | .56 | .46 | .51 | .38 | .60 | .41 | .29 | .24 | .14 | .20 | .21 |
| 8. Proactive aggression | .10 | .13 | .06 | .11 | .13 | .13 | .63 | — | .54 | .37 | .50 | .56 | .49 | .24 | .26 | .18 | .32 | .25 |
| 9. CPS Factor 1 | .12 | .12 | .08 | .10 | .11 | .11 | .52 | .57 | — | .54 | .49 | .53 | .49 | .22 | .29 | .21 | .28 | .31 |
| 10. CPS Factor 2 | .13 | .15 | .14 | .16 | .21 | .15 | .55 | .47 | .55 | — | .46 | .55 | .41 | .27 | .27 | .21 | .31 | .35 |
| 11. CBCL delinquency | .09 | .14 | .10 | .11 | .15 | .13 | .40 | .48 | .49 | .44 | — | .62 | .62 | .27 | .33 | .25 | .43 | .40 |
| 12. CBCL aggression | .17 | .15 | .13 | .15 | .15 | .15 | .62 | .62 | .57 | .57 | .62 | — | .50 | .31 | .28 | .19 | .31 | .35 |
| 13. Conduct disorder symptoms | .12 | .14 | .08 | .12 | .16 | .16 | .43 | .53 | .51 | .40 | .53 | .45 | — | .40 | .45 | .38 | .50 | .46 |
| Teacher ratings | ||||||||||||||||||
| 14. Reactive aggression | .02 | −.01 | .05 | .08 | .05 | .14 | .16 | .12 | .19 | .26 | .23 | .24 | .16 | — | .73 | .69 | .62 | .76 |
| 15. Proactive aggression | .07 | .06 | .05 | .08 | .01 | .17 | .16 | .15 | .22 | .25 | .26 | .26 | .18 | .80 | — | .79 | .78 | .79 |
| 16. Relational aggression | .05 | .07 | .06 | .09 | .02 | .13 | .13 | .09 | .23 | .27 | .26 | .23 | .19 | .73 | .76 | — | .68 | .70 |
| 17. CBCL delinquency | .07 | .07 | .04 | .17 | .10 | .16 | .13 | .15 | .27 | .26 | .33 | .22 | .26 | .56 | .66 | .62 | — | .80 |
| 18. CBCL aggression | .07 | .00 | .00 | .07 | .05 | .09 | .19 | .16 | .29 | .31 | .32 | .29 | .32 | .77 | .73 | .68 | .70 | — |
Note. All correlations are significant (p < .05) except those noted in italics. Interrater agreement correlations are noted in boldface. CPS = Child Psychopathy Scale; CBCL = Child Behavior Checklist.
Additional comparisons of caregiver, teacher, and child reports of ASB were made by computing correlations between informants for the various scales (see Table 4). Informant agreement (indicated in boldface type in Table 4 for each measure common to two or more raters) was lowest between the child and either the caregiver or teacher (r = .17 to .29 for boys; r = .02 to .21 for girls). Agreement between caregiver and teacher ratings was somewhat higher (r = .26 to .43 for boys; r = .10 to .21 for girls) across the board. Although not shown in Table 4, correlations across raters for the composite measure of antisocial behavior (described in the next section) were also significant: r = .30 for caregiver–child agreement, r = .23 for child–teacher agreement, and r = .44 for caregiver–teacher agreement (sexes combined).
Principal-components analysis
Although all of the within-rater correlations were significant and were of moderate to high magnitude, they were not unity, which at first blush might indicate that heterogeneity of ASB may exist in these preadolescent children. The positive manifold of correlations within each rater, however, is suggestive of a single, general factor of antisocial behavior underlying the various measures. Principal-components analyses of the ASB scales within each rater confirmed that a single factor could account for much of the variance among these measures. Loadings on the first principal component within each rater are provided in Table 5, along with the percentage of variance explained among the scales in each case. All factor loadings were .70 or higher, and the general ASB factor accounted for 57.4% of the variance among the child report measures of ASB, 58.7% of variance among caregiver reports, and 77.4% of variance among teacher reports. Within each rater, scree plots clearly indicated a strong preference for a single principal component, such that only the first eigenvalue exceeded 1.0 (i.e., 3.44 for child report measures, 4.11 for caregiver ratings, and 3.87 for teacher ratings) with the second eigenvalue being clearly less than 1.0 in all three analyses (0.70, 0.72, and 0.41 for child, caregiver, and teacher ratings, respectively). It would thus appear that there is considerable overlap between the individual ASB scales, consistent with the notion of a general externalizing factor (Krueger, 2002). We therefore computed composite measures of ASB for each rater (using factor-weighted scores), and used these in the multivariate genetic models. It is noteworthy that the 6-month test–retest correlations were strong for the composite scores (r = .81 for child reports and .94 for caregiver reports) and that interrater agreement for the three composites (r = .30 between caregiver and child, r = .23 between child and teacher, and r = .44 between caregiver and teacher) was comparable to—and, in many instances, higher than—the values for each individual scale reported in Table 4. Although the parameter estimates obtained via maximum-likelihood estimation in Mx are largely robust to violations of nonnormality (Neale et al., 2003), given the slightly skewed nature of the ASB composite scores, we opted to use log-transformations to approximate normality; therefore, the biometrical model-fitting analyses were performed using the transformed scores. Parameter estimates for untransformed data were nearly identical to the results presented in this article (results are available upon request).
Table 5.
Factor Loadings for First Principal Component of Aggressive and Antisocial Behavior Measures Within Rater
| Scale | Child self-report |
Caregiver ratings |
Teacher ratings |
|---|---|---|---|
| Reactive aggression | .72 | .76 | .87 |
| Proactive aggression | .78 | .78 | .92 |
| Relational aggression | .82 | — | .85 |
| CPS Factor 1 (Callous-Unemotional) | .78 | .77 | — |
| CPS Factor 2 (Impulsive-Irresponsible) | .75 | .73 | — |
| CBCL delinquency | — | .76 | .85 |
| CBCL aggression | — | .83 | .87 |
| Conduct disorder symptoms | .70 | .73 | — |
| % variance | 57.4 | 58.7 | 77.4 |
Note. CPS = Child Psychopathology Scale; CBCL = Child Behavior Checklist.
Genetic Factor Models: Results From Multivariate Rater-Effects Models
The −2LL of the fully saturated comparison model was 7,835.34 (df = 2914). This model perfectly recaptured observed means and covariances and was therefore used to establish the adequacy of fit for each of the multivariate models shown in Figure 1. As previous analyses showed significant differences in mean level across gender (confirmed using Mx-based analyses of the composite ASB scores; results are available upon request), all subsequent multivariate models allowed for gender differences in mean levels for all three raters.3 The −2LL of the measurement model (see Figure 1b) was 8,161.42 (df = 3027). In comparison with the saturated model, this model fit the data very poorly by all three fit criteria (LRT = 326.08, df = 113, p < .001; AIC = 100.1, BIC = 169.8). Comparing the standard rater effects model (see Figure 1a) with the measurement model indicates that the addition of the parameters representing “correlated errors” among caregivers and teachers results in a highly significant improvement in fit (−2LL = 8,029.27, df = 3023; LRT = 132.2, df = 4, p < .001). Although the LRT statistic for the rater effects model based on a comparison with the saturated model was still highly significant (LRT = 193.93, df = 109, p < .001), both the AIC (−24.1) and the BIC (−868.2) statistics were less than zero, indicating that this model could adequately fit the observed patterns of means and variance–covariance. Nevertheless, the full common pathways model (see Figure 1c) further offered a significant improvement in fit relative to the rater effects model (−2LL = 7,965.21, df = 3013; LRT = 60.4, df = 4, p < .001). The AIC (−68.1) and the BIC (−884.1) statistics were the most negative for the common pathways model, indicating that a model that allowed for genetic and shared environmental influences on rater-specific reports of ASB in addition to the genetic and environmental influences operating through the latent variable was the best model to fit the data. In comparison with the saturated model, this model also showed a significant difference in fit by LRT criteria, indicating that the estimated variance and covariance from this model was significantly different from the observed variance and covariance, but at a much lower probability value than the other two models (LRT = 129.87, df = 99, p = .03). Finally, a model that constrained all of the parameter estimates from the common pathways model (except mean levels) to be the same for boys and girls yielded the lowest BIC statistic (−893.3), although the AIC statistic (−68.0) was nearly identical to the AIC statistic from the model that allowed these parameters to vary across gender. The −2LL for this model was 7,995.38 (df = 3028).4
Standardized parameter estimates from the full common pathways model with equal effects across gender are provided in Figure 2. Estimates shown to be statistically significant at p < .05 are indicated with an asterisk (based on results of post hoc analyses; these analyses are available upon request). As shown, the common ASB factor underlying all three raters was primarily explained by genetic influences, with a heritability of .96 and no effect of shared twin environment. (In order to calculate estimates for proportions of variation, each standardized parameter estimate shown in Figure 2 is squared; i.e., h2 of shared view = .982.) Only a small proportion of variation in the underlying latent factor (.04) was explained by nonshared environmental influences (.192). Moreover, post hoc analyses indicated that these nonshared environmental influences were not statistically significant and that all variation in the latent ASB factor representing the shared view could be accounted for entirely by genetic influence (i.e., the h2 of the latent factor = 1.0). Figure 2 also demonstrates that the latent factor representing the shared viewpoint accounted for only 17.6% of the overall variation in child reports (.422) but explained approximately one third (.552 = .303) and nearly half (.672 = .449) of the variation in teacher and caregiver reports, respectively.
Figure 2.

Standardized parameter estimates from full common pathways model. Paths marked with an asterisk are significantly different from zero. A = additive genetic effects; C = shared (common) environmental influences; E = nonshared environmental influences; R = rater effects. Factors influencing the underlying latent shared view of antisocial behavior are subscripted with C. The subscripts M, K, and T refer to factors that are specific to the caregiver (M), child (K), and teacher (T) reports, respectively. For Caregiver Report, rater effects (RM) and shared environmental effects (CM) cannot be statistically differentiated in this design. Thus, these influences are noted as a single path coefficient that may reflect either or both effects on variation in caregiver reports. All latent A, C, E, and R factors have an assumed variance of 1.0; the variance in the factor representing the shared view was likewise constrained to unity.
The aforementioned series of analyses indicate that models with nonrandom effects on rater-specific views of ASB provided a better fit to the data than the model, which assumed individual reports for each twin were influenced solely by random errors of measurement. As can be seen in Figure 2, correlated errors for caregiver reports, which could reflect rater effects, shared environmental influences, or both, accounted for 14.4% (.382) of the overall variation in caregiver reports and were significant. Rater effects accounted for more than one fourth of the variation in teacher reports (.532 = .281) and were significantly different from zero, as were shared environmental effects, which accounted for an additional 20.3% (.452) of the variation in teacher reports. Informant-specific shared environmental factors accounted for a nonsignificant amount of variation in child reports (.152 = .023). Finally, informant-specific genetic factors accounted for only a modest proportion of the overall variation in caregiver (.242 = .058) and teacher (.332 = .109) reports and were not significantly different from zero. In contrast, genetic factors accounted for nearly one third (.552 = .303) of the overall variation in child reports and were significant at p < .05.
Table 6 summarizes the proportions of variation in each informant's report due to the various genetic, environmental, and rater-effects factors. In this table, we separated the influences that are common to each informant from the influences that are informant specific.5 A number of patterns are visible in the table. First, overall, genetic factors account for moderate amounts of variation in reports of ASB for all three raters, with heritabilities ranging from .397 (for teacher reports) to .495 (for caregiver reports). Nevertheless, an interesting pattern emerged with respect to the source of the genetic variance. For caregivers, the majority of the genetic variance (88.1%) came from the genetic influence operating through the shared view of ASB. In contrast, for child reports, only about one third of the overall genetic variation came from genetic influence operating on the shared view of ASB, and the majority of the genetic variation (64.4%) came from genetic influence on ASB that was specific to the child's own self-rating. Teacher reports were somewhat in the middle but were more similar to caregiver ratings in that the majority of the genetic variance (72.8%) came from the genetic influence operating through the shared view of ASB. This is consistent both with the result that the child reports load less strongly on the underlying latent factor than caregiver or teacher reports and with the finding of significant informant-specific genetic influence only for child and not for caregiver or teacher reports.
Table 6.
Proportions of Variance Explained by Genetic and Environmental Influence: Summary of Results from the Full Common Pathways Model
| Source of influence | Caregiver | Child | Teacher |
|---|---|---|---|
| Genetic | |||
| Common factor | .436 | .168 | .289 |
| Informant-specific | .059 | .304 | .108 |
| Total | .495 | .472 | .397 |
| Shared Environment/Rater Effects | |||
| Common factor | .000 | .000 | .000 |
| Informant-specifica | .146 | .021 | .203 |
| Rater effects (correlated errors)b | .281 | ||
| Total | .146 | .021 | .484 |
| Nonshared Environment | |||
| Common factor | .016 | .006 | .011 |
| Informant-specific | .344 | .500 | .108 |
| Total | .360 | .506 | .119 |
Informant-specific shared environment and rater effects cannot be differentiated in caregiver reports.
Rater effects are not applicable in child reports.
The second notable pattern is that environmental influences, both shared and nonshared, influenced individual rater reports of ASB but did not play a large role in the shared view. For child reports, there was virtually no support for the effects of shared environmental factors on variation in ASB. Instead, nonshared environmental factors played a critical role in accounting for individual differences in reports of ASB and in fact accounted for a slight majority (50.6%) of the overall phenotypic variation. For caregiver reports, there were significant effects of either shared environmental influence or rater effects; however, these effects explained only a modest amount of the overall phenotypic variation (14.6%). Nonshared environmental influences accounted for roughly one third of variance in caregiver reports of ASB (36.0%). Unlike caregiver ratings, we did have the ability with teacher ratings to differentiate between shared environmental factors and rater effects. Rater effects accounted for approximately 28.1% of the variance in teacher reports, and shared environmental factors accounted for an additional 20.3% of the variance. Nonshared environmental factors showed only modest influence on teacher ratings (11.9%).
Discussion
This article provides one of the first reports from a major longitudinal twin study of childhood aggression and antisocial behavior among a large ethnically diverse sample of twins. In this study, we focused on phenotypic and genetic analyses of antisocial behavior measures during a first wave of assessment at ages 9 to 10, when twins are on the cusp of adolescence. Instead of relying on information from one source (i.e., teacher or parent ratings of child behavior problems), we obtained ratings from 3 informants. The purpose of this article was to evaluate rater effects on the genetic and environmental influences on a shared view of antisocial behavior, using a composite measure based on a variety of types of aggressive and antisocial behavior.
In the present study we relied on composite measures of antisocial behavior created from 18 different subscales. Within each rater, subscales of reactive, proactive, and relational aggression; childhood psychopathy factors; and delinquent behavior measures (including conduct disorder symptoms) were all moderately to highly correlated with each other. These correlations (nearly uniform within each rater), as well as the results from our principal-components analyses, suggested the presence of a general antisocial or “deviance” factor underlying the various subscales provided by each rater. This general factor may be comparable to an overall externalizing factor that has been proposed by others (Achenbach & Edelbrock, 1981; Krueger et al., 2002) and reflects the wide range of behaviors exhibited by these preadolescent children. Although still somewhat negatively skewed, this general deviance factor well characterized the “shades of gray” in individual differences for antisocial behavior in this large sample and has proven useful in examining relationships with various biological (Jacobson, Zumberge, Lozano, Raine, & Baker, 2005) and social risk factors (Sanchez, Baker, & Raine, 2005) in this sample. Our continuous ASB factor may therefore reflect a wider spectrum of ASB than what is captured when relying on symptom counts (e.g., in Burt, McGue, Krueger, & Iacono, 2005) or on extreme forms of disruptive behavior, substance use, or criminal offending.
Our analyses revealed that although mean levels of ASB differed for boys and girls, the sources of individual differences in ASB were similar across gender. One of the most important findings from this study is that a shared view of antisocial behavior is strongly genetically influenced, with little or no effect of shared sibling environment. Although our analyses revealed a moderate genetic basis to individual views of antisocial behavior, with heritabilities ranging from .40 to .50 for individual composites from child, teacher, and caregiver, the estimated heritability of the underlying shared view of antisocial behavior from the common pathways model was nearly 1.0. This latent factor may reflect constellations of stable personality traits (e.g., disinhibition, lack of constraint) that may influence antisocial behavior across many contexts (Krueger et al., 2002). This highly heritable common factor representing the shared view across multiple informants could therefore prove especially useful in future investigations of specific genetic associations, or quantitative trait loci, in human aggression and antisocial behavior.
In this ethnically diverse sample of twins, heritability estimates within each rater are comparable to estimates from previous studies, which have been based primarily on Caucasian and European samples. Genetic influences for caregiver reports in our study are somewhat higher than those reported for young children in these reviews but are comparable to other recent twin studies of younger schoolchildren (Arsenault et al., 2003). The somewhat higher heritability in the present study may be due in part to our use of a general composite measure of antisocial behavior, which may be more reliable than individual subscales typically used. We have, in fact, found the pattern of genetic and environmental influences to be more variable when examining specific subscales (Raine, Baker, & Liu 2006, 2007; Ward, 2004).
Interrater agreement among caregiver, teacher, and child reports of aggression and antisocial behavior in the present study is comparable to that of other studies (Achenbach et al., 1987; Youngstrom, Loeber, & Stouthamer-Loeber, 2000); agreement is lowest between the child and either the caregiver or teacher and somewhat higher between caregiver and teacher ratings. This suggests that although there is clearly a significant degree of overlap among raters, each individual viewpoint is influenced by unique factors. Of particular importance was the identification of significant rater variance for both caregiver and teacher reports. Although we are considering these caregiver and teacher rater effects to be biases due to having the same rater report on both twins, other explanations for these “correlated errors” are possible. Specifically, among caregiver reports, it is not possible to disentangle rater effects from true effects of shared environmental influences (Hewitt et al., 1992). For example, family-level variables such as parental discipline may influence levels of antisocial behavior for twins in the same family. This shared environmental effect would also account for the correlated view in our model. Regardless of the specific source of the correlated view among caregivers, it is noteworthy that these effects accounted for a relatively modest (albeit statistically significant) proportion of variation (15%) in caregiver reports.
In contrast, for teacher reports, we were able to differentiate rater effects from true shared environmental effects, because although virtually all twins attended the same school, less than half of twin pairs were in the same classroom at school. This allowed us to disentangle shared environmental influences, which would affect the similarity of all twin pairs, regardless of classroom, from rater effects, which would only increase similarity among twins who were rated by the same teacher. In this study, rater effects accounted for more than one fourth (28.1%) of the overall variation in teacher reports. This indicates that the twins in the same classroom are rated more similarly than twins in different classrooms. Although we speculate that this is due to rater bias on the part of the teacher, it is theoretically possible that twins in the same classroom may in fact have a greater shared environment than those in separate classrooms (i.e., a direct classroom effect on behavior). To investigate this possibility, we examined post hoc whether caregiver or child ratings were also more similar if twins were in the same classroom at school, using the same dummy code for shared classroom that we used to evaluate the teacher rater effects (as described earlier). The results of these post hoc analyses indicate that being in the same classroom at school had virtually no effect on twin similarity of antisocial behavior as rated by either caregivers or the twins themselves. Being in the same classroom at school, therefore, does not lead to increased twin similarity in ASB based on either the caregiver's or the child's own view. Thus, our findings suggest that reports from teachers may be more heavily influenced by rater bias effects than are ratings from other reporters, leading to a spurious effect of shared environment when teacher reports are examined alone. However, in the absence of direct observational data, we cannot rule out the possibility that twins in the same classroom behave more similarly while at school. Nevertheless, if this is the case, it is important to note that these “classroom effects” are situational specific and do not affect similarity of behavior in other contexts.
In addition to these specific rater effects, shared environmental factors accounted for a significant 20% of the variation in teacher reports. These influences may reflect the effects of school context on ASB. For example, Rowe and colleagues conducted a behavioral genetic analysis within a hierarchical linear modeling framework and found that aggregate levels of parental warmth moderated both mean level of aggression as well as the overall impact of genetic and environmental influences on individual differences in aggression, with higher shared environmental influences on aggression found among twins and siblings from schools with lower average levels of parental warmth (Rowe, Almeida, & Jacobson, 1999). Their findings suggest that environmental context, measured at the school level, not only moderates mean levels of ASB but may also alter the sources of individual differences in ASB.
It is important to note that there was no indication that caregivers or teachers moderated their views of twin similarity on the basis of the twins' zygosity. If caregivers or teachers were more likely to rate MZ twins more similarly than DZ twins, this would result in higher within-rater correlations for MZ twins than for DZ twins and would be interpreted in our model as specific genetic influences. The lack of specific genetic influence on either care-giver or teacher reports indicates that the rater effects we discovered did not upwardly bias estimates of heritability, nor can they be related to any characteristic of the child that is genetically influenced.
A different pattern emerged for the child's own report of ASB, with at least two important findings. First, the child's view contributes less weight to the shared view of ASB. Although the latent factor representing the shared view accounts for between 30% and 45% of the variation in caregiver reports and teacher reports, it accounts for only 17.6% of the variation in child reports. It is possible that children at this age are less reliable reporters of ASB. Such an interpretation is consistent with the fact that the 6-month test–retest correlations are somewhat lower for child reports than for caregiver reports (see Table 2) and with the higher estimate of specific nonshared environmental influence on child reports, as nonshared environmental effects include measurement error. On the other hand, the other notable finding is that child reports are the only reports that show evidence for statistically significant specific genetic influence, which may reflect genetic influence on ASB which occurs outside the radar of parent or teacher perception. If this is the case, our results may indicate that reports of ASB from children are more comprehensive and, therefore, more accurate than caregiver or teacher reports. Alternatively, the significant genetic influence on child reports may simply reflect some sort of response bias, which is correlated with genetically influenced personality traits, such as social desirability or overall honesty. Future analysis using cotwin reports of ASB may help untangle genetically influenced rater bias effects from “real” genetic influence on child reports of ASB.
Finally, our results are consistent with the idea that the greater shared environmental influence found among childhood ASB relative to adult ASB may actually be an artifact of rater bias, as studies of children often rely on caregiver or teacher reports. In this study, when young children are asked to report on their own ASB, there is no evidence for significant shared environmental influences, nor do shared environmental influences account for variation in the shared view of ASB. This is consistent with other studies that have found that much of the shared environmental variation in parent reports can be attributed to rater effects (e.g., Hewitt et al., 1992; although see Bartels et al., 2003, 2004, for contradictory results) and is consistent with the meta-analysis by Rhee and Waldman (2002), which found that shared environmental influences on ASB were higher for parental reports than for child self-reports.
The present study should be viewed in the context of several potential limitations. First, we have chosen to “lump” rather than “split” various types of ASB in these analyses. The magnitude and nature of genetic and environmental influences in ASB may very well vary across different types of ASB (e.g., Tackett, Krueger, Iacono, & McGue, 2005), a possibility we have examined in a separate article, which does suggest some distinction between aggressive–psychopathic behavior and nonaggressive delinquency, based on the underlying genetic and environmental architecture (Jacobson, Baker, & Raine, 2007). Second, the age of the sample resulted in relatively low average rates of ASB, which may limit the generalizability of these findings. We note, however, that these children and their families appeared to be a representative sample of this urban community, as their ethnic distribution and socioeconomic levels were comparable to those of the local population. Children also exhibited a wide range of behaviors, including some serious conduct problems. Third, results concerning the teacher reports should be viewed with some caution, given the somewhat modest teacher participation rate (60%). Still, teacher participation was not influenced by sex or zygosity of the twins, suggesting that our results are not an artifact of unequal participation of teachers. Moreover, we found no evidence for systematic bias due to this lower response, as caregiver and child-rated ASB did not differ for those whose teachers did and did not participate (results are available upon request). Finally, we have yet to identify the source of the strong genetic effect on the shared view of ASB found in this sample. Ongoing analyses are attempting to address this by examining the genetic covariation of the ASB measures with putative biological endophenotypes, including psychophysiological, neurocognitive, and personality measures (e.g., Baker, Isen, Bezdjian, & Raine, 2005; Jacobson et al., 2005). Additional waves of assessment are also ongoing (Wave 2, ages 11–12) with future waves planned and funded through age 17. The Wave 1 assessments of antisocial behavior described in the present article therefore provide an important basis for investigating genetic and environmental influences on the emergence of antisocial behavior in American youth throughout the course of adolescence.
Footnotes
This study was supported by National Institute of Mental Health (NIMH) Grant NIMH R01 MH58354 to Laura A. Baker and NIMH Independent Scientist Award K02 MH01114-08 to Kristen Jacobson. We wish to thank the University of Southern California twin project staff, for assistance in data collection and scoring, and the twins and their families, for their participation in this research.
Preliminary univariate analyses within each informant addressed whether models with nonadditive genetic variance fit better than models with common environmental variance (i.e., ACE vs. ADE models) and whether there was evidence for sibling interaction effects. Results indicated that the ACE model without sibling interaction effects was the best model for each informant (results are available upon request).
We also fit less stringent independent pathways and Cholesky models to our data. Based on Bayesian information criterion values, the common pathways model offered a better balance of goodness of fit and parsimony than either of these other less restrictive models.
Changing the order of the multivariate model comparisons does not change the fit statistics for the three models and therefore leads to the same conclusions. For ease of interpretation, we begin with the most restrictive model (the measurement model; see Figure 1b) and end with the least restrictive model (the common pathways model; see Figure 1c).
A model that further loosened the constraint that the genetic and environmental factors common to all three raters operate through a single underlying latent phenotype did not significantly improve fit relative to the more restricted common pathways model. The −2LL from this independent pathways model was 7,991.03 (df = 3024) with AIC = −64.3 and BIC = −889.0.
Estimates of the proportion of variance accounted for by the rater-specific effects were calculated by squaring the rater-specific paths shown in Figure 2. Estimates of genetic and environmental variance due to the common genetic and environmental factors were calculated by squaring the product of the factor loading that corresponds to the individual rater and the parameter estimate for the common genetic or environmental factor—that is, variance in child reports due to common nonshared influence is (.42 × .19)2 = .006. Estimates were calculated by Mx with parameters estimated to the fourth decimal place; thus, calculations based on paths shown in Figure 2 may vary slightly from those shown in Table 6 because of rounding error.
References
- Achenbach TM. Integrative guide for the 1991 CBCL/4–18, YSR, and TRF profiles. University of Vermont, Department of Psychiatry; Burlington: 1991. [Google Scholar]
- Achenbach TM, Edelbrock CS. Behavioral problems and competencies reported by parents of normal and disturbed children aged four through sixteen. Monographs of the Society for Research in Child Development. 1981;46:82. [PubMed] [Google Scholar]
- Achenbach TM, McConaughy SH, Howell CT. Child/adolescent behavioral and emotional problems: Implications of cross informant correlations for situational specificity. Psychological Bulletin. 1987;101:213–232. [PubMed] [Google Scholar]
- Akaike AC. Factor analysis and AIC. Psychometrika. 1987;52:317–332. [Google Scholar]
- American Psychiatric Association . Diagnostic and statistical manual of mental disorders. 4th ed. Author; Washington, DC: 1994. [Google Scholar]
- Arsenault L, Moffit TE, Caspi A, Taylor A, Rijsdijk FV, Jaffee SR, et al. Strong genetic effects on cross-situational antisocial behaviour among 5-year-old children according to mothers, teachers, examiner–observers, and twins' self-reports. Journal of Child Psychology & Psychiatry. 2003;44:832–848. doi: 10.1111/1469-7610.00168. [DOI] [PubMed] [Google Scholar]
- Baker LA. Biological theories (of violence) In: Gottesman R, Brown RM, editors. Violence in America: An encyclopedia. Vol. 3. Scribner; New York: 1999. pp. 307–311. [Google Scholar]
- Baker LA, Barton M, Lozano DI, Raine A, Fowler J. The Southern California Twin Register at the University of Southern California: II. Twin Research and Human Genetics. 2006;9:840–933. doi: 10.1375/183242706779462912. [DOI] [PMC free article] [PubMed] [Google Scholar]
- Baker LA, Barton M, Raine A. The Southern California Twin Register at USC. Twin Research. 2002;5:456–459. doi: 10.1375/136905202320906273. [DOI] [PMC free article] [PubMed] [Google Scholar]
- Baker LA, Isen J, Bezdjian S, Raine A. Are personality traits endophenotypes for antisocial behavior? Behavior Genetics. 2005;35:831. [Google Scholar]
- Baker LA, Mack W, Moffitt TE, Mednick SA. Sex differences in property crime in a Danish adoption cohort. Behavior Genetics. 1989;19:355–370. doi: 10.1007/BF01066164. [DOI] [PubMed] [Google Scholar]
- Bartels M, Boomsma DI, Hudziak JJ, Rietveld MJH, van Beijsterveldt TCEM, van den Oord EJCG. Disentangling genetic, environmental, and rater effects on internalizing and externalizing problem behavior in 10-year-old twins. Twin Research. 2004;7:162–175. doi: 10.1375/136905204323016140. [DOI] [PubMed] [Google Scholar]
- Bartels M, Hudziak JJ, Boomsma D, Rietveld MJH, Van Beijsterveldt TCEM, van den Oord EJCG. A study of parent ratings of internalizing and externalizing problem behavior in 12-year-old twins. Journal of the American Academy of Child and Adolescent Psychiatry. 2003;42:1351–1359. doi: 10.1097/01.CHI.0000085755.71002.5d. [DOI] [PubMed] [Google Scholar]
- Bohman M. Some genetic aspects of alcoholism and criminality: A populaiton of adoptees. Archives of General Psychiatry. 1978;35:269–276. doi: 10.1001/archpsyc.1978.01770270019001. [DOI] [PubMed] [Google Scholar]
- Burt SA, McGue M, Krueger RF, Iacono WG. Sources of covariation among the child-externalizing disorders: Informant effects and the shared environment. Psychological Medicine. 2005;35:1133–1144. doi: 10.1017/S0033291705004770. [DOI] [PMC free article] [PubMed] [Google Scholar]
- Cadoret RJ. Psychopathology in adopted-away offspring of biologic parents with antisocial behavior. Archives of General Psychiatry. 1978;35:176–184. doi: 10.1001/archpsyc.1978.01770260054005. [DOI] [PubMed] [Google Scholar]
- Cloninger CR, Gottesman II. Genetic and environmental factors in antisocial behavior disorders. In: Mednick SA, Moffitt TE, Stack SA, editors. The causes of crime: New biological approaches. Cambridge University Press; New York: 1987. pp. 92–109. [Google Scholar]
- Coccaro EF, Bergeman CS, Kavoussi RJ, Seroczynski AD. Heritability of aggression and irritability: A twin study of the Buss–Durkee aggression scales in adult male subjects. Biological Psychiatry. 1997;41:273–284. doi: 10.1016/s0006-3223(96)00257-0. [DOI] [PubMed] [Google Scholar]
- Eley TC, Lichtenstein P, Moffitt TE. A longitudinal behavior genetic analysis of the etiology of aggressive and nonaggressive antisocial behavior. Development and Psychopathology. 2003;15:383–402. doi: 10.1017/s095457940300021x. [DOI] [PubMed] [Google Scholar]
- Eley TC, Lichtenstein P, Stevenson J. Sex differences in the etiology of aggressive and nonaggressive antisocial behavior: Results from two twin studies. Child Development. 1999;70:155–168. doi: 10.1111/1467-8624.00012. [DOI] [PubMed] [Google Scholar]
- Hewitt JK, Silbert JL, Neale MC, Eaves LJ, Erickson M. The analysis of parental ratings of children's behavior using LISREL. Behavior Genetics. 1992;22:293–317. doi: 10.1007/BF01066663. [DOI] [PubMed] [Google Scholar]
- Hollingshead AB. Four factor index of social status. Yale University, Department of Sociology; New Haven, CT: 1975. [Google Scholar]
- Hudziak JJ, van Beijsterveldt CEM, Bartels M, Rietveld MJH, Rettew DC, Derks EM, Boomsma DI. Individual differences in aggression: Genetic analyses by age, gender, and informant in 3-, 7-, and 10-year-old Dutch twins. Behavior Genetics. 2003;33:575–589. doi: 10.1023/a:1025782918793. [DOI] [PubMed] [Google Scholar]
- Hutchings B, Mednick SA. Criminality in adoptees and their adoptive and biological parents: A pilot study. In: Mednick SA, Christiansen KO, editors. Biosocial bases of criminal behavior. Gardner Press; New York: 1971. pp. 127–141. [Google Scholar]
- Jacobson KC, Baker LA, Raine A. The structure of antisocial behavior: Results from a genetic factor analysis. 2007 Manuscript in preparation. [Google Scholar]
- Jacobson KC, Prescott CA, Kendler KS. Sex differences in genetic and environmental influences on antisocial behavior from childhood to adulthood. Development and Psychopathology. 2002;14:395–416. doi: 10.1017/s0954579402002110. [DOI] [PubMed] [Google Scholar]
- Jacobson KC, Zumberge A, Lozano DI, Raine A, Baker LA. Genetic mediation of the relationship between ASB, autonomic arousal and reactivity in children. Behavior Genetics. 2005;35:832–833. [Google Scholar]
- Jessor R, Jessor SL. Problem behavior and psychosocial development: A longitudinal study of youth. Academic Press; New York: 1977. [Google Scholar]
- Kendler KS, Heath AC, Martin NG, Eaves LJ. Symptoms of anxiety and symptoms of depression: Same genes, different environments? Archives of General Psychiatry. 1987;44:451–457. doi: 10.1001/archpsyc.1987.01800170073010. [DOI] [PubMed] [Google Scholar]
- Kendler KS, Prescott CA, Myers J, Neale MC. The structure of genetic and environmental risk factors for common psychiatric and substance use disorders in men and women. Archives of General Psychiatry. 2003;60:929–937. doi: 10.1001/archpsyc.60.9.929. [DOI] [PubMed] [Google Scholar]
- Kraemer HC, Measelle JR, Ablow JC, Essex MJ, Boyce WT, Kupfer DJ. A new approach to integrating data from multiple informants in psychiatric assessment and research. The American Journal of Psychiatry. 2003;160:1566–1577. doi: 10.1176/appi.ajp.160.9.1566. [DOI] [PubMed] [Google Scholar]
- Krueger RF. Personality from a realist's perspective: Personality traits, criminal behaviors, and the externalizing spectrum. Journal of Research in Personality. 2002;36:564–572. [Google Scholar]
- Krueger RF, Hicks BM, Patrick CJ, Carlson SR, Iacono WG, McGue M. Etiologic connections among substance dependence, antisocial behavior and personality: Modeling the externalizing spectrum. Journal of Abnormal Psychology. 2002;111:411–424. [PubMed] [Google Scholar]
- Loehlin JC, Willerman L, Horn JM. Personality resemblance in adoptive families when the children are late-adolescent or adult. Journal of Personality and Social Psychology. 1985;48:376–392. doi: 10.1037//0022-3514.48.2.376. [DOI] [PubMed] [Google Scholar]
- Lykken DT. The diagnosis of zygosity in twins. Behavior Genetics. 1978;8:437–473. doi: 10.1007/BF01067939. [DOI] [PubMed] [Google Scholar]
- Lykken DT, McGue M, Tellegen A. Recruitment bias in twin research: The rule of two-thirds reconsidered. Behavior Genetics. 1987;17:343–362. doi: 10.1007/BF01068136. [DOI] [PubMed] [Google Scholar]
- Lynam DR. Pursuing the psychopath: Capturing the fledgling psychopath in a nomological net. Journal of Abnormal Psychology. 1997;106:424–438. doi: 10.1037//0021-843x.106.3.425. [DOI] [PubMed] [Google Scholar]
- Markon KE, Krueger RF. An empirical comparison of information-theoretic selection criteria for multivariate behavior genetic models. Behavior Genetics. 2004;34:593–610. doi: 10.1007/s10519-004-5587-0. [DOI] [PubMed] [Google Scholar]
- Markon KE, Krueger RF. Categorical and continuous models of liability to externalizing disorders: A direct comparison in NESARC. Archives of General Psychiatry. 2005;62:1352–1359. doi: 10.1001/archpsyc.62.12.1352. [DOI] [PMC free article] [PubMed] [Google Scholar]
- Martin N, Scourfield J, McGuffin P. Observer effects and heritability of childhood attention-deficit hyperactivity disorder symptoms. British Journal of Psychiatry. 2002;180:260–265. doi: 10.1192/bjp.180.3.260. [DOI] [PubMed] [Google Scholar]
- McArdle JJ, Goldsmith HH. Alternative common factor models for multivariate biometric analyses. Behavior Genetics. 1990;20:569–608. doi: 10.1007/BF01065873. [DOI] [PubMed] [Google Scholar]
- Mednick SA, Gabrielli WF, Hutchings B. Genetic influences in criminal convictions: Evidence from an adoption cohort. Science. 1984 May 25;224:891–894. doi: 10.1126/science.6719119. [DOI] [PubMed] [Google Scholar]
- Medsker GJ, Williams LJ, Holahan PJ. A review of current practices for evaluating causal models in organizational behavior and human resources management research. Journal of Management. 1994;20:439–464. [Google Scholar]
- Neale MC, Boker SM, Xie G, Maes HH. Mx: Statistical modeling. 6th ed. Virginia Commonwealth University, Department of Psychiatry; Richmond: 2003. [Google Scholar]
- Neale MC, Cardon LR. Methodology for genetic studies of twins and families. Kluwer Academic; Dordrecht, the Netherlands: 1992. [Google Scholar]
- Neale MC, Stevenson J. Rater bias in the EASI temperament scales: A twin study. Journal of Personality and Social Psychology. 1989;56:446–455. doi: 10.1037//0022-3514.56.3.446. [DOI] [PubMed] [Google Scholar]
- Raine A. The psychopathology of crime: Criminal behavior as a clinical disorder. Academic Press; San Diego, CA: 1993. [Google Scholar]
- Raine A. Biosocial studies of antisocial and violent behavior in children and adults: A review. Journal of Abnormal Child Psychology. 2002;30:311–326. doi: 10.1023/a:1015754122318. [DOI] [PubMed] [Google Scholar]
- Raine A, Baker LA, Liu J. Biological risk factors for antisocial and criminal behavior. In: Raine A, editor. Crime and schizophrenia: Causes and cures. NOVA Science Publishers; New York: 2006. pp. 83–108. [Google Scholar]
- Raine A, Baker LA, Liu J. Factor structure and heritability of the Reactive–Proactive Aggression Questionnaire (RPQ) in 9-year-old twins. 2007 Manuscript in preparation. [Google Scholar]
- Raine A, Brennan PA, Farrington DP, Mednick SA, editors. Biosocial bases of violence. Plenum Press; New York: 1997. [Google Scholar]
- Raine A, Dodge K, Loeber R, Gatzke-Kopp L, Lynam D, Reynolds C, et al. The Reactive–Proactive Aggression Questionnaire: Differential correlates of reactive and proactive aggression in adolescent boys. Aggressive Behavior. 2006;32:159–171. doi: 10.1002/ab.20115. [DOI] [PMC free article] [PubMed] [Google Scholar]
- Rhee SH, Waldman ID. A meta-analytic review of twin and adoption studies examining antisocial behavior. Psychological Bulletin. 2002;128:490–529. [PubMed] [Google Scholar]
- Rowe DC, Almeida DM, Jacobson KC. School context and genetic influences on aggression in adolescence. Psychological Science. 1999;10:277–280. [Google Scholar]
- Sanchez N, Baker LA, Raine A. Social risk factors in childhood externalizing behavior problems: Understanding differences within and between ethnic groups in a community sample of twins. 2005 Manuscript in preparation. [Google Scholar]
- Saudino KJ, Cherny SS. Parental ratings of temperament in twins. In: Emde RN, Hewitt JK, editors. Infancy to early childhood: Genetic and environmental influences on developmental change. Oxford University Press; London: 2001. pp. 73–88. [Google Scholar]
- Schaffer D, Fisher P, Lucas CP, Dulcan MK, Schwab-Stone ME. NIMH Diagnostic Interview Schedule for Children Version IV (NIMH DISC–IV): Description, differences from previous versions, and reliability of some common diagnoses. Journal of the American Academy of Child & Adolescent Psychiatry. 2000;39:28–38. doi: 10.1097/00004583-200001000-00014. [DOI] [PubMed] [Google Scholar]
- Sigvardsson S, Cloninger CR, Bohman M, Von Knorring AL. Predisposition to petty criminality in Swedish adoptees: III. Sex differences and validation of the male typology. Archives of General Psychiatry. 1982;39:1248–1253. doi: 10.1001/archpsyc.1982.04290110016003. [DOI] [PubMed] [Google Scholar]
- Silberg JL, Erickson MT, Meyer JM, Eaves LJ, Rutter ML, Hewitt JK. The application of structural equation modeling to maternal ratings of twins' behavioral and emotional problems. Journal of Consulting and Clinical Psychology. 1994;62:510–521. [PubMed] [Google Scholar]
- Simonoff E, Pickles A, Hewitt J, Silberg J, Rutter M, Loeber R, et al. Multiple raters of disruptive child behavior: Using a genetic strategy to examine shared views and bias. Behavior Genetics. 1995;25:311–326. doi: 10.1007/BF02197280. [DOI] [PubMed] [Google Scholar]
- Stoff DM, Breiling J, Maser JD, editors. Handbook of antisocial behavior. Wiley; New York: 1997. [Google Scholar]
- Tackett JL, Krueger RF, Iacono WG, McGue M. Symptom-based subfactors of DSM-defined conduct disorder: Evidence for etiologic distinctions. Journal of Abnormal Psychology. 2005;114:483–487. doi: 10.1037/0021-843X.114.3.483. [DOI] [PMC free article] [PubMed] [Google Scholar]
- Vierikko E, Pulkkinen L, Kaprio J, Rose RJ. Genetic and environmental influences on the relationship between aggression and hyperactivity–impulsivity as rated by teachers and parents. Twin Research. 2004;7:261–274. doi: 10.1375/136905204774200541. [DOI] [PubMed] [Google Scholar]
- Ward MC. Childhood psychopathy and autonomic functioning: Genetic and environmental influences. University of Southern California; Los Angeles: 2004. Unpublished doctoral dissertation. [Google Scholar]
- Woodcock RW, Johnson MB. Woodcock–Johnson Psycho-Educational Battery—Revised. Riverside; Chicago, IL: 1989. [Google Scholar]
- Young SE, Stallings MC, Corley RP, Krauter KS, Hewitt JK. Genetic and environmental influences on behavioral disinhibition. American Journal of Medical Genetics. 2000;96:684–695. [PubMed] [Google Scholar]
- Youngstrom E, Loeber R, Stouthamer-Loeber M. Patterns and correlates of agreement between parent, teacher, and male adolescent ratings of externalizing and internalizing problems. Journal of Consulting and Clinical Psychology. 2000;68:1038–1050. doi: 10.1037//0022-006x.68.6.1038. [DOI] [PubMed] [Google Scholar]