

Abstract
In a previous report we showed that neurons in the Anterior Cingulate Cortex (ACC) might encode the serial order of the three components (1st, 2nd, and 3rd) of motor sequences, irrespective of which component is performed, and irrespective of the component that precedes or follows. Here we further explore these data by comparing the magnitude of cell activity at the different ranks. We also compare the activity recorded in the motor sequences and in tasks with only one motor component. We finally discuss functional hypotheses, which may account for the serial order encoding.
Keywords: Animals; Macaca mulatta; Male; Memory, Short-Term; physiology; Neurons; physiology; Parietal Lobe; cytology; physiology; Psychomotor Performance; physiology; Reaction Time; physiology; Serial Learning; physiology
Introduction
Serial-order effects have been described on neural activities timely related to sequentially presented sensory stimuli in M1, arcuate cortex, and caudate nucleus (Carpenter et al. 1999, Barone & Joseph 1989, Kermadi & Joseph 1995), and on activities timely related to motor components within a sequence in arcuate cortex, SMA, and pre-SMA (Barone & Joseph 1989, Tanji & Shima 1994, Clower & Alexander 1998). The later reflected the relational order of a specific motor component with respect to others, or its serial order irrespective of which movements precede or follow. Procyk et al. 2000 provided the first evidence that the serial order of sequence components, irrespective of which movement is performed and of which movements precede or follow, was an important determinant of ACC activity. However, in this report no attempt had been made to characterise the serial order patterns, and to elucidate the origin of serial order encoding and its putative contribution to the cognitive representation of sequential behaviours.
In the present report, we further explore the physiological basis of serial order encoding by ACC and its role in the organization of sequential behavioural structures. Using the pool of data partially described in our previous report (Procyk et al. 2000), we compare the amplitude of the activity at different epochs of the sequence to look for possible systematic temporal patterns of neuronal response. Moreover, in a number of neurons, we also compare activity during performance of the sequence task and during performance of a simple working memory task with only one component.
Methods
Two male rhesus monkeys (M and P) were trained to sit in a primate chair in front of a tangent touch-screen monitor (Microtouch System, Methuen, USA). Eye-movements were recorded in monkey M using the scleral search coil technique. A moving eye-position window centred on the fixation point (FP) or on the different targets was used to control the position of gaze. A recording cylinder was implanted over the ACC. Surgical, electrophysiological, and histological procedures were described previously (Kermadi & Joseph 1995), and were carried out according to the European Communities Council Directive (1986) (Ministére de I’Agriculture et de la Forêt). CORTEX, PCOFF and MATOFF softwares (NIMH Neuropsychology and Systems Neuroscience, Bethesda, Maryland) were used for data acquisition and offline display.
Behavioural protocols
Both monkeys were trained in a sequential problem-solving task (PST). The problem consisted in finding, by trial and error, the correct sequence for touching the 3 spatial targets (Fig. 1B). Complete task schedule and behavioural data have been published previously (Procyk & Joseph 1996, Procyk et al. 2000). Briefly, at the beginning of a trial, the animal touched the lever with one hand at which time the central FP appeared and remained illuminated for 2s. Eight hundred (800) milliseconds following the onset of fixation, all targets were simultaneously illuminated at the standard level (grey). When the FP was extinguished, oculomotor activity was freed and the animal was required to select the 1st target within 600ms. After a first period of target fixation (900–1200 ms), all targets turned white (“GO” signal), and the animal had to release the lever and touch the same target during the subsequent 1000ms. If the touch was correct (i.e. the selected target was the first of the correct sequence), all three targets were re-illuminated at the standard level, while the monkey maintained its hand position and performed a saccade to the 2nd target. Acquisition of the second and third targets followed the same rule. A drop of juice was given at the end of a correct trial. The same sequence was repeated until the animal had performed a total of 4 correct trials. Once this repetition period was terminated, a visuo-auditory signal indicated a change of sequence. There were 6 different sequences to find (LRU, LUR, ULR, URL, RLU, and RUL). In the case of an incorrect touch, a break of fixation, or an early touch, all targets were extinguished and the trial was aborted. In this case, the animal had to resume the trial from the beginning. For example if the monkey chose the first correct target but an incorrect one in second, the trial was aborted at the second touch, and the animal had to start a new trial to continue his search.
Figure 1. Target display, trial events in the Problem Solving task (PST) and in the Delayed Response task (DRT), and anatomical location of task-related neurons.
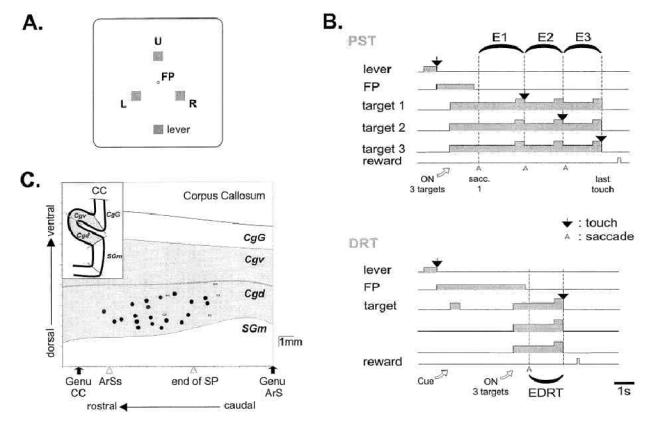
(A) Location of stimuli on the display monitor. The animal worked with 3 targets: the upper (U), left (L), and right (R) targets. A 4×4mm central white square served as fixation point (FP). A square located 10 cm below the centre served as the starting lever. (B) Schema of trial events in PST and DRT. Each correct touch (black arrow) was signalled by a short tone delivered from a buzzer. Grey area: time of illumination of the Lever, FP, and the three targets. Higher amplitude in the grey area: full illumination (GO-signal). EDRT, E1, E2, and E3 are the epochs used for analyses. (C) 2D reconstruction of the medial cortex. Recording sites in the cingulate sulcus are represented by symbols. Black circles show sites at which task-related cells were recorded. Empty squares indicate sites where no-task related cells were found. CC: corpus callosum, ArSs: rostral extent of the superior branch of the arcuate sulcus (ArS), end of SP: caudal extent of sulcus principalis, SGm: medial superior gyrus, Cgd and Cgv: dorsal and ventral banks of cingulate sulcus, CgG: cingulate gyrus.
Monkey M was also trained in a delayed response task (DRT) (Fig. 1B). In this task, one second after the beginning of FP fixation, one of the three targets was illuminated at standard level for 500 ms (cue).
After a delay (2.5 to 4.5s) the 3 targets were illuminated together. The FP was extinguished 700 ms later, and the animal had to orient its gaze towards the target-cue and fixate it. When all targets turned white (“GO”-signal), the animal released the lever and touched the target. A drop of juice was given at the end of a correct trial.
Data analysis
Hand reaction times (RTs) and movement times (MTs) were computed.
Neural responses to onset of the 3 targets were classified as ‘phasic’ if they lasted less than 700ms, and ‘tonic’ if they lasted for more than 700ms.
The analysis on serial order was performed only with the correct trials from DRT and from the repetition periods of the PST. Neuronal activity was measured in 1 epoch in DRT: [FP offset ? target touch] = EDRT, and 3 epochs in PST: [FP offset ? first target touch] = E1, [first target touch ? second target touch] = E2, and [second touch ? third touch] = E3 (Fig. 1B). Thus the activity in each epoch relates to the acquisition of the same target successively by the gaze and by the arm. Trial-by-trial discharge rates were computed in each epoch and constituted the basis for the statistical comparisons (Mann-Whitney U-test, at p<0.01). The effect of target position on neural activity was examined for E1, E2, E3, and EDRT separately (ANOVA, p<0.01). The global rank effect during PST trials was tested by an ANOVA (p<0.05). The ordering of average activities (table 2) was made after a LSD Planned comparison (p<0.01). The comparison between PST and DRT focuses on E1, E3, and EDRT which share common characteristics: E1 and EDRT started with a saccade from the FP and ended with an arm movement from the lever, and E3 and EDRT ended with the final arm movement followed by the reward delivery.
Table 2.
Classification of cells according to their activity in the 3 epochs of the PST. E1, E2, and E3 represent average activities measured in the corresponding epoch of the sequences. The group “Other” correspond to neurons in which the statistical analysis showed, for instance, that E1=E2, E2=E3 and E1≠E3, and which could not be classified in the other groups. Cells with no serial order effect are not included.
?2 goodness-of-fit test was used to compare the relative frequencies of categorized serial order pattern.
All statistical analyses were performed with Statistica® (StatSoft, Tulsa, Oklahoma, USA).
Results
Animals’ performance in PST has already been published (Procyk & Joseph 1996, Procyk et al. 2000). In the DRT, the performance was over 85% correct trials.
In the PST, RTs and MTs of the first movements were longer than those of the third (RTs: t-test, t=43, df=3494, p<10−08; MTs: t=19.8, p<10−08 ) (Table 1). RTs and MTs of the DRT were different from those of the first (RTs: t=4.8, df=2760, p<10−05; MTs: t=16.8, df=2760, p< 10−08) and the third (RTs: t=28.9, df=2760, p< 10−08; MTs: t=34.12, df=2760, 10−08) movements of the PST. However, the range of values of RTs and MTs in DRT was closer to that of the first than that of the third movements. In both tasks, the saccadic RTs from the FP were similar. In summary, the movements in EDRT and E1 are comparable and are slower than in E3.
Table 1.
RTs and MTs in the two tasks.
| EDRT | E1 | E3 | |
|---|---|---|---|
| RTs | 418 ± 152 ms | 438 ± 118 ms | 223 ± 153 ms |
| MTs | 394 ± 108 ms | 326 ± 94 ms | 269 ± 83 ms |
| RT saccade 1 | 311 ± 103 ms | 312 ± 122 ms |
Neural activity was recorded from the anterior part of the dorsal bank of the cingulate sulcus (area 24c) in or, more likely, anterior to the rostral cingulate motor area (CMAr) (Picard & Strick 1996, Matelli et al. 1991, Wang et al. 2001) (Fig. 1c).
We analysed 125 of 191 (66%) task-related neurons (109 and 16 in monkey M and P respectively), which activity changed during the execution of sequences in the PST (Procyk et al. 2000). We recorded 44 of these during both PST and DRT, and 4 other neurons were recorded during DRT only. The other 66 neurons had significant responses to error detections, reward, or to signal of sequence change.
In the PST, the location of the target had a small but statistically significant effect on the activity of 40 (40/125 = 32%) cells, in at least one epoch (ANOVA, p<0.01). The ordinal position (first, second, or third) of a target being acquired within the sequence in the PST was the major source of variability of activity between epochs (Fig. 2 and 3) (Procyk et al. 2000). When several epochs showed a change in activity, the temporal pattern of response, relative to behavioural events (e.g. activation before arm movement…), stayed comparable across these epochs in spite of the change in magnitude. This justified the comparison of average activity in the three epochs. A serial order effect (ANOVA, p<0.05) was found in 93 cells (93/125=74%), the activity of which is presented in table 2 for the three epochs. Almost every possible pattern was observed, but the proportions found were not randomly distributed. For instance, the 6 cases in the first three categories presented in table 2 showed unequal proportions (?2, p<0.004), E1>E2=E3 and E3>E1=E2 being the most represented. Although an interaction between spatial parameters and ordinal position was found in 18% of cells, the activities never revealed a clear preference for specific sequences.
Figure 2. Activities during correct trials in PST and DRT.
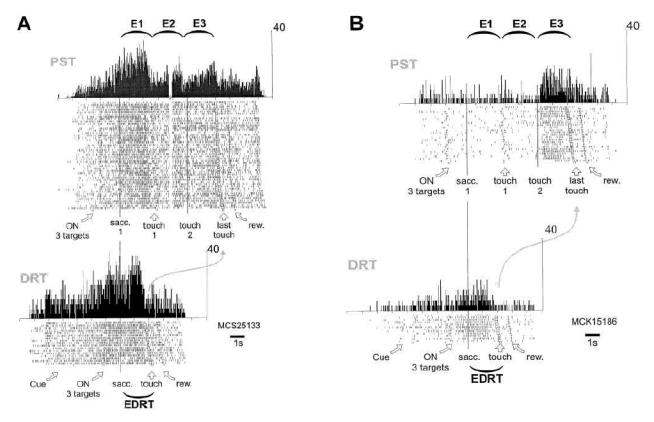
Two examples (A and B). Each raster line, where a tick represents the occurrence of a single spike, displays cell activity recorded during one trial. Trials of the PST, which correspond to the 6 possible sequences, and trials of the DRT, which correspond to the 3 possible orientations, are displayed according to increasing delay of the last target touch. The 3rd touch in PST and the touch in DRT are indicated by an empty square. A large curved arrow is drawn between these events of the two tasks. Epochs are indicated. Rasters and histograms are aligned at the level of vertical lines. Time and activity scales are indicated. (A): In PST, an increase in activity is observed during the first epoch (E1). In DRT, an increase is also observed from the onset of the 3 targets to the target touch (Epoch effect (E1 vs. E3): Z=6.77, p<10−7, (E1 vs. EDRT): Z=2.74, p<0.006, (E3 vs. EDRT): Z=6.42, p<10−7; spatial effect: E1: F(2,45)=1.84, ns, E3: F(2,45)=2.20, ns, EDRT: F(2,10)=0.05, ns). (B): In PST, a response is observed primarily during E3. In DRT the same cell is activated from the onset of the 3 targets and during EDRT (Epoch effect (E1 vs. E3): Z=5.12, p<10−7, (E1 vs. EDRT): Z=4.09, p<10−4, (E3 vs. EDRT): Z=1.17, ns; spatial effect: E1: F(2,26)=0.62, ns, E3: F(2,26)=0.65, ns, EDRT: F(2,9)=0.34, ns).
Figure 3. Activities during correct trials in PST and DRT.
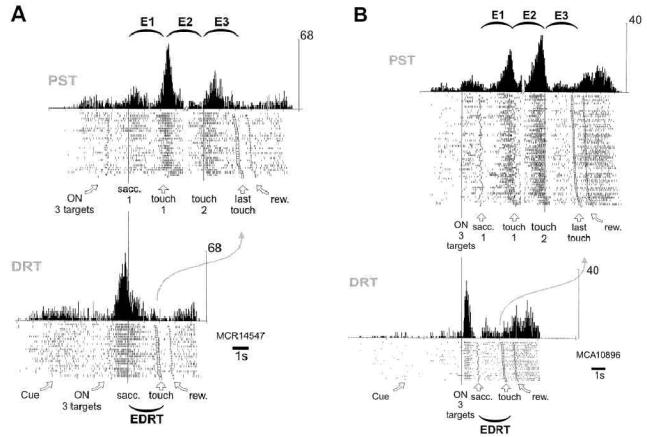
Two examples (A and B). Same conventions as in Figure 2. (A): In PST, the cell is primarily activated after the 1st and 2nd touches. During DRT, the same cell is primarily activated at the onset of the 3 targets. The activation continues after the first saccade (Epoch effect (E1 vs. E3): Z=0.51, ns, (E1 vs. EDRT): Z=4.77, p<10−5, (E3 vs. EDRT): Z=4.01, p<10−4; spatial effect: E1: F(2,19)=2.29, ns, E3: F(2,19)=6, p<0.01, EDRT: F(2,19)=0.29, ns). (B): In PST, the cell is activated before the 1st and 2nd touches, and after the last touch. During DRT, the same cell is primarily activated at the onset of the 3 targets, and then shows a pattern of discharge similar to that observed at the end of PST trials (Epoch effect (E1 vs. E3): Z=4.56, p<10−5, (E1 vs. EDRT): Z=4.23, p<10−4, (E3 vs. EDRT): Z=0.11, ns; spatial effect: E1: F(2,61)=4.24, ns, E3: F(2,61)=2.73, ns, EDRT: F(2, 18)=3.11, ns).
Six cells (6/48= 12.5%) showed responses to cue onset in the DRT. In two of these the activity lasted during the delay period, up to the onset of the three targets. For these neurons, cue- and delay-activities did not depend on the cue location (ANOVA, p<0.01). Figures 2 and 3 illustrate the activity of 4 cells recorded in PST and DRT.
In 23 cells (23/44), responses to onset of the 3 targets (16 tonic and 7 phasic) were observed in the DRT only (Fig. 3A). Responses were observed in the two tasks in 6 other cells. In 3 of these, the activity was increased in one task and suppressed in the other.
In EDRT, the spatial parameters had an effect on the activity of 4 (4/48 = 8%) cells. Neurons recorded in both tasks were classified according to the magnitude of their activity in epochs EDRT, E1, and E3 (table 3).
Table 3.
Classification of cells according to their activity in the DRT and PST (Mann-Whitney test, p< 0.01). The group “others” corresponds to neurons that could not be classified in the other groups (see table 2).
Neurons responding in pure anticipation of- or, in response to reward delivery, were infrequently recorded. Only 18 cells could be characterized as reward-related, but most of them were also related to other events. Fourteen (14) neurons showed particular responses after error events (incorrect touch, break of fixation). None of them were specific to one particular event. Ten (10) of these were also activated by signals for change of sequence. Interestingly, breaks of fixation occurring early in a trial usually elicited less activity than late breaks of fixation.
Discussion
One interpretation of the serial order encoding observed in the ACC during the PST relates to differences in the movements made at different components (ranks) of the sequences. We have shown that MTs, RTs, direction of movement, or target position at different ranks were not determinant factors (Procyk et al. 2000). However, the arm movements performed in E1, starting from the lever, were slightly different from those performed in E2 and E3, which were made from one target to another. Serial order of the type E1≠(E2=E3), which may reflect this situation, was observed in only 17% of neurons (Fig. 2A).
The other interpretations posit that serial order must be analysed in relation to the goal of the sequence, i.e. in relation to the reward.
The central role of reward in ACC’s function is now well documented by studies showing the participation of ACC in voluntary movement selection based on reward (Shima & Tanji 1998), the possible role of reward expectation in the differential activation of ACC neurons in the two periods (search and repetition) of the problem-solving task (Procyk et al. 2000), and the graded dependency of ACC activities on the reward value of targets (Amiez & Joseph 2000). Our results would therefore illustrate how motivational factors linked to future reward delivery may participate, through ACC, in the organization of sequential behaviours.
In this general framework, the serial order encoding of motor or sensory events may reflect:
A dichotomy between non-rewarded (E1 and E2) and rewarded (E3) epochs, revealed by the pattern (E1=E2)≠E3 observed in 19% of neurons (Table 2, Fig. 2B).
The “distance” of each epoch to the goal (the expected reward). Patterns of activity such as E1>E2>E3 or E1<E2<E3 (with a monotonous progression possibly reflecting the decreasing distance) were observed in 12 cells (12/91=13%) (Table 2). This would also explain the modulation of error-related activities according to when the error is made in a trial, the actual motivational state affecting error encoding by ACC.
A more abstract encoding of the rank with respect to the goal. Knowledge of the rank of the current action is essential to carry on sequential plans, prevent achievement of sub-goals to terminate it, and secure termination of the sequence once the goal is reached. This interpretation may apply to all neurons considered in this study, in particular to all neurons (56/91=58%) with an activity profile not accounted for by the other hypotheses discussed above. Figure 3 shows two neurons characterized by a profile of activity of the type E2≠(E1=E3) (Fig. 3A) and (E2>E1>E3) (Fig. 3B), and for which the hypothesis of an encoding of the ranks of the sequence components may apply. Since numerous activity patterns were observed among cells, one must consider that, globally, each movement or event at a particular rank was differently encoded by the population of neurons. These activity patterns would represent an unambiguous and distributed encoding of the rank of sequence components.
During sequential delay tasks, sustained activities in prefrontal areas 46 and 8A are modulated both by spatial characteristics and serial order of cue presentations (Barone & Joseph 1989, Funahashi et al. 1997). Such activities have been related to the process of maintenance of information for sequential planning. Serial order effects were also observed in caudate nucleus for cue- and saccade-related activities (Kermadi & Joseph 1995), and in SMA and pre-SMA, with higher incidence in pre-SMA (Clower & Alexander 1998). Shidara & Richmond (2000) found ACC activities with complex relationships to parts of a schedule in a predictable series of trials. In their review Hikosaka et al. 1999 proposed that different frontal-subcortical loops, which use diverse coordinate systems (spatial and motor), participate differently in maintaining, learning, and/or executing sequential motor plans. In this framework our data may show that, as proposed by Shidara et al. 1998, ACC is part of a circuit (including ventral striatum) that keeps track of progress through behavioural sequences, and uses a goal-centred encoding system. This loop would also be differently recruited depending on the stage of learning (Procyk et al. 2000). The integration, through connections between ACC and prefrontal cortex or ACC and pre-SMA (Lu et al. 1994, Wang et al. 2001), of different aspects of serial encoding as seen in different structures, may provide for global representations of sequential plans.
In contrast to a previous study (Niki & Watanabe 1976), our data do not support a particular role for the ACC in maintaining spatial information during working memory tasks (DRT). Although such discrepancies are unclear, we have to consider that 1) the previous study did not control eye movements and may have encouraged the use of a different strategy to perform the task, and 2) the learning and execution of the PST may have resulted in a different neuronal organization of the delay task.
The comparison between DRT and PST, which differed by the number of components (1 vs. 3), should shed light on the significance of serial order encoding. A great majority of neurons displayed activity patterns such as (EDRT=E1)≠E3 (16%), (EDRT=E3)≠E1 (36%), or EDRT=E1=E3 (16%) (Table 3) and their activity in EDRT may be interpreted, in reference to that observed in the PST, as arm-movement related (Fig. 2A) or as reward-related (Fig. 2B). Thus, in a majority of neurons (30/44=68%), the PST and DRT data are coherent. By contrast, two other sets of data are not coherent: first the responses to onset of the 3 targets are different in the two tasks (Fig. 3B) and second, in a small population of neurons EDRT≠E1 and ≠E3 (5/44=11%; Table 3). Elucidating the significance of these differences may provide important insights into the integration of spatial working memory and the sequential control of movements.
Acknowledgments
We particularly thank Y.L. Tanaka. We also thank GV Williams and C. Constantidinis for their helpful comments on the manuscript. This work was supported by GIS sciences de la cognition, France. Correspondence should be addressed to E. Procyk.
References
- Amiez C, Joseph JP. Decision making in the monkey: behavioral and neural data. 30th Annual Society for Neuroscience Meeting; New Orleans. 2000. p. 749.7. [Google Scholar]
- Barone P, Joseph JP. Prefrontal cortex and spatial sequencing in macaque monkey. Exp Brain Res. 1989;78:447–464. doi: 10.1007/BF00230234. [DOI] [PubMed] [Google Scholar]
- Carpenter AF, Georgopoulos AP, Pellizzer G. Motor cortical encoding of serial order in a context-recall task. Science. 1999;283:1752–1757. doi: 10.1126/science.283.5408.1752. [DOI] [PubMed] [Google Scholar]
- Clower WT, Alexander GE. Movement sequence-related activity reflecting numerical order of components in supplementary and presupplementary motor areas. J Neurophysiol. 1998;80:1562–1566. doi: 10.1152/jn.1998.80.3.1562. [DOI] [PubMed] [Google Scholar]
- Funahashi S, Inoue M, Kubota K. Delay-period activity in the primate prefrontal cortex encoding multiple spatial positions and their order of presentation. Behav Brain Res. 1997;84:203–223. doi: 10.1016/s0166-4328(96)00151-9. [DOI] [PubMed] [Google Scholar]
- Hikosaka O, Nakahara H, Rand MK, Sakai K, Lu X, Nakamura K, Miyachi S, Doya K. Parallel neural networks for learning sequential procedures. Trends Neurosci. 1999;22(10):464–71. doi: 10.1016/s0166-2236(99)01439-3. [DOI] [PubMed] [Google Scholar]
- Kermadi I, Joseph JP. Activity in the caudate nucleus of monkey during spatial sequencing. J Neurophysiol. 1995;74:911–933. doi: 10.1152/jn.1995.74.3.911. [DOI] [PubMed] [Google Scholar]
- Lu MT, Preston JB, Strick PL. Interconnections between the prefrontal cortex and the premotor areas in the frontal lobe. J Comp Neurol. 1994;341:375–392. doi: 10.1002/cne.903410308. [DOI] [PubMed] [Google Scholar]
- Mattelli M, Luppino G, Rizzolatti G. Architecture of superior and mesial area 6 and the adjacent cingulate cortex in the macaque monkey. J Comp Neurol. 1991;311:445–462. doi: 10.1002/cne.903110402. [DOI] [PubMed] [Google Scholar]
- Niki H, Watanabe M. Cingulate unit activity and delayed response. Brain Res. 1976;110:381–386. doi: 10.1016/0006-8993(76)90412-1. [DOI] [PubMed] [Google Scholar]
- Procyk E, Joseph JP. Problem solving and logical reasoning in the macaque monkey. Behav Brain Res. 1996;82:67–78. doi: 10.1016/s0166-4328(97)81109-6. [DOI] [PubMed] [Google Scholar]
- Procyk E, Tanaka YL, Joseph JP. Anterior cingulate activity during routine and non-routine sequential behaviors in macaques. Nat Neurosc. 2000;3(5):502–508. doi: 10.1038/74880. [DOI] [PubMed] [Google Scholar]
- Shidara M, Aigner TG, Richmond BJ. Neuronal signals in the monkey ventral striatum related to progress through a predictable series of trials. J Neurosci. 1998;18:2613–2625. doi: 10.1523/JNEUROSCI.18-07-02613.1998. [DOI] [PMC free article] [PubMed] [Google Scholar]
- Shidara M, Richmond BJ. Phasic and tonic neuronal responses related to behavioral persistence during multitrial reward schedules in monkey anterior cingulate. 30th Annual Society for Neuroscience Meeting; New Orleans. 2000. p. 176.6. [Google Scholar]
- Shima K, Tanji J. Role for cingulate motor area cells in voluntary movement selection based on reward. Science. 1998;282:1335–1338. doi: 10.1126/science.282.5392.1335. [DOI] [PubMed] [Google Scholar]
- Tanji J, Shima K. Role for supplementary motor area cells in planning several movements ahead. Nature. 1994;371:413–416. doi: 10.1038/371413a0. [DOI] [PubMed] [Google Scholar]
- Wang Y, Shima K, Sawamura H, Tanji J. Spatial distribution of cingulate cells projecting to the primary, supplementary, and pre-supplementary motor areas: a retrograde multiple labelling study in the macaque monkey. Neurosc Res. 2001;39:39–49. doi: 10.1016/s0168-0102(00)00198-x. [DOI] [PubMed] [Google Scholar]