

Abstract
In this study the changes in properties of the maturing mantle and circumpulpal dentin were quantitatively analyzed. Sections from six fetal bovine undecalcified incisors were used. Regions of mantle and circumpulpal dentin of sequential maturation stages were identified on spectroscopic images acquired by Fourier Transform Infrared Imaging. Spectroscopic parameters corresponding to mineral properties at these stages were analyzed and reported as a function of distance from the cervix of the incisor, the latter representing tissue age. Mineral parameters were correlated with distance from the cervix. Values of these parameters in mantle and circumpulpal dentin were compared. A multi-phasic pattern of changes was found for all the parameters examined, with most of the alterations occurring in the initial maturation period. The patterns of temporal variation in mantle and circumpulpal dentin mineral properties show distinct developmental stages and were not identical for the two dentin compartments. The study showed that mineral maturation in dentin is not a linear process and that mantle dentin is developmentally distinct from circumpulpal dentin, presenting at certain stages different physicochemical events during the maturation of the tissue.
Keywords: mineral, maturation, dentin, Fourier Transform Infrared spectroscopy, imaging
Introduction
Changes in the mineral properties of developing hard tissues have been the subject of several studies reviewed elsewhere [1]. In dentin such studies are limited [2-5], due to the lack of an appropriate model. The extensive anatomical variability [6-7] and a location-dependent variability in mineral properties, shown by spectroscopic, x-ray and biomechanical methods [7-11] also make interpretation of dentin mineral maturation data difficult. The combination of a high resolution spectroscopic imaging method and a fetal developing calf incisor model has been previously shown to be suitable [5]. Using this methodology, it is possible to identify and analyze dentin areas which are histologically comparable and have a continuous range of successive tissue ages.
Traditionally, two types of dentin were identified based on differences in histology and in properties of the mineral or the matrix; mantle dentin (adjacent to the dentinoenamel junction) and circumpulpal dentin (the remainder of the dentin structure). Different mechanisms of initiation of mineralization [12-13] and organization of the collagenous matrix [14] have been described, mandating separate analyses in these two kinds of dentin. Despite the fact that a region of distinct properties adjacent to DEJ is commonly recognized, the dimensions of this region is controversial and varies depending on the analyzed properties (histological, biochemical, mechanical). For the purposes of the present study, we examined a dentin zone next to DEJ that in a previous study in fetal developing incisors [5] was characterized by a different mineral maturation pattern than the rest of dentin and presented a consistent width throughout maturation, as well as the part of the dentin bulk immediately adjacent to that zone. These zones will be referred to as mantle and circumpulpal dentin, respectively.
Changes in the mineral properties during maturation of mantle and circumpulpal bovine dentin were quantitatively evaluated by spectroscopic imaging and are reported as a function of tissue age. The previous qualitative analyses of changes in mineral properties of developing dentin [4-5] are thus complemented with quantitative results.
Materials and Methods
Specimen preparation
Third lateral incisors from six fetal -third trimester of gestation-calf jaws, obtained from a commercial source (Aries Scientific, Dallas, TX,) were used for Fourier Transform Infrared Imaging (FTIRI) analysis. The jaws were stored at -70°C prior to use, at which time teeth were extracted. The specimens were partially fixed in absolute methanol, dehydrated and embedded in polymethylmethacrylate (PMMA). Teeth were bisected longitudinally with a diamond wafering wheel saw and nondecalcified 2μm-thick sections of the incisor crowns were produced from one half using a Jung Polycut E microtome (Reichert-Jung, Heildeberg, Germany). The sections were mounted between two barium fluoride windows for FTIRI.
Spectroscopic Imaging overview
The final spectroscopic data analyzed was only a part of the whole imaging data set acquired from each incisor, corresponding to the selected for analysis dentin regions within the incisor. The rest of the data set enabled the identification of mantle and circumpulpal dentin regions of successive tissue ages.
The spectroscopic imaging analysis overall consisted of (A) collection of FTIR data, (B) general processing of FTIR data and creation of spectroscopic images, (C) selection of mantle and circumpulpal dentin regions of successive tissue ages and extraction of spectral data from selected regions, (D) spectroscopic analysis of data from selected regions. Analyses of the carbonate substitution in the dentin mineral were conducted using separate sections from the same specimen blocks and are described in (section E). Statistical analysis performed on the results is described in (F).
A. Collection of FTIR data
A Spectrum Spotlight FTIR Imaging system (Perkin-Elmer Instruments, Shelton, CT) was used. The data collection, as well as the general data processing methodology, is described in detail elsewhere [15-16]. Briefly, the FTIRI instrument consists of a continuous scan interferometer interfaced to a MCT (Mercury-Cadmium-Telluride) focal plane 2×8 array detector, from which each element acquires a spectrum from a ∼ 6.25μm × 6.25μm area within the tissue. Cervical, middle-crown and incisal areas of the labial aspect of the crowns were analyzed with a 4cm-1 spectral resolution. The cervical 4,000μm were analyzed in a continuous mode and the rest of the crowns (middle and incisal parts) in non-continuous segments. Spectral data were processed by a combination of instrument software and ISYS Chemical Imaging software (v 3.1, Spectral Dimensions Inc., Olney, MD, USA).
B. General processing of FTIR data and creation of spectroscopic images
The spectroscopic parameters analyzed for the study of respective mineral properties, method used to calculate these parameters and references for the method used are summarized on Table I. Mineral:matrix images were first generated for the analyzed incisor segments, as the basis for localization of dentin areas to be retrieved. These images were spatially masked for presence of tissue matrix.
TABLE I.
SPECTROSCOPIC PARAMETERS/MINERAL PROPERTIES EXAMINED.
| Spectroscopic parameter examined/ mineral property represented | Method of calculation | Reference |
|---|---|---|
| mineral:matrix/ relative mineral content | integrated of v1v3 PO43- spectral area: integrated Amide I spectral area ratio | (17) |
| crystallinity | 1030 cm-1: 1020 cm-1 relative peak height ratio | (18) |
| acidic phosphate:mineral/relative acidic phosphate content | 1123 cm-1:maximum peak height of v1v3 PO43- band at ∼1040 cm-1 | (19,39) |
| carbonate:mineral/ relative carbonate content | integrated v2 CO32- spectral area: integrated v1v3 PO43- spectral area ratio | (21) |
| type A:type B carbonate/relative type A carbonate | 879:871cm-1 relative peak height ratio | (21) |
| labile:type B carbonate/relative labile carbonate | 866:871cm-1 relative peak height ratio | (21) |
C. Selection of mantle and circumpulpal dentin regions of successive tissue ages and extraction of spectral data from selected regions
Successive maturation stage areas for mantle and circumpulpal dentin were identified, and pooled spectra were extracted from each (fig. 1D-E). For identification of these areas for analysis the DEJ was first defined as the point of transition to progressively higher mineral: matrix values based on the spatially masked mineral:matrix images (fig. 1E). An average of approximately 100μm width was defined for mantle dentin in third lateral incisors, based on the imaging results. Spectra were pooled from pixels of approximately 32μm (5 pixels) of mantle dentin closest to the beginning of the DEJ at the selected maturation stages and co-added to generate a single spectrum. For circumpulpal dentin analysis, the equivalent area was located from 100μm to132μm (32μm wide areas) from the beginning of DEJ at the same cervical to incisal locations. Areas for analysis were approximately 125μm in a cervical to incisal direction for each maturation point, thus making a total of ∼100 pixels at each mantle or circumpulpal dentin observation.
Fig. 1.
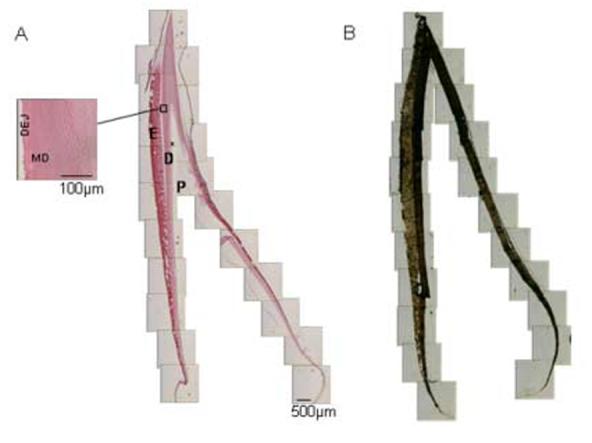
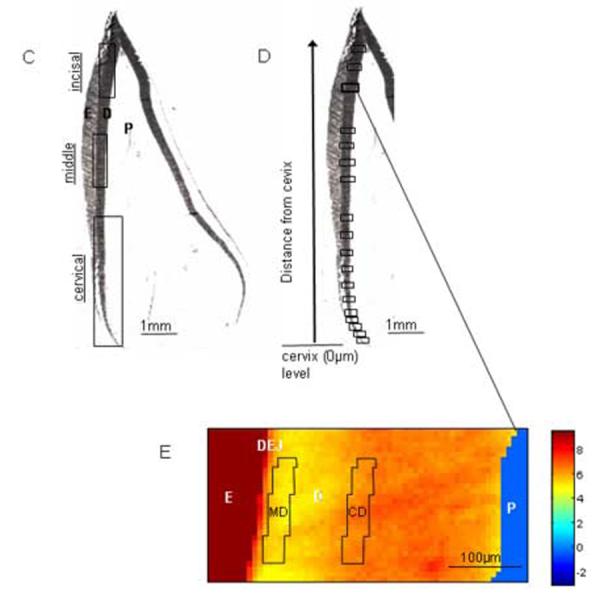
Fetal bovine I3 lateral incisors. (A) Demineralized H&E stained section shows incisor anatomy parts. A matrix gradient of relative matrix amount is noted in the enamel. Note the orientation of dentinal tubules changing sharply in the area close to DEJ, the integrity of which is indicated by the presence of enamel crystals (higher magnification insert). (B) Mineral distribution in a Von Kossa stained non-demineralized section. Note the lower mineral density in the cervical region of both dentin and enamel (light brown-stained) (C) Micrograph of section used for FTIRI analysis showing young (cervical), older (middle) and oldest (incisal) regions. (D) Location of the crown regions in which mantle and circumpulpal dentin was analyzed from the incisor shown in (C). (E) Mineral:matrix image of incisor region indicated by bold frame in (D) Identification of MD and CD pixels from which co-added spectra were extracted. E=enamel, DEJ=dentinoenamel junction, MD=mantle dentin, CD=circumpulpal dentin, D=dentin, P=pulp, *=predentin.
Dentin areas were analyzed every 200μm for the 1,000μm of the cervical end of the crown (when initial changes occur faster) and every 500-1,000μm towards the incisal edge for the rest of the analyzed cervical field. The final results for each analyzed parameter were grouped at 200μm intervals for the cervical 1,000μm and at 500μm intervals thereafter. Means and standard deviations of values for every parameter at the designated distances from the cervix of the tooth were plotted.
Spectroscopic identification of DEJ in young dentin
In the most cervical regions of the developing incisors, the enamel, which was in the secretory or early maturation stage, had mineral: matrix levels similar to those of dentin and the DEJ was not readily identifiable. To address this, the use of a 1650:1660cm-1 relative peak height ratio within the Amide I band was validated. The 1660cm-1 relative peak height represents the collagen triple helix structure within the dentin matrix, while the 1650cm-1 peak is associated with an α-helix conformation of enamel amelogenins [20]. The use of this parameter was validated through identification of early enamel with SEM backscattered imaging.
D. Analysis of spectral data from selected region
Spectra from isolated mantle or circumpulpal regions were exported for calculation of the relevant spectroscopic parameters into another software package (Win IR-Pro 3.1, Digilab, MA). All the results were presented as a function of each analyzed region’s distance from the incisor cervix, the latter representing tissue age.
E. Carbonate substitution analysis
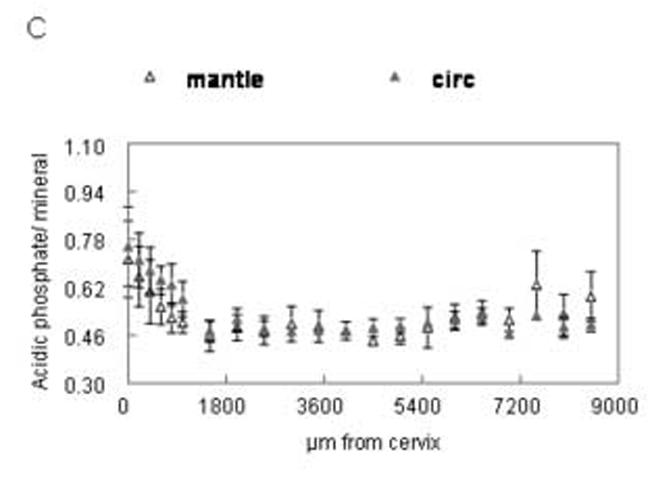
A separate set of thicker (5μm) sections from the same incisors were used for analysis of the carbonate band, as the latter is relatively weak in the younger mineral. The v2 carbonate band consists of 3 sub-bands, corresponding to different types of carbonate substitution (fig. 2C-relative ratios of substitution types calculated as shown in Table I).
Fig. 2.
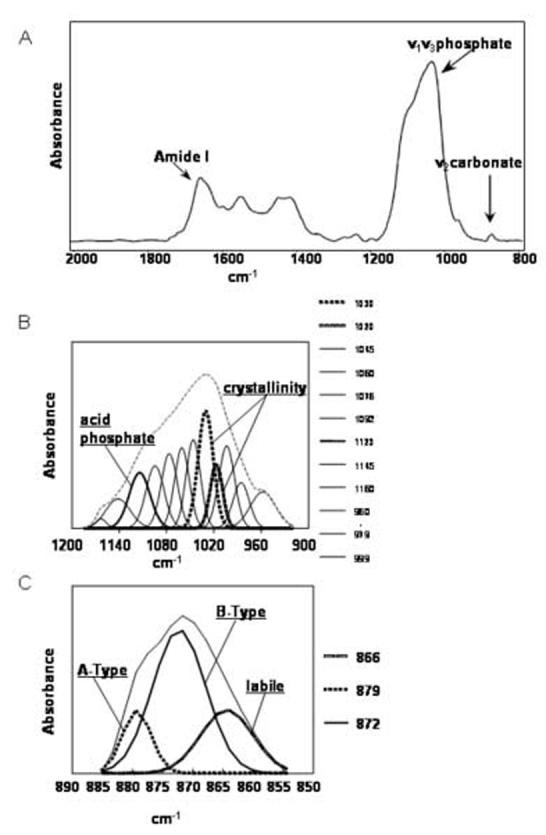
(A) Typical dentin spectrum, indicating spectral areas used in the analysis. (B) v1v3 PO43- band with underlying component modes revealed by curve-fitting. Subbands corresponding to relative peak heights that were used for calculation of crystallinity and acidic phosphate:mineral calculation are noted. (C) v2 CO3= band with components determined by curve-fitting, indicating types of carbonate substitution.
F. Statistical analysis
Statistical analysis was performed on selected segments of the spectroscopic parameter curves plotted against distance of region analyzed from incisor cervix. Correlation of these parameters with distance from cervix was examined. The values were compared between mantle and circumpulpal dentin using repeated measures ANOVA (SPSS 14.0, SPSS Inc., USA).
Results
Histologic analysis of typical unerupted bovine incisors is presented in fig. 1AB. H&E staining of a section from a demineralized specimen (1A) shows the anatomical parts of a crown and the typical distribution of dentinal tubules within the crown. This distribution also coincides with that of collagen fibers and the direction in which the tissue develops in circumpulpal dentin. This regular dentinal tubule pattern discontinues in the mantle dentin area, which instead is characterized by ramifications of dentinal tubules (insert). With the exception of a small area in the incisal region, enamel is still in the secretory or early maturation stage. Fig. 1B shows the gradient of mineral densities from the young tissue cervical areas to mature tissue incisal areas in both dentin and enamel. Fig. 1C-E illustrates the process for localization of dentin areas sampled for the study. The scanned areas within a fetal developing bovine incisor (1C), location of analyzed mantle and circumpulpal dentin regions on the incisor (1D) and location of pixels integrated for mantle and circumpulpal dentin analysis from a single region (1E) are shown schematically.
A typical dentin spectrum, with the v1v3 PO43-, Amide I and v2CO32- spectral areas, is shown in fig. 2A. Corresponding subbands (resulting from component vibrational modes) within the v1v3 PO43- spectral envelope are shown in fig. 2B. Relative peak heights associated with these modes were used for analysis of crystallinity and the relative acidic phosphate content. The component modes within the v2 CO32- spectral area that correspond to different types of carbonate substitution are shown in fig. 2C.
The DEJ in the mineral: matrix images was typically represented by a ∼32μm (5 pixels) wide transition from the mineral:matrix values (3 to 10) that are characteristic of the developing and mature mantle dentin to the very high values (over 30) that are characteristic of enamel. Mantle dentin was approximately 80-100μm wide, with lower mineral:matrix and crystallinity values than the adjacent dentin. Fig.3 shows how the 1650:1660 cm-1 relative peak heights ratio was validated. The backscattered electron image is in good agreement with the 1650:1660 cm-1 image of young enamel.
Fig. 3.
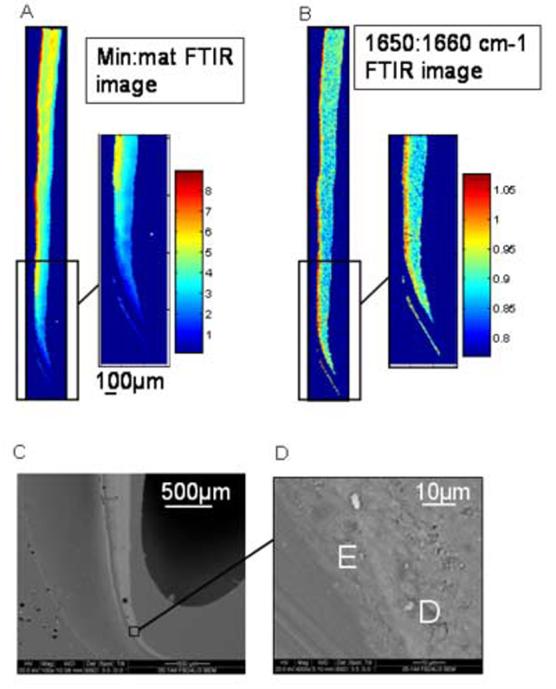
Imaging the enamel matrix: Validation of the 1650:1660 cm-1 (noncollagenous:collagen peak height ratio) identification of enamel in early stages of maturation in the cervical part of an analyzed incisor. (A) Image of mineral: matrix ratio. (B)1650:1660cm-1 FTIRI image. (C) backscattered electron image of same area. Area indicated shown in higher magnification in insert. E=enamel, D=dentin.
Fig. 4 shows the quantitative results for the mineral parameters with the exception of carbonate substitution. Mineral:matrix values (4A) showed a rapid initial increase (first 2,000μm from the cervix), followed by a longer, more progressive one lasting into the most advanced maturation stages (incisal edge). The rate of this increase and the mean values in circumpulpal and mantle dentin differed significantly (Table II). The mineral:matrix values had some fluctuation along the crown that was similar in mantle and circumpulpal dentin and did not reach a plateau for either kind of dentin even at the incisal edge. The youngest of the incisors were not thick enough to obtain data from circumpulpal dentin, so in the 0-600μm region such data points came from fewer observations. These observations were included for the mineral parameters (fig. 4A-C), while they were omitted for the carbonate parameters (fig. 5A-C), as the signal/noise ratio was too low in the most cervical circumpulpal regions.
Fig. 4.
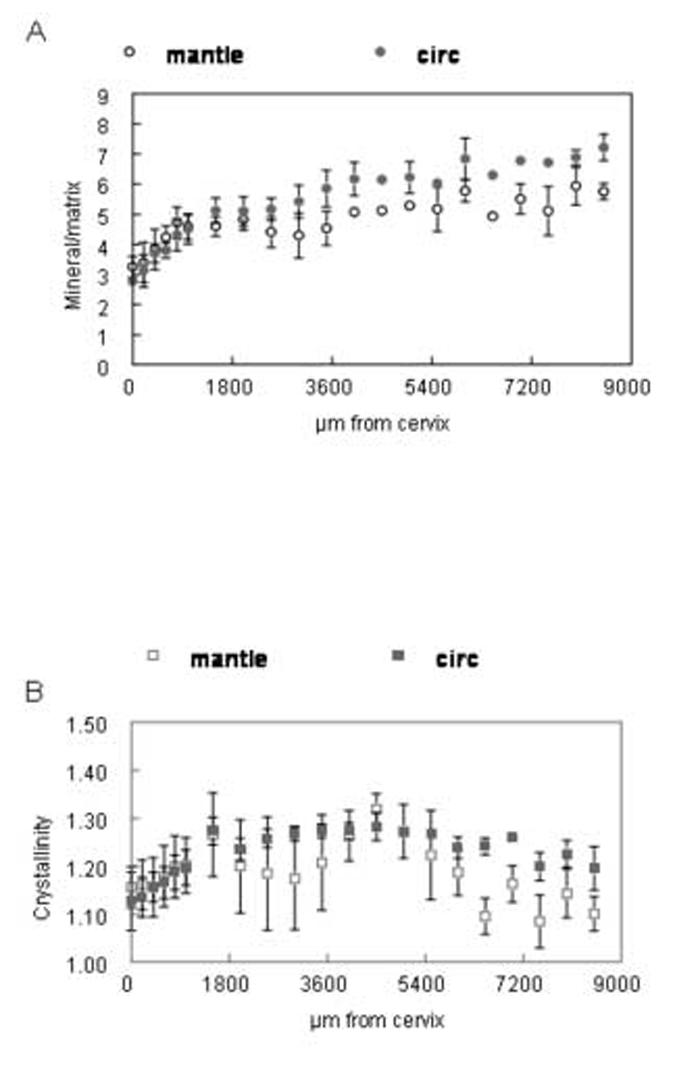
Distribution of spectroscopic mineral parameters as a function of distance from the cervix of the incisor. Means and standard deviations of data points from all six animals at same distance from cervix. (A) mineral:matrix (B) crystallinity (C) relative acidic phosphate content. Where bar is missing, data point comes from a single observation. Open shapes=mantle dentin, closed shapes=circumpulpal dentin.
TABLE II.
DISTRIBUTION OF SPECTROSCOPIC PARAMETERS IN DEVELOPING DENTIN: STATISTICAL ANALYSIS.
| Spectroscopic parameter examined | Distance from cervix (μm) | Statistical analysis |
|---|---|---|
| mineral: matrix | 0 to 2000 | linear correlation: mantle r=0.69, p<0.001/ circ r=0.84, p<0.001 ANOVA, repeated measures: mantle vs circ p<0.001 regression: mantle-circ slope differs, p=0.015 |
| 2000 to 8500 | linear correlation: mantle r=0.6, p<.001/ circ r=0.8, p<0.001 ANOVA, repeated measures: mantle vs circ p<0.001 regression: mantle vs circ slopes differ p=0.013 | |
| crystallinity | 0 to 1600 | linear correlation: mantle r=0.3, p=0.03/ circ r=0.7, p<0.001 mantle vs circ ANOVA: NS |
| 1600 to 5500 | correlation, mantle vs circ ANOVA: NS | |
| 5500 to 8500 | linear correlation: mantle NS / circ r=-.05, p=0.07 ANOVA, repeated measures: mantle vs circ p<0.001 | |
| acidic phosphate: mineral | 0 to 2000 | linear correlation: mantle r=-0.7, p<0.001/ circ r=-0.8, p<0.001 |
| 2000 to 8500 | linear correlation: mantle r=0.5, p=0.001/ circ r=0.3, p=0.03 | |
| 7000 to 8500 | ANOVA, repeated measures: mantle vs circ p=0.02 | |
| carbonate: mineral | 0 to 5000 | correlation, mantle vs circ ANOVA: NS |
| 5000 to 8500 | linear correlation: mantle r=0.5, p<0.001/ circ NS ANOVA, repeated measures: mantle vs circ p<0.001 | |
| type A: type B carbonate | 0 to 5000 | correlation, mantle vs circ ANOVA: NS |
| 5000 to 8500 | linear correlation: mantle r=0.5, p<0.001/ circ NS ANOVA, repeated measures: mantle vs circ p<0.001 | |
| labile: type B carbonate | 0 to 5000 | correlation, mantle vs circ ANOVA : NS |
| 5000 to 8500 | linear correlation: mantle r=0.6, p<0.001/ circ NS ANOVA, repeated measures: mantle vs circ p<0.001 |
Fig. 5.
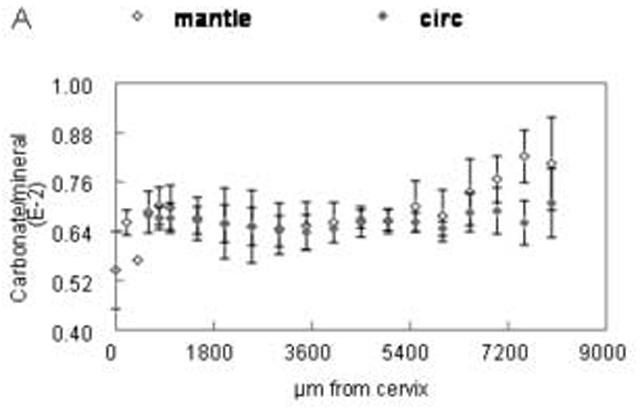
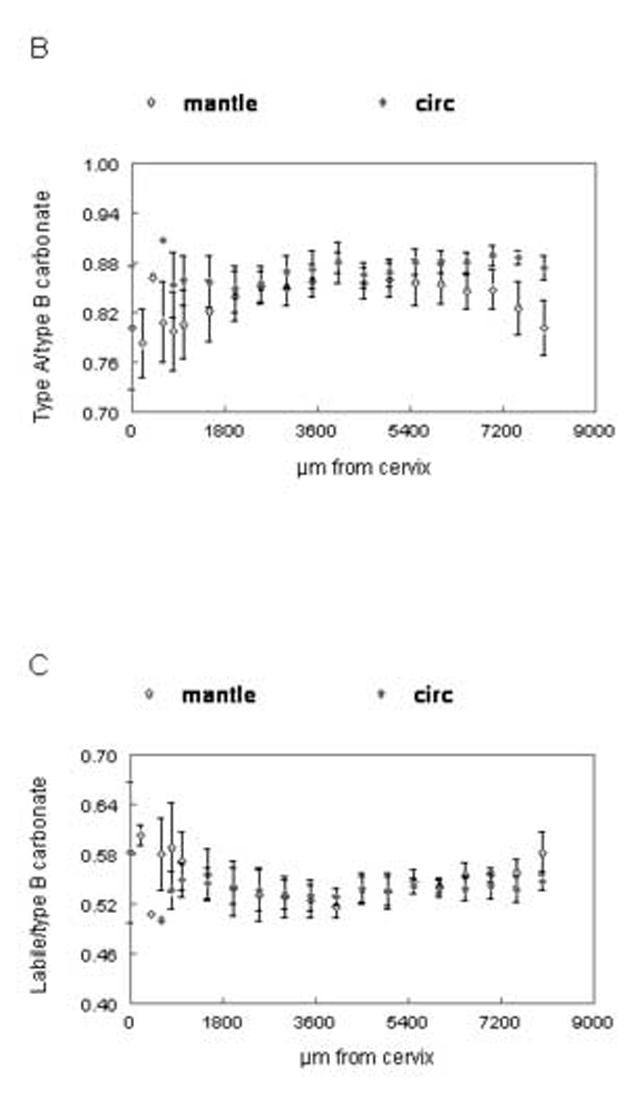
Distribution of spectroscopic carbonate parameters as a function of distance from the cervix of the incisor. Data from the 5μm sections. Means and standard deviations of data points from all animals at same distance from cervix. (A) relative carbonate content (B) A type/B type carbonate (C) labile/B type carbonate. Open shapes=mantle dentin, closed shapes=circumpulpal dentin.
The distribution of crystallinity (fig. 4B-Table II) indicated a relatively sharp increase for both mantle and circumpulpal dentin regions up to a distance of approximately 1,600 μm from the cervix. After that point, the crystallinity values were more evenly distributed and in late stages (over 5,500μm) there was a slight yet statistically significant decrease in circumpulpal dentin regions. Such a decrease was not found for mantle dentin, while the average values were significantly lower than those of circumpulpal dentin. The relative acidic phosphate content showed a pronounced decrease with increasing distance (up to 2,00μm from the cervix; fig. 4C). As with crystallinity, this parameter leveled off. Mantle dentin levels were increased slightly yet significantly at the end of the late stage (over 7,000μm; Table II).
The distributions of the relative carbonate substitution of the mineral, type A/type B carbonate substitution and relative amount of labile carbonate, analyzed on the 5μm sections, are presented in fig. 5A-C. The values of carbonate substitution were comparable in early stages of mantle and circumpulpal dentin (up to 5,000μm from the cervix; (fig. 5A-Table II). At later stages there was a significant positive correlation of carbonate substitution with tissue age in mantle dentin, as well as significantly higher levels of substitution compared to circumpulpal dentin. The relative type of carbonate substitution did not change during the initial stages (fig. 5B; Table II) for mantle or circumpulpal dentin. A-type substitution later became slightly but significantly higher in circumpulpal dentin compared to mantle dentin, with a concomitant slight increase over 5,000μm that was not observed in mantle dentin. The reverse was observed in the relative presence of labile carbonate (fig. 5C), where mantle dentin showed slightly but significantly higher levels at late stages (over 5,000μm), while no changes were observed for mantle or circumpulpal dentin prior to that point.
Discussion
In this study FTIR imaging analyses provided new quantitative information on the spatial variation in mineral properties of developing bovine incisors. While ideally a study of human incisors would be more clinically relevant, it would have been difficult to obtain a sufficient number of incompletely formed crowns, as could be done from bovine fetuses. Results in this study were based on identification of the mantle dentin zone and selection of histologically similar areas at different development stages. The region of circumpulpal dentin that is closest to mantle dentin was selected for analysis because it is the most reproducible area in circumpulpal dentin that can be retrieved and is anatomically similar to mantle dentin. In this way, any differences in mineral properties between the two dentin types identified in the study were likely to reflect differences in their nature and not location-dependent anatomical variability. A coaddition of spectra from ∼100 pixels per analyzed area was used for enhancement of spectral quality and for alleviation of operator bias in area selection. Almost the entire area of a representative 2μm longitudinal section within each incisor was used for study of the mineral properties analyzed through the major (v1,v3) phosphate vibrational mode. More extensive sampling was conducted for rapidly changing young, rather than older, dentin.
Variability in the results may reflect both animal to animal inconsistency as well as variations in the orientation of the sectioning plane in the developing crown, as observed during micro-Computed Tomography (unpublished). Although distance from cervix may not be exactly reproducible from one incisor to the other, one stage of tooth development (late third trimester) and a single tooth type were used to maximize reproducibility. For this discussion, we will assume equivalence between distance from cervix of a given mantle or circumpulpal dentin region in a fetal incisor and time elapsed since the beginning of dentin mineralization in this region. Use of the labial aspect would also minimize variation. It has to be kept in mind that the present results could be expected to differ to a certain extent for the lingual aspect. On a biomechanics level, properties such as the elastic modulus of dentin can be very different between the two locations [7].
The initial steep increase in relative mineral content shown in the results suggested a higher mineral accretion by initial mineral nucleation, rather than by subsequent crystal growth. The same results also indicated that shortly after circumpulpal dentin was formed there was less mineral in mantle compared to circumpulpal level. A part of the observed variability in mineral density and the reported variation in mechanical properties as a function of location [11,13,22] is attributable to thinning of the peritubular dentin [7] and the decrease of dentinal tubule density [6,14,23-24] that occurs progressively away from the pulp. Peritubular dentin is hypermineralized with respect to intertubular dentin, with differences in the estimated mineral content reported ranging from 9% to 40% [23-24]. Close to the DEJ a terminal branching of the dentinal tubules creates a higher relative amount of matrix, further adding to the apparent hypomineralization. The mineral content decrease observed in the present study is much steeper than could be explained by the difference in the relative density of peritubular dentin alone, supporting the distinct nature of mantle dentin. The width of the mantle dentin zone (based here on its distinct mineral properties relative to the rest of dentin) has been a subject of controversy in addition to debate about its relative mineral and matrix content [7,25-26]. In our results, mantle dentin in bovine incisors was represented by an 80-100μm wide strip, in agreement with earlier data [5]. The fluctuations in the increase in mineral density along the crown may be explained by the wavy distribution of dentinal tubules within the crown, or masses of hypomineralized interglobular dentin appearing periodically in the section.
Information on the composition of the mineral was obtained by analysis of relative peak heights were used for the component subbands within the broad v1,v3 PO43- spectral envelope representing crystallinity and relative acidic phosphate content of the mineral. The relative peak height ratio at 1030cm-1 and 1020cm-1 used for crystallinity analysis has been shown to be correlated with results using a curve fitting process in bone [15]. The relative acid phosphate (HPO2- ) content was calculated as the ratio of relative peak heights at 1123cm-1 and the overall v1,v3 PO43- peak [19,27-28]. Spectral analysis showed that higher crystallinity levels in circumpulpal than mantle dentin were established soon after initial mineralization. Crystallinity changes of the dentin mineral were biphasic, with a decrease more prominent in mantle than circumpulpal dentin, taking place during the later stages of mineralization. The final decrease in crystallinity possibly reflects new mineral nucleation, as well as new peritubular dentin forming in later stages [29]. While these changes in the semi-quantitative 1030/1020 cm-1 ratio analysis are relatively small (in the order of approximately 10%), the real changes in crystallinity may be more pronounced. Changes of acidic phosphate content paralleled those of crystallinity, as most of the decrease took place in the initial maturation stages. After a plateau of the acidic phosphate content values for a certain time, there was a slight change in the opposite direction during the latest stages, of which a part could again be the result of late formation of peritubular dentin. Contrary to the case of crystallinity, the pattern of change of acidic phosphate content was similar in mantle and circumpulpal dentin. Ionic substitutions, such as the HPO42-, are important in determining the reactivity and physical properties of hydroxyapatite. While there has been some suggestion that either amorphous calcium phosphate or octacalcium phosphate is the initial mineral phase formed in bones and teeth [30-31], recent NMR studies by Jager et al [32] have demonstrated that the presence of acid phosphate on the surface of the hydroxyapatite nano-crystals can explain the observed spectroscopic data without invoking the presence of another mineral phase. Using infrared spectroscopy and X-ray diffraction, increases in HPO42- content have been determined to produce an expansion of the hydroxyapatite a axis at a rate of ∼0.0015=Å/ wt% [33]. The presence of HPO42-may also induce crystal disorder, as has been shown to happen even in well-crystallized hydroxyapatites when carbonate substitutes for phosphate [34]. Changes in the relative amount of carbonate in the mineral (carbonate:mineral) or the type of carbonate substitution during dentin maturation, in the present results, were not significant. Different trends in carbonate substitution that appeared between mantle and circumpulpal dentin, such as the A type substitution being somewhat higher in circumpulpal dentin, probably required a large sample size to be statistically corroborated. The increase in relative carbonate content of the mantle only dentin that appeared (although not statistically significant) at later stages of maturation could account in part for the decrease in crystallinity evident at the same stages in mantle dentin. An average content for carbonate in dentin has been estimated by gravimetry to be of the order of 3-4% [35]. In density fractionated dentin [2], a slight increase of CO2 (ranging from 2.99% to 3.21%) was found. The present results were similar to those acquired from human teeth analysis [4], with lack of significant changes in the relative amount of carbonate and in relative type of carbonate substitution (A vs. B type).
In a previous study using adult human molars [4] similar properties of developing dentin mineral in a continuum of tissue ages were examined. . An increase of mineral content with dentin maturation was found in the human molars, as in the present bovine incisor study. It was reported that the human dentin at the mineralization front, which was considered to constitute the earliest formed dentin, is poorly crystalline but right beyond that front mineral crystals reach their final crystallinity values and do not evolve further. The present bovine dentin results partly agreed with that observation, but crystallinity here increased over a wider tissue age span. The present results for developing dentin mineral properties can not be directly compared to the results from human molars, because of the qualitative nature of that analysis, the histologic variability that exists between predentin and DEJ independently of developmental stage, and the absence of separate analyses for mantle dentin. Aside from dentin studies, similar quantitative data on mineral density changes have been reported for human cortical, trabecular, and osteonal bone mineral maturation using FTIR microspectroscopy [19,27]. For the osteonal bone, a narrower range of changes in the mineral:matrix values (approximately 25%) was described from the center of the osteon (youngest bone) to its periphery (most mature part), probably as a result of bone remodeling that does not allow for a tissue age range as extensive as in dentin. The existing quantitative data in osteonal and lamellar bone suggest that the overall increase in mineral crystallinity is much greater than the one observed in dentin. Several studies of maturation in synthetic apatites [28] or bone [19,27,36,39] have also shown mineral crystallinity, analyzed by either X-ray diffraction or spectroscopy, to increase with tissue age. The decrease in HPO42- relative content has also been described in bone [36-38], but a relative rate was not provided. For the total carbonate content In bone, both a decrease [19] and an increase of with increasing age [39] have been described. Changes of the carbonate environment with advancing tissue age were shown [19], with a decrease of the labile carbonate, a slight decrease in Type A and a corresponding slight increase in Type B carbonate. The discrepancies between the crystallinity and carbonate findings in bone and dentin studies might be the result of the turnover in bone, or of true differences in regulation of mineralization by the bone and dentin-forming cells and matrix proteins [40].
To the best of our knowledge, this is the first quantitative report of changes in mineral properties of mantle and circumpulpal dentin during maturation. The results showed differences between mantle and circumpulpal dentin in the pattern of these changes, implying some different developmental mechanism. For both dentin types and for all the properties examined, maturation was not a linear process but showed a bi- or multi-phasic nature. It would be of great interest to examine the possibility of an active, cell-regulated mechanism responsible for the changes in the mineral properties observed at late maturation stages, using a suitable animal, cell- or organ-culture model. The present data can independently be used as a reference for relevant studies in human or murine species, under physiologic and pathologic conditions, or studies of developing dentin from genetically targeted animals.
Acknowledgments
This work was done in partial fulfillment of requirements for a PhD in Oral Biology, Univ. of North Carolina in Chapel Hill (K.V.). Supported by NIH DE K08 467 and DE 04141.
This investigation was conducted in a facility constructed with support from Research Facilities Improvement Program grant number C06-RR12538-01 from the National Center for Research Resources, National Institutes of Health.
Footnotes
Publisher's Disclaimer: This is a PDF file of an unedited manuscript that has been accepted for publication. As a service to our customers we are providing this early version of the manuscript. The manuscript will undergo copyediting, typesetting, and review of the resulting proof before it is published in its final citable form. Please note that during the production process errors may be discovered which could affect the content, and all legal disclaimers that apply to the journal pertain.
This study was supported by NIH K08 467, DE 04141 and was conducted in a facility constructed with support from Research Facilities Improvement Program grant number C06-RR12538-01 from the National Center for Research Resources, National Institutes of Health.
References
- [1].Glimcher MJ. The nature of the mineral phase in bone: biological and clinical implications. In: Avioli LV, Krane SM, editors. Metabolic Bone Disease. 3rd Ed. Academic Press; San Diego, CA: 1998. pp. 23–51. [Google Scholar]
- [2].Coclica V, Brudevold F, Amdur BH. The distribution and composition of density fractions from human crown dentine. Arch Oral Biol. 1969;14:451–460. doi: 10.1016/0003-9969(69)90138-1. [DOI] [PubMed] [Google Scholar]
- [3].Tjaderhane L, Hietala EL, Larmas M. Mineral element analysis of carious and sound rat dentin by electron probe microanalyzer combined with backscattered image. J Dent Res. 1995;74:1770–1774. doi: 10.1177/00220345950740110901. [DOI] [PubMed] [Google Scholar]
- [4].Magne D, Weiss P, Bouler JM, Laboux O, Daculci G. Study of the maturation of the organic (type I collagen) and mineral (nonstoihiometric apatite) constituents of a calcified tissue (dentin) as a function of location: a Fourier Transform Infrared Microspectroscopic investigation. J Bone Miner Res. 2001;16:750–757. doi: 10.1359/jbmr.2001.16.4.750. [DOI] [PubMed] [Google Scholar]
- [5].Verdelis K, Crenshaw MA, Paschalis EP, Doty S, Atti E, Boskey AL. Spectroscopic imaging of mineral maturation in bovine dentin. J Dent Res. 2003;82:697–702. doi: 10.1177/154405910308200908. [DOI] [PubMed] [Google Scholar]
- [6].Pashley DH. Dentin: a dynamic substrate-a review. Scanning Microsc. 1989;3:161–176. [PubMed] [Google Scholar]
- [7].Zaslansky P, Friesem A, Weiner S. Structure and mechanical properties of the soft zone separating bulk dentin and enamel in crowns of human teeth: insight into tooth function. J. Struct. Biol. 2006;153:188–189. doi: 10.1016/j.jsb.2005.10.010. [DOI] [PubMed] [Google Scholar]
- [8].Wang RZ, Weiner S. Strain-structure relations in human teeth using Moire fringes. J. Biomechanics. 1998;31:135–141. doi: 10.1016/s0021-9290(97)00131-0. [DOI] [PubMed] [Google Scholar]
- [9].Kinney JH, Balooch M, Marshall SJ, Marshall GW, Weihs TP. Hardness and Young’s modulus of human peritubular and intertubular dentine. Arch Oral Biol. 1996;41:9–13. doi: 10.1016/0003-9969(95)00109-3. [DOI] [PubMed] [Google Scholar]
- [10].Wentrup-Byrne E, Armstrong CA, Armstrong RS, Collins BM. Fourier transform Raman microscopic mapping of the molecular components in a human tooth. J Raman Spectrosc. 1997;28:151–158. [Google Scholar]
- [11].Tesch W, Eidelman N, Roschger P, Goldenberg F, Klaushofer K, Fratzl P. Graded microstructure and mechanical properties of human crown dentin. Calcif Tissue Int. 2001;69:147–57. doi: 10.1007/s00223-001-2012-z. [DOI] [PubMed] [Google Scholar]
- [12].Stratmann U, Schaarschmidt K, Wiesmann HP, Plate U, Hohling HJ, Szuwart T. The mineralization of mantle dentin and of circumpulpal dentin in the rat: an ultrastructural and elemental-analytical study. Anat Embryol. 1997;195:289–297. doi: 10.1007/s004290050048. [DOI] [PubMed] [Google Scholar]
- [13].Takano Y, Sakai H, Baba O, Sakamoto Y, Terashima T, Ohya K, Kurosaki N. Demonstration of putative Ca-binding domains in dentin matrix of rat incisors after daily injections of 1-hydroxyethylidene-1,1-bisphosphonate (HEBP) Eur J Oral Sci. 1998;106(Suppl 1):274–281. doi: 10.1111/j.1600-0722.1998.tb02187.x. [DOI] [PubMed] [Google Scholar]
- [14].Moss ML. Studies on dentin. I. Mantle dentin. Acta Anat. 1974;87:481–507. [PubMed] [Google Scholar]
- [15].Faibish D, Gomes A, Boivin G, Binderman I, Boskey AL. Infrared imaging of calcified tissue in bone biopsies from adults with osteomalacia. Bone. 2005;36:6–12. doi: 10.1016/j.bone.2004.08.019. [DOI] [PubMed] [Google Scholar]
- [16].Ling Y, Rios HF, Myers ER, Lu Y, Feng JQ, Boskey AL. DMP1 depletion decreases bone mineralization in vivo: an FTIR imaging analysis. J Bone Miner Res. 2005;20:2169–77. doi: 10.1359/JBMR.050815. [DOI] [PMC free article] [PubMed] [Google Scholar]
- [17].Pienkowski D, Doers TM, Camacho NP, Boskey AL, Malluche HH. Calcitonin alters bone quality in beagle dogs. J Bone Miner Res. 1997;12:1936–1943. doi: 10.1359/jbmr.1997.12.11.1936. [DOI] [PubMed] [Google Scholar]
- [18].Boskey AL, Moore DJ, Amling M, Canalis E, Delany AM. Infrared analysis of the mineral and matrix in bones of osteonectin-null mice and their wildtype controls. J Bone Miner Res. 2003;18:1005–1011. doi: 10.1359/jbmr.2003.18.6.1005. [DOI] [PubMed] [Google Scholar]
- [19].Paschalis EP, Jacenko O, Olsen B, Mendelsohn R, Boskey AL. Fourier transform infrared microspectroscopic analysis identifies alterations in mineral properties in bones from mice transgenic for type × collagen. Bone. 1996;19:151–156. doi: 10.1016/8756-3282(96)00164-0. [DOI] [PubMed] [Google Scholar]
- [20].Rey C, Renugopalakrishnan V, Collins B, Shimizu M, Collins B, Glimcher MJ. A resolution Fourier Transform Infrared spectroscopic study of the environment of the CO32- ion in the mineral phase of enamel during its formation and maturation. Calcif Tissue Int. 1991;49:259–268. doi: 10.1007/BF02556215. [DOI] [PubMed] [Google Scholar]
- [21].Rey C, Collins B, Goehl T, Dickson IR, Glimcher MJ. The carbonate environment in bone mineral: a resolution-enhanced Fourier Transform Infrared spectroscopy study. Calcif Tissue Int. 1989;45:157–164. doi: 10.1007/BF02556059. [DOI] [PubMed] [Google Scholar]
- [22].Mjor IA. Human coronal dentin: structure and reactions. J Oral Surg. 1972;33:810–823. doi: 10.1016/0030-4220(72)90451-3. [DOI] [PubMed] [Google Scholar]
- [23].Miller WA, Eick JD, Neiders ME. Inorganic components of the peritubular dentin in young human permanent teeth. Caries Res. 1971;5:264–78. doi: 10.1159/000259752. [DOI] [PubMed] [Google Scholar]
- [24].Jones SJ, Boyde A. Ultrastructure of dentin and dentinogenesis. In: Linde A, editor. Dentin and Dentinogenesis. 1st ed. CRC Press; Bocca Raton, FLA: 1984. pp. 81–134. [Google Scholar]
- [25].Sanchez-Quevedo MC, Crespo PV, Garcia JM, Campos A. X-ray microanalytical histochemistry of human circumpulpar and mantle dentine. Bone Miner. 1989;6:323–9. doi: 10.1016/0169-6009(89)90037-8. [DOI] [PubMed] [Google Scholar]
- [26].Pleshko NL, Boskey AL, Mendelsohn R. Novel infrared spectroscopic method for the determination of crystallinity of hydroxyapatite minerals. Biophys J. 1991;60:786–793. doi: 10.1016/S0006-3495(91)82113-0. [DOI] [PMC free article] [PubMed] [Google Scholar]
- [27].Paschalis EP, Betts F, DiCarlo E, Mendelsohn R, Boskey AL. FTIR microspectroscopic analysis of human iliac crest biopsies from untreated osteoporotic bone. Calcif Tissue Int. 1997;61:487–492. doi: 10.1007/s002239900372. [DOI] [PubMed] [Google Scholar]
- [28].Gadaleta SJ, Camacho NP, Mendelsohn R, Boskey AL. Fourier Transform. Infrared microscopy of calcified turkey leg tendon. Calcif Tissue Int. 1996;58:17–23. doi: 10.1007/BF02509541. [DOI] [PubMed] [Google Scholar]
- [29].Lefèvre R, Frank RM, Voegel JC. The study of human dentine with secondary ion microscopy and electron diffraction. Calcif Tissue Res. 1976;19:251–61. doi: 10.1007/BF02564008. [DOI] [PubMed] [Google Scholar]
- [30].Crane NJ, Popescu V, Morris MD, Steenhuis P, Ignelzi MA., Jr. Raman spectroscopic evidence for octacalcium phosphate and other transient mineral species deposited during intramembranous mineralization. Bone. 2006 Sep;39(3):434–42. doi: 10.1016/j.bone.2006.02.059. [DOI] [PubMed] [Google Scholar]
- [31].Bodier-Houlle P, Steuer P, Voegel JC, Cuisinier FJ. First experimental evidence for human dentine crystal formation involving conversion of octacalcium phosphate to hydroxyapatite. Acta Crystallogr D Biol Crystallogr. 1998 Nov 1;54(Pt 6 Pt 2):1377–81. doi: 10.1107/s0907444998005769. [DOI] [PubMed] [Google Scholar]
- [32].Jager C, Welzel T, Meyer-Zaika W, Epple M. A solid-state NMR investigation of the structure of nanocrystalline hydroxyapatite. Magn Reson Chem. 2006 Jun;44(6):573–80. doi: 10.1002/mrc.1774. [DOI] [PubMed] [Google Scholar]
- [33].Young RA, Holcomb DW. Role of acid phosphate in hydroxyapatite lattice expansion. Calcif Tissue Int. 1984;36:60–63. doi: 10.1007/BF02405294. [DOI] [PubMed] [Google Scholar]
- [34].LeGeros RZ, Trautz O, LeGeros JP, Klein E. Carbonate substitution in the apatite structure. Bull Soc Chim Biol. 1968:1712. doi: 10.1007/BF01903856. [DOI] [PubMed] [Google Scholar]
- [35].Posner AS, Tannenbaum PJ. The mineral phase of dentin. In: Linde A, editor. Dentin and Dentinogenesis. CRC Press; Boca Raton, FLA: 1984. [Google Scholar]
- [36].Bonar LC, Roufosse AH, Sabine WK, Grynpas MD, Glimcher MJ. X-ray diffraction studies of the crystallinity of bone mineral in newly synthesized and density fractionated bone. Calcif Tissue Int. 1983;35:202–209. doi: 10.1007/BF02405032. [DOI] [PubMed] [Google Scholar]
- [37].Roufosse AH, Aue WP, Roberts JE, Glimcher MJ, Griffin RG. Investigation of the mineral phases of bone by solid-state phosphorus-31 magic angle sample spinning nuclear magnetic resonance. Biochemistry. 1984;23:6115–20. doi: 10.1021/bi00320a033. [DOI] [PubMed] [Google Scholar]
- [38].Rey C, Hina A, Glimcher MJ. Maturation of poorly crystalline apatites: chemical and structural aspects in vivo and in vitro. Cells and Materials. 1995;5:345–356. [Google Scholar]
- [39].Rey C, Beshah K, Griffin R, Glimcher MJ. Structural studies of the mineral phase of calcifying cartilage. J Bone Miner Res. 1991;6:515–525. doi: 10.1002/jbmr.5650060514. [DOI] [PubMed] [Google Scholar]
- [40].Butler WT, Ritchie H. The nature and functional significance of dentin extracellular matrix proteins. Int J Dev Biol. 1995;39:169–79. [PubMed] [Google Scholar]