

Abstract
Corticosteroids, hepatocyte growth factor (HGF), and epidermal growth factor (EGF) play important roles in hepatic biology. We have previously shown that these molecules are required for formation of tissue with specific histology in complex organoid cultures. Dexamethasone suppresses growth and induces hepatocyte maturation; HGF and EGF are needed for formation of the nonepithelial elements. All three are needed for formation of the biliary epithelium. The gene expression patterns by which corticosteroids, HGF, and EGF mediate their effects in hepatic tissue formation are distinct. These patterns affect many gene families and are described in detail. In terms of main findings, dexamethasone induces expression of both HNF4 and C/EBPα, essential transcription factors for hepatocyte differentiation. It suppresses hepatocyte growth by suppressing many molecules associated with growth in liver and other tissues, including IL-6, CXC-chemokine receptor, amphiregulin, COX-2, HIF, etc. HGF and EGF induce all members of the TGF-β family. They also induced multiple CNS-related genes, probably associated with stellate cells. Dexamethasone, as well as HGF and EGF, induces expression of HNF6-β, associated with biliary epithelium formation. Combined addition of all three molecules is associated with mature histology in which hepatocyte and biliary lineages are separate and HNF4 is expressed only in hepatocyte nuclei. In conclusion, the results provide new and surprising information on the gene expression alterations by which corticosteroids, HGF, and EGF exert their effects on formation of hepatic tissue. The results underscore the usefulness of the organoid cultures for generating information on histogenesis, which cannot be obtained by other culture or whole animal models.
Keywords: Gene arrays, Three-dimensional cultures, Hepatocytes, Biliary cells, Growth regulation
HEPATOCYTES isolated by perfusion of rat liver with collagenase contain a small contaminant population of other hepatic cells, such as stellate cells, biliary epithelium, endothelial cells, etc. The primary isolates reorganize to form tissue with recognizable, albeit altered, hepatic microarchitecture in roller bottle cultures under the influence of insulin, nicotinamide, corticosteroids (dexamethasone), hepatocyte growth factor (HGF), and epidermal growth factor (EGF). Histology in these organoid cultures consists of a surface layer of mature biliary epithelium, an intermediate layer of hepatocytes and stellate cells, and a layer of endothelial cells attached to the substratum (46). Biliary epithelium in the surface of these cultures is in large part derived from hepatocytes undergoing trans-differentiation (45). HGF and EGF are required for the formation of the biliary epithelium and the connective tissue. The effects on connective tissue are probably mediated by regulation of expression of TGF-β family members (46). Dexamethasone, in the absence of HGF and EGF, induces maturation of cells exclusively towards the hepatocytic lineage. Biliary epithelium is absent without addition of HGF or EGF. When dexamethasone, HGF, and EGF are all removed, immature hepatocytes present in the cultures undergo intensive proliferation. The reproducibility of histologic alterations induced by addition of specific cytokines provides a useful model for analysis of the mechanisms by which these and other cytokines contribute to the morphogenesis of hepatic tissue. In the current studies, we analyzed the underlying gene expression patterns associated with the morphogenetic changes related to dexamethasone, HGF, and EGF. The results obtained provide unexpected insights as to the pathways involved and the nature of the signaling mediators related to proliferation and maturation of hepatic cellular elements during tissue formation.
MATERIALS AND METHODS
Animals
Fisher 344 male rats were obtained from Charles River Laboratories (Frederick, MD, USA). All procedures performed on the rats employed for these studies were approved under the IACUC protocol # 0699068A-1 and conducted according to National Institute of Health guidelines.
Materials
EGF was obtained from Collaborative Biomedical (Waltham, MA). Collagenase for hepatocyte isolation was obtained from Boehringer Mannheim (Mannheim, Germany). Vitrogen (from Celtrix Labs., Palo Alto, CA) was used for collagen coating of roller bottles. General reagents and retrorsine were obtained from Sigma (St. Louis, MO). EGF was purchased from Collaborative Biomedical. HGF used for these studies was the Δ5 variant and was kindly donated by Snow Brand Co. (Toshigi, Japan). Antibodies were obtained from the following sources: proliferating cell nuclear antigen (PCNA) (Signet Laboratories), amphiregulin (NeoMarkers, Inc, Fremont, CA), CXC chemokine receptor (Research Diagnostic, Inc., Flanders, NJ), vascular endothelial growth factor (VEGF), VEGF receptor Flk-1, IGF1, and HNF4 (Santa Cruz Biotechnology, Inc., Santa Cruz, CA).
Generation and Maintenance of Organoid Cultures
The techniques used to generate the organoid cultures from the livers of the rats were exactly as we recently described (46). Rat hepatocytes were isolated by an adaptation of Seglen’s calcium two-step collagenase perfusion technique (63) as previously described from our laboratory (7). Freshly isolated hepatocytes were added to roller bottles (1450 cm2 pleated surface) obtained from Falcon (Franklin Lakes, NJ). Each bottle contained 210 million freshly isolated hepatocytes in 250 ml of hepatocyte growth medium (HGM) supplemented with HGF (40 ng/ml) and EGF (20 ng/m). The bottles were rotated at a rate of 2.5 rotations per minute and kept in an incubator maintained at 37°C, saturated humidity, and 5% CO2. The HGM was used to maintain the cultures. The composition of the medium was also as recently described. DMEM liquid medium, HEPES, glutamine, and antibiotics were purchased from GIBCO/BRL (Grand Island, NY). ITS mixture (insulin, transferrin, selenium) was purchased from Boehringer Mannheim. All other additives were cell culture grade (Sigma). Unless otherwise indicated for specific experiments, the basal HGM consisted of DMEM supplemented with purified bovine albumin (2.0 g/L), glucose (2.25 g/L), galactose (2.0 g/L), ornithine (0.1 g/L), proline (0.030 g/L), nicotinamide (0.305 g/L), ZnCl2 (0.544 mg/L), ZnSO4:7H2O (0.750 mg/L), CuSO4:5H2O (0.20 mg/L), MnSO4 (0.025 mg/L), glutamine (5.0 mmol/L), and dexamethasone (10−7 mol/L). Gentamicin (50 μg/ml) was added to the basal HGM. The mixed basal HGM was sterilized by filtration through a 0.22-μm low-protein-binding filter system, stored at 4°C, and used within 4 weeks. ITS 1.0 g/L [rh-insulin 5.0 mg/L, human transferrin 5.0 mg/ L (30% diferric iron saturated), selenium 5.0 μg/L] was added after filtration immediately before use. The growth factors, as required, were added to HGM fresh at the specified concentrations every time the medium was changed. Tissue samples were taken at different times during the cultures to assess histology.
Analysis of Gene Expression: Data Generation and Statistics
Affymetrix Chip Analysis
The Affymetrix oligo-nucleotide chips specific for the rat (U34 A chip) containing 8000 expressed sequences specific for the rat genome.
cRNA Preparation
RNA was isolated from organoid cultures kept in different conditions. The RNA was isolated at day 20 of the cultures. Three separate culture sets (each from a separate rat) were used to prepare RNA for analysis of gene expression. Total RNA was extracted and purified with Qiagen RNeasy kit (Qiagen, San Diego, CA). Five micrograms of total RNA was used in the first-strand cDNA synthesis with T7-d(T)24 primer [GGCCAGTGAATTGTAAT ACGACTCACTATAGGGAGGCGG-(dT)24] by Superscript™ II (GIBCO-BRL, Rockville, MD). The second-strand cDNA synthesis was carried out at 16°C by adding E. coli DNA ligase, E. coli DNA polymerase I, and RnaseH in the reaction. This was followed by the addition of T4 DNA polymerase to blunt the ends of newly synthesized cDNA. The cDNA was purified through phenol/chloroform and ethanol precipitation. The purified cDNA were then incubated at 37°C for 4 h in an in vitro transcription reaction to produce cRNA labeled with biotin using MEGA-script™ system (Ambion, Inc., Austin, TX).
Affymetrix Chip Hybridization
cRNA (15–20 μg) was fragmented by incubating in a buffer containing 200 mM Tris-acetate, pH 8.1, 500 mM KOAc, 150 mM MgOAc at 95°C for 35 min. The fragmented cRNA was then hybridized with a preequilibrated Affymetrix chip at 45°C for 14–16 h. After the hybridization cocktails were removed, the chips were then washed in a fluidic station with low-stringency buffer (6× SSPE, 0.01% Tween 20, 0.005% antifoam) for 10 cycles (2 mixes/cycle) and stringent buffer (100 mM MES, 0.1 M NaCl, and 0.01% Tween 20) for 4 cycles (15 mixes/cycle), and stained with SAPE (strepto-avidin phycoerythrin). This was followed by incubation with biotinylated mouse anti-avidin antibody, and restaining with SAPE. The chips were scanned in a HP ChipScanner (Affymetrix Inc., Santa Clara, CA) to detect hybridization signals.
Analysis
The analysis was conducted through an Affymetrix microarray suite 5.0 software. Data were exported and tabulated on Excel spreadsheet (Microsoft Office). The mean and standard error of the logarithm (base 2) of the data were expressed. Three totally separate preparations, each from a separate rat, and each used for the four experimental categories analyzed, were used for the studies. Means and standard error from each category of the three data sets (control, dexamethasone, HGF + EGF, and combined (dexamethasone + HGF + EGF) were derived. In addition, the p-value of the difference between the mean of the control cultures and the mean of the specially treated cultures was determined for each gene. Only genes in which the difference between the control and the treated category was less than 0.05 were used for the generation of the data presented.
RESULTS
Effects of Dexamethasone, HGF, and EGF on Histology of the Organoid Cultures
These results were as previously described in work from our laboratory (46). Cultures maintained in HGM alone (containing insulin and nicotinamide) exhibited a high rate of spontaneous proliferation (Fig. 1A). Mitoses were readily observed. The PCNA labeling index was 94% and the percent of nuclei labeled by Ki-67 was 24%. The cells had the appearance of small hepatocytes. No biliary epithelial cells were seen. Staining for HNF4 shows that only 27% percent of nuclei stained strongly positive for this transcription factor (Fig. 1B). There was very little connective tissue. Addition of dexamethasone induced an increase in the size of the cells, which were recognized as mature hepatocytes (Fig. 1C). Several apoptotic hepatocytes were also noted. There was a dramatic decrease in cell proliferation (PCNA 39.7% and Ki-67 1%). Mitotic index was 0, whereas in the control cultures it was very high, at 2.3%. More than 95% of the nuclei stained strongly positive for HNF4 (Fig. 1D). No connective tissue or biliary epithelium were seen. Addition of HGF and EGF in the medium altered the histology of the organoid cultures (Fig. 1E). The cells had an appearance most resembling “oval cells” as described in livers of rats subjected to a variety of protocols causing liver regeneration and suppression of hepatocyte proliferation (2,17). There was no clear distinction between surface biliary epithelium and hepatocytes. Staining for HNF4 showed that 18% of the nuclei contained this transcription factor (Fig. 1F). Percent of nuclei labeled with PCNA was more than 90% and the percent labeled with Ki-67 was 16%. Combined addition of dexamethasone, HGF, and EGF resulted in separation of hepatocytic and biliary lineages, with biliary epithelium appearing on the surface of the organoid cultures (Fig. 1G). Cytokeratin 19 was seen only on the surface biliary epithelium (46). HNF4 was only observed in nuclei of hepatocytes, most of which (more than 80%) contained the transcription factor (Fig. 1H). PCNA labeling index was more than 70%. Ki-67 labeling for hepatocytes was less than 5%, whereas more than 60% of the biliary epithelium stained positive for Ki-67, as previously described (46).
Figure 1.
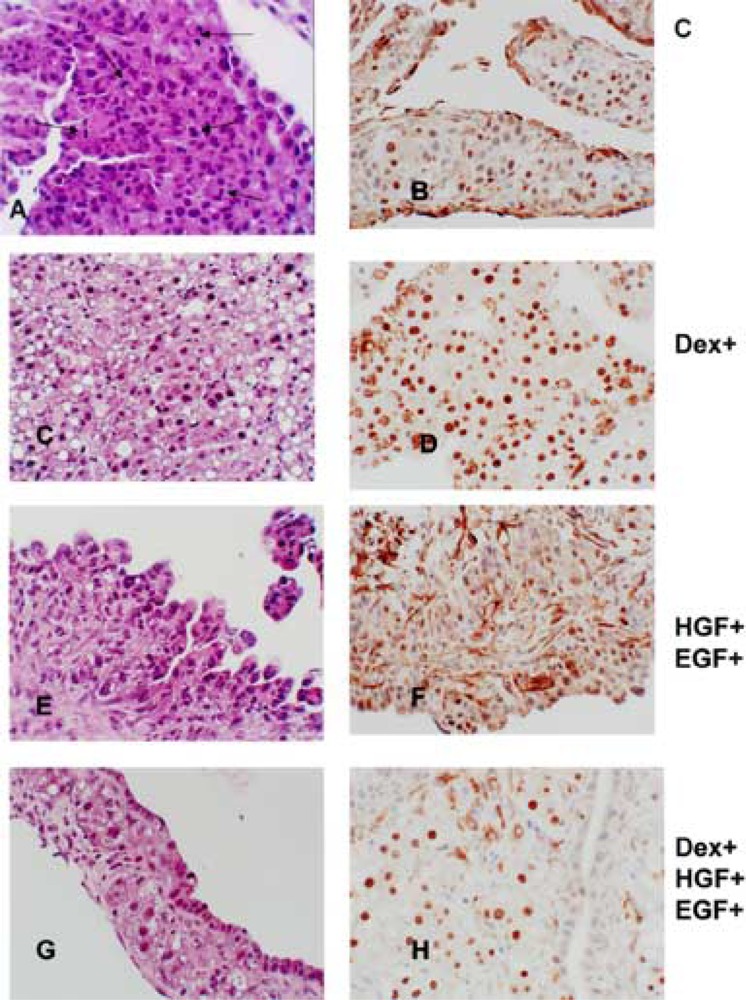
Histology of the organoid cultures under the influence of dexamethasone, HGF, and EGF. Medium supplements are shown to the right of the photomicrographs. (A, C, E, G) Sections of tissue from the organoid cultures stained with hematoxylin and eosin. (A) Arrows point to mitoses seen in the control cultures. (B, D, F, H) Immunohistochemical staining for HNF4. Notice the partition of the nuclear stain between hepatocytes and biliary epithelium in (H). Original magnifications: 400×.
Gene Expression Patterns Induced by Dexamethasone
Expression of genes following addition of dexamethasone was examined in three separate organoid cultures prepared from three different liver perfusions. The results show that dexamethasone suppressed growth of hepatic cells and promoted hepatocyte differentiation by affecting expression of many signaling molecules and signal transduction pathways. Table 1 shows a list of the genes affected and the fold increase or suppression induced by dexamethasone. Most of the genes affected were associated with previous literature as growth or differentiation regulators in liver or other related tissues. Of the group of genes whose expression change was statistically significant (p < 0.05), only the most dramatically affected genes are discussed below. The values in parentheses after each gene indicate the degree or gene expression in dexamethasone-treated cultures as percent of gene expression in control cultures not treated with dexamethasone, HGF, or EGF.
TABLE 1.
DEXAMETHASONE EFFECTS ON HEPATIC ORGANOID GENE EXPRESSION PATTERNS
| Gene Name | Gene Number | Gene Expression (% of Control) |
|---|---|---|
| Growth Factors and Signaling Cytokines | ||
| Suppressed genes | ||
| Interleukin 6 (IL-6) gene | M26745 | 2.48% |
| Angiopoietin-2, partial | AF030378 | 2.60% |
| Pancreatitis-associated protein | M98049 | 3.05% |
| Nonselective-type endothelin receptor | S65355 | 3.20% |
| Amphiregulin (schwannoma-derived growth factor) | X55183 | 6.70% |
| Insulin-like growth factor-binding protein 3 (IGF-BP3) | M31837 | 7.35% |
| ET-B endothelin receptor | X57764 | 8.64% |
| CXC chemokine receptor (CXCR4) | U90610 | 8.84% |
| Drosophila polarity gene (frizzled) | L02529 | 10.39% |
| Plasminogen activator inhibitor 2 type A (PAI2A) | X64563 | 11.14% |
| Cyclooxygenase isoform COX-2 | S67722 | 11.40% |
| Adrenomedullin precursor | D15069 | 11.40% |
| Neuropilin | AF016296 | 11.94% |
| IGF-1 | X06107 | 12.50% |
| TGF-β1 | X52498 | 16.49% |
| Gro | D11445 | 16.49% |
| CXC chemokine LIX | U90448 | 19.39% |
| Nonselective-type endothelin receptor | S65355 | 19.84% |
| Urokinase receptor uPAR-1 | X71898 | 20.31% |
| Glioma-derived endothelial cell growth factor (ECGF) | M32167 | 21.27% |
| Vascular endothelial growth factor (VEGF) | L20913 | 22.79% |
| Putative pheromone receptor (Go-VN2) | AF016179 | 22.79% |
| Fibroblast growth factor receptor 1 | AF000144 | 23.33% |
| Interleukin 2, (IL-2) | M22899 | 29.39% |
| Very low density lipoprotein receptor (VLDLR) | L35767 | 30.08% |
| Interleukin-1 beta-converting enzyme | S79676 | 30.08% |
| Corticotropin releasing hormone (CRH) gene | M54987 | 30.78% |
| Interleukin 10 (IL-10) | L02926 | 33.76% |
| Interleukin-15 | U69272 | 38.78% |
| SCGF Stem cell growth factor | AB009246 | 39.69% |
| VEGF receptor-2/FLK-1 | U93306 | 37.89% |
| Angiotensin/vasopressin receptor (AII/AVP) | M85183 | 41.56% |
| Cyclooxygenase 1 | U03388 | 45.59% |
| Fas antigen ligand | U03470 | 46.65% |
| Increased genes | ||
| IGF binding protein-1 (rIGFBP-1) | M58634 | 2785.76% |
| Growth hormone receptor | Z83757 | 1329.98% |
| Glucagon receptor | M96674 | 606.29% |
| Transforming growth factor-beta 3 (TGF-β3) | U03491 | 481.21% |
| Transferrin | D38380 | 438.73% |
| Epidermal growth factor receptor (EGFR) | M37394 | 428.71% |
| Asialoglycoprotein receptor (hepatic lectin) | K02817 | 364.69% |
| GABA(A) receptor beta-3 subunit | X15468 | 356.36% |
| Acetylcholine receptor beta-subunit | X74833 | 276.38% |
| Fos-related antigen | U34932 | 276.38% |
| Transforming growth factor-alpha (TGF-α) | M31076 | 151.57% |
| Transcription Factors | ||
| Suppressed genes | ||
| Hypoxia-inducible factor 1 (HIF-1) | Y09507 | 11.94% |
| Proliferating cell nuclear antigen (PCNA/cyclin) | M24604 | 39.69% |
| Increased genes | ||
| Hepatocyte nuclear factor 4 (HNF4) | X57133 | 527.80% |
| Hepatocyte nuclear factor 3a (HNF3-β) | L09647 | 400.00% |
| Cyclin D2 | D16308 | 390.86% |
| C/EBPα | X12752 | 356.36% |
| Hepatocyte nuclear factor 6 beta (HNF6-β) | Y14933 | 356.36% |
| c-Myc oncogene and flanking regions | Y00396 | 332.50% |
| Retinoid X receptor gamma (RXRγ) | AF016387 | 296.22% |
| HNF3-γ | AB017044 | 235.11% |
| Stat3 protein | X91810 | 229.74% |
| HNF3/forkhead homolog-1 (HFH-1) | L13201 | 125.99% |
| A1F-C1 | AB016536 | 257.87% |
| Matrix-Related Proteins and Proteases | ||
| Suppressed genes | ||
| Osteopontin | M14656 | 1.13% |
| Macrophage metalloelastase (MME) | X98517 | 2.16% |
| Dermatan sulfate proteoglycan-II (decorin) | Z12298 | 2.42% |
| Versican V3 isoform precursor | AF072892 | 4.42% |
| Decorin | X59859 | 8.06% |
| Embigin protein | AJ009698 | 9.47% |
| Lumican | X84039 | 11.94% |
| Platelet-endothelial cell adhesion molecule-1/CD31 | U77697 | 11.96% |
| Collagen alpha1 type I | Z78279 | 14.69% |
| Osteonectin | Y13714 | 16.88% |
| Collagen type III alpha-1 | M21354 | 18.51% |
| Tissue inhibitor of metalloproteinase type 2 (TIMP-2) | S72594 | 26.18% |
| Tenascin | U09361 | 30.78% |
| Fibronectin (fn-1) gene, partial | U82612 | 32.99% |
| Plasminogen activator inhibitor-1 (PAI-1) | M24067 | 37.89% |
| Increased genes | ||
| Beta-2 glycoprotein I | X15551 | 37916.00% |
| Polyprotein 1-microglobulin/bikunin | S87544 | 1970.00% |
| Vitronectin | U44845 | 649.80% |
| Hepsin | X70900 | 324.90% |
| Fibronectin gene, exons 2b and 3a | M28259 | 317.48% |
| Brevican core protein | U37142 | 251.98% |
| Hepatocyte Differentiation Genes | ||
| Suppressed genes | ||
| Cytochrome P-450 isozyme 5 (P450 IVB2) | M29853 | 14.69% |
| Glutamine synthetase | M91652 | 23.87% |
| Increased genes | ||
| Argininosuccinate synthetase (EC 6.3.4.5) | XI2459 | 11404.00% |
| Cytochrome P450 monooxygenase (CYP2J3) | U39943 | 5079.68% |
| Apolipoprotein A-IV | M00002 | 3055.49% |
| Glycogen synthase | J05446 | 2785.76% |
| Fatty acid transporter | AB005743 | 2599.21% |
| Cytochrome P-450(M-1) gene, exon 9 | Ml 8363 | 2369.76% |
| Plasminogen | M62832 | 2315.63% |
| Plasma proteinase inhibitor alpha-1-inhibitor III | M22360 | 2211.06% |
| Alpha-2-macroglobulin gene, exons 5 and 6 | M22670 | 2160.56% |
| UDP-glucuronosyltransferase, phenobarbital-inducible form | M13506 | 1637.40% |
| Apolipoprotein C-III gene | J02596 | 1492.85% |
| CYP2D2 | AB008423 | 962.42% |
| Mitochondrial 3-hydroxy-3-methylglutaryl-CoA synthase | M33648 | 918.96% |
| Canalicular multispecific organic anion transporter(cMOAT) | D86086 | 918.96% |
| Protein C | X64336 | 918.96% |
| P-glycoprotein | L15079 | 877.46% |
| Alpha-fetoprotein (AFP) | X02361 | 712.72% |
| Cathechol-O-methyltransferase | M93257 | 565.69% |
| Vitronectin | U44845 | 649.80% |
| Thrombin | M81397 | 515.75% |
| CYP2D3 | AB008424 | 438.73% |
| Glutathione S-transferase (GST) Y(b) subunit | X04229 | 438.73% |
| Ceruloplasmin | L33869 | 409.35% |
| Ornithine carbamoyltransferase | K03041 | 381.94% |
| Fibrinogen B beta chain | U05675 | 364.69% |
| Tyrosine aminotransferase | X02741 | 340.27% |
| Alpha-fibrinogen | X86561 | 340.27% |
| Fibronectin gene, exons 2b and 3a | M28259 | 317.48% |
| Sodium/bile acid cotransporter | M77479 | 317.48% |
| Fetuin | X63446 | 317.48% |
| Apolipoprotein B (apoB) gene | U53873 | 296.22% |
| Cytochrome P450 4F4 (CYP4F4) | U39206 | 289.45% |
| Glucokinase, alternatively spliced GK2 (EC 2.7.1.1) | X53588 | 289.45% |
| Argininosuccinate lyase, complete | D13978 | 289.45% |
| Acyl-CoA synthetase | AB012933 | 270.07% |
| Hereditary hemochromatosis protein homolog (RT1-CAFe) | AF008587 | 257.87% |
| Albumin gene | X76456 | 257.87% |
| Cytochrome P-450 IV A1 (CYP4A1) | M57718 | 257.87% |
| Major acute phase alpha-1 protein (MAP) | K02814 | 251.98% |
| Hemopexin | M62642 | 251.98% |
| Fibrinogen gamma chain | J00735 | 240.61% |
| HMG-CoA reductase | X55286 | 240.61% |
| Signaling Pathways | ||
| Suppressed genes | ||
| Phospholipase A2 | X51529 | 5.97% |
| Type II cAMP-dependent protein kinase regulatory subunit | M12492 | 7.69% |
| Protein kinase C-eta | X68400 | 8.25% |
| Cyclooxygenase isoform COX-2 | S67722 | 11.40% |
| cAMP phosphodiesterase, 3′ end | J04563 | 11.40% |
| Phospholipase C-III | M20637 | 13.09% |
| Activin type I receptor-like kinase ALK-5 | S81584 | 13.40% |
| Dual-specificity protein tyrosine phosphatase (rVH6) | U42627 | 15.04% |
| Phospholipase C-1 | M20636 | 32.99% |
| Interleukin-1 beta converting enzyme (IL1BCE) | U14647 | 41.56% |
| Cyclooxygenase 1 | U03388 | 45.59% |
| Increased genes | ||
| LIMK-2a | D31874 | 356.36% |
| Beta subunit of AMP-activated protein kinase | X95577 | 289.45% |
N/A, not available.
The genes affected are grouped into function categories. The gene names are as specified in the Affymetrix annotation. Modifications were made if the gene is known in the literature or from the Unigene database under a more commonly used name. The second column indicates the gene identifier code in the Unigene database. The last column shows the percentile change in gene expression in the treated cultures over that in the control cultures. All data represent the mean of three separate measurements from three separate culture sets. All genes shown were chosen from the list in which the difference of the means between the control and the treated cultures was statistically significant at p < 0.05.
Genes Suppressed by Dexamethasone
Growth Factors, and Related Cytokines and Receptors
Interleukin 6 (IL-6) (2.48% of control) was the most suppressed of the signaling molecules. Many recent studies have shown that IL-6 is a mitogen for bile duct epithelial cells and that it regulates expression of STAT3 at the early stages of liver regeneration. Mice with homozygous deletion of IL-6 gene have altered liver regeneration response (11,61). An-giopoietin-2 (2.60% of control) is involved with angiogenesis in liver and other tissues (58). Neuropilin 1, VEGF, and its receptor Flk-1 are also molecules involved in angiogenesis and all are suppressed by dexamethasone (39). This may be due to the fact that dexamethasone also suppresses the hypoxia-inducible factor (HIF) (11.94% of control), a transcription factor known to be expressed in many cells including hepatocytes (34) involved in coordinate induction of gene expression of many angiogenesis-related growth factors and their receptors. Pancreatitis-associated protein (PAP) (3.05 %) is a member of a family of proteins comprising a group of small secretory proteins, which can function as acute phase reactants, lectins, antiapoptotic factors, or growth factors (8). It is expressed highly in hepatocellular carcinomas. Schwannoma-derived growth factor is also known as amphiregulin (6.7% of control). It is a ligand for the EGF receptor (52). There is no literature for any role of amphiregulin in liver development or regeneration. Of interest, dexamethasone, while suppressing amphiregulin, increases gene expression of another EGF receptor ligand, TGF-α, though only by 57% (Table 1). The chemokine stroma-derived factor (SDF)-1, and its receptor, CXCR-4 (8.84%), have been shown to be essential for the translocation of hemopoietic stem cells from the fetal liver to the bone marrow (64). The receptor frizzled (10.39% of control) is associated with signal transduction via β-catenin, which is involved in growth signaling during liver regeneration (48,49). Previous studies from this laboratory have shown the importance of uPAR (urokinase receptor) (20.31% of control) in generating growth signals at the earliest stages of liver regeneration (44). Work from several laboratories has implicated cyclo-oxygenase-2 (COX-2) (11.40%) as a growth regulator for neoplasms from many endodermal tissues including colon and pancreas (67).
Matrix-Related Proteins and Proteases
Addition of dexamethasone was associated with lack of connective tissue formation in the cultures. The gene expression data correlate very well with this histologic finding. TGF-β1, a cytokine associated with fibrosis and induction of many matrix-related proteins in several tissues (30), was suppressed by dexamethasone (16.49% of control). Suppressed also were the genes for osteopontin (1.13%), macrophage metalloelastase (2.16%), dermatan sulfate proteoglycan (decorin) (2.42%), versican (4.42%), lumican (11.94%), collagen type I (14.69%) and collagen type III (18.51%), and tenascin (30.78%).
Genes Induced by Dexamethasone: Correlation With Hepatocyte Differentiation
Addition of dexamethasone caused increase in size and appearance of histologically mature hepatocytes in the organoid cultures (Fig. 1C). These findings correlate well with the data from gene expression analysis in the dexamethasone-treated cultures. A wide range of enzymes and secretory proteins characteristic of hepatocyte differentiation become induced (Table 1). These include metabolic enzymes characteristic of hepatocytes, such as argininosuccinate synthetase, different species of cytochrome P450 family of proteins, tyrosine aminotransferase, glucokinase, and HMG-CoA reductase. Many secretory proteins made by hepatocytes are also included, such as vitronectin, thrombin, ceruloplasmin, fibrinogen, apolipoprotein C-III, fetuin, hemopexin, α-fetoprotein, etc. The changes seen are consistent with the effects of dexamethasone on hepatocyte-associated transcription factors. HNF4 gene expression increases by 527.8%. All (100%) of hepatocyte nuclei stain positive for HNF4 after addition of dexamethasone (control: 27%). Increases are also seen in expression of HNF3a (400%), C/EBPa (356%), HNF6-β (350%), HNF3-γ (235%), and retinoid X receptor (RXR) (296%). Most of the genes associated with hepatocyte differentiation that are induced by dexamethasone are also controlled by HNF4 and/or C/EBPα (28).
Effects of HGF and EGF
Histologic Effects
Addition of HGF and EGF together to control cultures caused a slight decrease in the rate of cell proliferation (KI-67: control, 24%; HGF + EGF: 16%) and altered the morphology of the cells (Fig. 1C). There was no clear distinction between hepatocytes and biliary epithelium, with most cells having mixed hepatobiliary features, best resembling the “oval” hepatocytes described in rat liver protocols (18). The epithelial cells are interlaced with other cell types with mesenchymal features. HNF4 staining was seen in only 18% of the nuclei.
Gene Expression Patterns Induced by Addition of HGF and EGF Combined
Whereas the gene expression patterns induced by dexamethasone can be easily categorized, the patterns induced by addition of the two tyrosine kinase receptor ligands are more subtle, yet not less dramatic for some of the affected genes. Meaningful changes were seen in expression of growth regulatory molecules, matrix-related proteins, and transcription factors.
Expression of Genes Related to Growth Factors and Signaling Cytokines
Results in this category are shown in Table 2. A variety of genes in this category were suppressed by adding HGF and EGF. Most suppressed was the expression of interleukin 2 and angiopoietin 2. Previous studies have shown expression of angiopoietin 2 in hepatocellular carcinomas and during liver regeneration (13). IL-2, however, is considered to be expressed primarily in lymphoid cells, though a recent article suggested production of IL-2 by hepatocytes (38). Members of the Gro family of proinflammatory cytokines are expressed in many cell types including hepatocytes (59). Profoundly suppressed also was the expression of IGF-1 as well as receptors for FGF-1, parathyroid hormone-like peptide, oxytocin, endothelin, CXC chemokines, VEGF and hyaluronan (motility receptor), and the α-2 adrenergic receptor. Amphiregulin was also suppressed, though not as much as with dexamethasone. TGF-α expression, to the contrary, was increased, more so than with dexamethasone. Prominent increases in gene expression were seen for several genes in this category. IGF BP1, a known immediate early gene whose expression dramatically increases after partial hepatectomy (42), was most prominently induced. A large group of genes composed of ligands and receptors associated with G proteins was also prominently increased. This category included secretin and its receptor, angiotensinogen, olfactory receptors, cannabinoid receptors, etc. There was prominent induction of TGF-β3 and a mild induction of TGF-β1 and 2. There was also marked increase in the expression of Notch. The latter is generally considered to be an inhibitor of terminal differentiation in multiple systems (21,55) and was increased (459.48%). This is meaningful in view of the histologic evidence that addition of HGF and EGF is associated with cells with intermediate hepatobiliary morphologic characteristics analogous to oval cells. Expression of HGF itself was also induced (282%), as wells as expression of HER-2 neu (229%).
TABLE 2.
HGF + EGF EFFECTS ON HEPATIC ORGANOID GENE EXPRESSION PATTERNS
| Gene Name | Gene Number | Gene Expression (% of Control) |
|---|---|---|
| Growth Factors, Receptors, and Signaling Cytokines | ||
| Suppressed genes | ||
| Interleukin 2 | M22899 | 15.04% |
| Angiopoietin-2 | AF030378 | 16.49% |
| Gro | D11445 | 21.27% |
| Fibroblast growth factor receptor 1 | AF000144 | 22.79% |
| IGF-I (insulin-like growth factor I) | X06107 | 22.79% |
| CXC chemokine receptor (CXCR4) | U90610 | 25.00% |
| Fit-IS (Fit-1) | U04319 | 25.58% |
| CINC-2 beta CXC chemokine | D21095 | 26.79% |
| CXC chemokine receptor (CXCR2) gene | U70988 | 28.06% |
| Endothelin | E02223 | 30.08% |
| VEGF receptor-2/FLK-1 | U93306 | 32.23% |
| Prodynorphin (Preproenkephalin B) gene | M10088 | 32.99% |
| Follicle stimulating hormone beta-subunit | M36804 | 34.55% |
| Alpha2-C4 adrenergic receptor | X57659 | 34.55% |
| Placenta growth factor (PlGF) | L40030 | 37.89% |
| PPARAGKg | AB011365 | 39.69% |
| Receptor hyaluronan-mediated motility | U87983 | 40.61% |
| Parathyroid hormone-like peptide (PLP) gene | M34112 | 41.56% |
| Oxytocin receptor (OTR) | U15280 | 41.56% |
| Nonselective-type endothelin receptor | S65355 | 43.53% |
| Amphiregulin (Schwannoma-derived growth factor) | X55183 | 43.53% |
| Interleukin 10 (IL-10) | L02926 | 44.54% |
| Epidermal growth factor precursor | XI2748 | 45.59% |
| OX40 ligand (Ox401) | AF037067 | 42.53% |
| Increased genes | ||
| IGF binding protein-1 (rIGFBP-1) | M58634 | 918.96% |
| Beta-type calcitonin gene-related peptide | M11596 | 680.53% |
| Angiotensinogen, 3′ flank | M12112#3 | 634.96% |
| Secretin receptor | X59132 | 552.77% |
| Alpha-type calcitonin gene-related peptide | M11597 | 552.77% |
| QIL-LD1 olfactory receptor | AF091563 | 540.14% |
| Transforming growth factor-beta 3 (TGF-β3) | U03491 | 540.14% |
| Transforming growth factor-beta 1 (TGF-β1) | X52498 | 123.11% |
| Transforming growth factor-beta 2 (TGF-β2) | M96643 | 135.03% |
| CB1 cannabinoid receptor | X55812 | 515.75% |
| Notch 2 | M93661 | 459.48% |
| Secretin receptor | E04128 | 400.00% |
| LDL-receptor | XI3722 | 390.86% |
| Class I MHC molecule | X67504 | 381.94% |
| Interleukin-1 receptor-related protein | U49066 | 373.21% |
| Transforming growth factor-alpha (TGF-α) | M31076 | 348.22% |
| Growth hormone receptor | S49003 | 340.27% |
| Tenascin | U09401 | 332.50% |
| Chemokine CX3C | AF030358 | 332.50% |
| Interleukin 1 receptor antagonist gene | M63101 | 332.50% |
| Interleukin 5 | X54419 | 332.50% |
| Neuronal nicotinic acetylcholine receptor-related protein | J05231 | 324.90% |
| QLL-TN1 olfactory receptor | AF091562 | 324.90% |
| Kallikrein | M11566 | 324.90% |
| P2Y purinoceptor | U22830 | 310.23% |
| Delta-preprotachykinin | X56306 | 303.14% |
| Interleukin-12 | S82489 | 296.22% |
| Myelin-associated glycoprotein (S-MAG) | X06554 | 289.45% |
| Beta 3-adrenergic receptor | S56481 | 282.84% |
| Hepatocyte growth factor (HGF) | D90102 | 282.84% |
| Transferrin | D38380 | 282.84% |
| Preprorelaxin | A16585 | 263.90% |
| Neu differentiation factor | U02316 | 251.98% |
| Thyroid stimulating hormone receptor | M34842 | 246.23% |
| Retinoic acid receptor alpha 2 isoform (RAR) | U15211 | 240.61% |
| Putative pheromone receptor (Go-VN4) | AF016181 | 229.74% |
| HER-2 neu oncogene | X03362 | 229.74% |
| Vasopressin | M64785 | 224.49% |
| Luteinizing hormone receptor | M61211 | 219.36% |
| Thrombopoietin | E12181 | 219.36% |
| Transforming growth factor-beta 3 | U03491 | 219.36% |
| Purinoreceptor (P2X2) | AF020757 | 214.35% |
| Pancreatitis-associated protein | M98049 | 214.35% |
| Transcription Factors | ||
| Suppressed genes | ||
| APEG-1 | U57097 | 15.39% |
| CCAAT binding transcription factor-B subunit (CBF-A11) | M60617 | 33.76% |
| PPAR-γ | AB011365 | 39.69% |
| Distal-less 3 (Dlx-3) homeobox protein | D31734 | 41.56% |
| fos-related antigen (Fra-1) | M19651 | 41.56% |
| c-Fos | X06769 | 43.53% |
| Gas-5 growth arrest homologue | U77829 | 43.53% |
| Increased genes | ||
| Hepatocyte nuclear factor 6 beta | Y14933 | 620.46% |
| Cyclin Dl | X75207 | 552.77% |
| Hepatocyte nuclear factor 4 | D10554 | 448.98% |
| Zinc finger protein AT-BP1 | X54249 | 282.84% |
| c-Jun | X17163 | 282.84% |
| DEAF-1 related transcriptional regulator (NUDR) | AF055884 | 251.98% |
| Retinoic acid receptor alpha 2 isoform (RAR) | U15211 | 240.61% |
| bHLH protein | D82868 | 224.49% |
| Variant hepatic nuclear factor 1 (vHNF1) | X56546 | 224.49% |
| Zinc finger transcription factor REST | AF037199 | 317.48% |
| Zinc finger protein AT-BP1 | X54249 | 282.84% |
| Zinc finger protein AT-BP2 | X54250 | 276.38% |
| Matrix-Related Proteins and Proteases | ||
| Suppressed genes | ||
| Osteopontin | M14656 | 26.18% |
| Neutrophil collagenase | AJ007288 | 30.08% |
| Embigin protein | AJ009698 | 35.36% |
| Neuroglycan C precursor | U33553 | 37.89% |
| Platelet-endothelial cell adhesion molecule-1/CD31 | U77697 | 38.78% |
| Cell-binding bone sialoprotein | J04215 | 38.78% |
| 190 kDa ankyrin isoform | AF069525 | 39.69% |
| Receptor hyaluronan-mediated motility | U87983 | 40.61% |
| Vascular cell adhesion molecule-1 | M84488 | 40.61% |
| Neuroglycan C precursor | U33553 | 37.89% |
| Increased genes | ||
| SHPS-1 | D85183 | 857.42% |
| Integrin beta 4 subunit | U60096 | 857.42% |
| N-cadherin | AF097593 | 540.14% |
| Phosphacan | U04998 | 503.97% |
| Plasminogen | M62832 | 400.00% |
| Tenascin | U09401 | 332.50% |
| K-cadherin | D25290 | 317.48% |
| Connexin 40 (GJA5) | AF022136 | 263.90% |
| Neurexin III-alpha gene | L14851 | 257.87% |
| 140-kDa NCAM polypeptide | X06564 | 204.67% |
| Pax-6 | S74393 | 310.23% |
| Hepatocyte Differentiation | ||
| Suppressed genes | ||
| Liver glutathione S-transferase Ya subunit | K00136 | 7.69% |
| Lipophilin | M25888 | 17.27% |
| Cytochrome P-450 MC gene | E00778 | 21.76% |
| von Willebrand factor | U50044 | 25.58% |
| Cytochrome P450 (CYP1B1) | U09540 | 27.42% |
| Cytochrome P-450-lip | D11354 | 27.42% |
| Low molecular weight fatty acid binding protein | J02773 | 31.50% |
| Liver fatty acid binding protein | V01235 | 32.23% |
| Lactate dehydrogenase-C (LDH-C) | U07177 | 32.23% |
| Zn-alpha-2-glycoprotein | X75309 | 32.99% |
| Cytochrome P450 (CYP1B1) | U09540 | 35.36% |
| Hydroxysteroid sulfotransferase | X63410 | 36.18% |
| Intestinal fatty acid binding protein (FABP) | K01180 | 36.18% |
| Beta-fibrinogen | M35602 | 37.03% |
| Beta-alanine oxoglutarate aminotransferase | D7839 | 39.69% |
| Cationic amino acid transporter-1 (CAT-1) | U70476 | 39.69% |
| Glutathione S-transferase Ycl subunit | S72505 | 40.61% |
| Salivary proline-rich protein (RP4) gene | M64791 | 40.61% |
| Delta 4-3-ketosteroid 5 beta-reductase | S80431 | 41.56% |
| Fructose 6-phosphate,2-kinase | S67900 | 43.53% |
| Increased genes | ||
| Alpha-fetoprotein (AFP) | X02361 | 1269.92% |
| Cytokeratin 21 | M63665 | 818.70% |
| SH3-containing protein p4015 | AF026505 | 781.73% |
| Cytokeratin 19 | X81449 | 712.72% |
| Beta-2 glycoprotein I | X15551 | 592.44% |
| Dipeptidyl peptidase IV (DPP IV) | J04591 | 481.21% |
| Inducible nitric oxide synthase (iNOS) | D44591 | 481.21% |
| Hepatic squalene synthetase | M95591 | 428.71% |
| Cytochrome P450 arachidonic acid epoxygenase | U04733 | 418.92% |
| Plasminogen | M62832 | 400.00% |
| Liver glycogen phosphorylase | M59460#2 | 381.94% |
| L-type pyruvate kinase | X05684 | 381.94% |
| UDP-glucuronosyltransferase | S70364 | 348.22% |
| Mitochondrial 3-hydroxy-3-methylglutaryl-CoA synthase | M33648 | 340.27% |
| Cytokeratin-8 | S76054 | 332.50% |
| Serine pyruvate aminotransferase | X6357 | 317.48% |
| Pyruvate carboxylase | U32314 | 317.48% |
| Apha-2-macroglobulin gene | M22670 | 317.48% |
| Organic cation transporter OCT1A | U76379 | 303.14% |
| Phosphorylase kinase gamma-subunit | X07320 | 276.38% |
| Peroxisome assembly factor-2 | D63673 | 276.38% |
| Intestinal lactose-binding lectin (L-36) | M73553 | 270.07% |
| 17-beta hydroxysteroid dehydrogenase type 2 | X91234 | 263.90% |
| Type I 5 alpha-reductase {longer transcript} | S81448 | 263.90% |
| Apolipoprotein A-IV | M00002 | 257.87% |
| Cytochrome P-450 IID5 | J02869 | 257.87% |
| Apolipoprotein B (apoB) | M14952 | 246.23% |
| Annexin-V | AF051895 | 246.23% |
| Tissue factor protein | U07619 | 240.61% |
| Serine protease inhibitor 2.4 | X69834 | 240.61% |
| Protein C | X64336 | 235.11% |
| High-affinity carnitine transporter | AB017260 | 235.11% |
| Keratin 14 | D63774 | 229.74% |
| Beta-4Af-acetylgalactosaminyltransferase | D17809 | 229.74% |
| Hepatic squalene synthetase | M95591 | 224.49% |
| Alpha-1 inhibitor III | J03524 | 219.36% |
| Squalene epoxidase | D37920 | 209.46% |
| Signaling Pathways | ||
| Suppressed genes | ||
| Platelet phospholipase A2 | X51529 | 7.18% |
| G protein gamma-5 subunit | M95780 | 14.36% |
| Type II cAMP-dependent protein kinase regulatory subunit | M12492#l | 21.27% |
| 12-Lipoxygenase | L06040 | 25.58% |
| Intracellular calcium-binding protein (MRP14) | L18948 | 25.58% |
| Putative G protein-coupled receptor (CNL3) | AF064706 | 26.18% |
| Phospholipase C-l | M20636 | 30.08% |
| 12-Lipoxygenase | S69383 | 30.78% |
| JUN-Kinase (stress activated protein kinase) gamma | L27129 | 30.78% |
| Clathrin light chain (LCA1) | M15882 | 32.99% |
| Phospholipase C-III | M20637 | 33.76% |
| Inositol polyphosphate 4-phosphatase | U26397 | 36.18% |
| Guanyl cyclase (GC-S-beta-2) | M57507 | 37.89% |
| Endothelial nitric oxide synthase (NOSIII) | AF085195 | 43.53% |
| Calpain isoform Lp85 | AF052540 | 43.53% |
| Mitogenic regulation SSeCKS (322) gene | U23146 | 38.78% |
| Increased genes | ||
| SHPS-1 | D85183 | 857.42% |
| Kinesin-related protein KRP4 (KRP4) | AF035953 | 680.53% |
| Rabphilin-3a related protein | AF022774 | 649.80% |
| Protein kinase C delta-bindig protein | D85435 | 515.75% |
| Inducible nitric oxide synthase (iNOS) | D44591 | 481.21% |
| Serine/threonine kinase (gamma-PAK) | U35345 | 470.22% |
| cAMP-dependent protein kinase inhibitor protein | M64092 | 470.22% |
| Bta subunit of AMP-activated protein kinase | X95577 | 459.48% |
| Ca2+-dependent activator protein (CAPS) | U16802 | 390.86% |
| G-protein coupled receptor pH218 | U10699 | 364.69% |
| ROK-alpha | U38481 | 348.22% |
| LIMK-2a | D31874 | 340.27% |
| Stanniocalcin (rSTC) | U62667 | 310.23% |
| Regucalcin | D67071 | 303.14% |
| Dynein-like protein 4 | D26495 | 282.84% |
| Beta 3-adrenergic receptor | S56481 | 282.84% |
| Microtubule associated protein (MAP2c) | X17682 | 276.38% |
| Na,K-ATPase alpha-2 subunit | M28648 | 270.07% |
| Cyclin dependent kinase 2-alpha | D28753 | 263.90% |
| MAP kinase kinase kinase 1 (MEKK1) | U48596 | 257.87% |
| Ezrin p81 | X67788 | 257.87% |
| Agrin | M64780 | 246.23% |
| MAP kinase kinase kinase 1 (MEKK1) | U48596 | 246.23% |
| Retinoblastoma protein (Rb) | D25233 | 240.61% |
| EH domain binding protein epsin | AF018261 | 229.74% |
| Guanine nucleotide-binding protein (Gz-alpha) | U77483 | 219.36% |
| SNAP-25A | AB003991 | 214.35% |
| Regulator of G-protein signaling 12 (RGS12) | AF035151 | 214.35% |
| Guanylate cyclase | M26896 | 209.46% |
| Protein tyrosine phosphatase | L19933 | 204.67% |
| Nuclear serine/threonine protein kinase | AF036959 | 204.67% |
| CNS Related Genes | ||
| Suppressed genes | ||
| Glial fibrillary acidic protein alpha (GFAP) gene | AF028784 | 27.42% |
| Transcriptional repressor of myelin-specific genes (SCIP) | M72711 | 29.39% |
| Prodynorphin (Preproenkephalin B) gene | Ml 0088 | 32.99% |
| Neuroglycan C precursor | U33553 | 37.89% |
| Neuritin | U88958 | 38.78% |
| Increased genes | ||
| Synuclein | X86789 | 664.99% |
| CB1 cannabinoid receptor | X55812 | 515.75% |
| Neurofibromatosis protein type I | M82824 | 390.86% |
| Myelin protein MVP17 | U31367 | 381.94% |
| QLL-TN1 olfactory receptor | AF091562 | 324.90% |
| Pax-6 [rats, small eye rSey, Partial Mutant, 1292 nt] | S74393 | 310.23% |
| Brain serine protease bsp2 | AJ005642 | 303.14% |
| Myelin-associated glycoprotein (S-MAG) | X06554 | 289.45% |
| Neuroendocrine-specific protein (RESP18) | L25633 | 289.45% |
| BMAL1b | AB012600 | 289.45% |
| Homer-1c | AF093268 | 282.84% |
| Blue cone opsin-like pigment | U63972 | 257.87% |
| Synaptotagmin XI | AF000423 | 257.87% |
| Neurexin III-alpha gene | L14851 | 257.87% |
| Neuron-specific protein PEP-19 | M24852 | 240.61% |
| Mint2 | AF029107 | 229.74% |
| Putative pheromone receptor (Go-VN4) | AF016181 | 229.74% |
| PIT-1-beta | L01507 | 229.74% |
| Neurexin I-beta | M96375 | 229.74% |
| Synapse associated protein 25A | AB003991 | 214.35% |
| Synuclein SYN2 (alternatively spliced) | S73008 | 209.46% |
| Synapse-associated protein 102 | U50147 | 204.67% |
| NCAM polypeptide | X06564 | 204.67% |
N/A, not available.
The genes affected are grouped into function categories. The gene names are as specified in the Affymetrix annotation. Modifications were made if the gene is known in the literature or from the Unigene database under a more commonly used name. The second column indicates the gene identifier code in the Unigene database. The last column shows the percentile change in gene expression in the treated cultures over that in the control cultures. All data represent the mean of three separate measurements from three separate culture sets. All genes shown were chosen from the list in which the difference of the means between the control and the treated cultures was statistically significant at p < 0.05.
Expression of Genes Associated With Hepatic Cell Differentiation
The observed patterns of increase in specific genes correlate well with the observed histologic changes. Correlating with the fact that HGF and EGF induce appearance of cells resembling oval cells, most prominently increased gene expression was that of α-fetoprotein (AFP), a well-known marker of oval cells from whole animal models (66). AFP increased by 1269%. Oval cells are also known for expression of several biliary markers. This also correlates with the marked increase in cytokeratin 19 (592%) and DPP IV (dipeptidyl peptidase IV) (481%). Also noted was an increase in arachidonic acid epoxygenase, correlating with observed increase in prostaglandins induced by HGF in several systems (77). Increases were also seen in expression of plasminogen (400%) and iNOS (481%). There was a surprising increase in genes associated with the central nervous system. Many such genes were noted (listed in Table 2). Expression of some of these factors was so far only seen in CNS development [e.g., transcription factors Pax-6, associated with induction of the eye structures (22), and Pit-1, associated with pituitary development (54)]. Some of these proteins are associated with cell structure [e.g., synuclein (5)] or with peripheral nerves (myelin, neurofibromatosis protein). Other proteins are associated with synaptic formation, such as homer-1c (3) and neurexin III (60). There is emerging literature about convergent gene expression patterns between stellate cells of the liver and astrocytes (9). The observed changes in these cultures may reflect enhanced proliferation and/or differentiation of stellate cells induced by HGF and EGF. This would correlate with the observed increase in connective tissue induced by addition of HGF and EGF, including enhanced expression of collagen type IV and TGF-β1 shown in our previous publication describing this system (46). Increased numbers of stellate cells would also correlate with the enhanced expression of TGF-β and HGF, known to be produced by stellate cells of the liver (68,69). On the other hand, expression of glial fibrillary acidic protein, known common marker of stellate cells and astrocytes, was suppressed (27%). The observed patterns may also reflect enhanced production of peripheral nerve elements related to peripheral ganglia. This may not be the case as expression of synuclein was localized on the hepatobiliary cells, not connective tissue cells (data not shown). The expression of several genes decreased after addition of HGF plus EGF. No clear pattern appears to emerge, other than the fact that some of the genes express proteins involved in the metabolism of fatty acids (see Table 2).
Transcription Factors
Expression of several transcription factors was altered after addition of HGF plus EGF. Notable was the dramatic increase in HNF6-β (620%) and HNF4 (448%) as well as cyclin D1 (553%). The data from histologic analysis point to the fact that HGF and EGF are needed for the formation of the biliary monolayer (46). Recent studies have shown that HNF6 is associated with formation of the biliary epithelium (10). The increased expression of the gene under HGF plus EGF correlates well with the histologic observation from our system about the regulation of biliary epithelium appearance under these two growth factors. Also of interest is the enhanced expression of HNF4. Even though HNF4 expression is almost as enhanced as with dexamethasone, the increase in hepatocyte-associated differentiation markers is not seen with HGF and EGF, suggesting that the effects of the corticosteroid receptor are essential for achieving complete maturation of hepatocytes. In addition, enhanced expression of several other transcription factors (cyclin D1, AT-BP1, AT-BP2, REST, cJun, and DEAF1) may interfere with HNF4-mediated control of hepatocyte gene expression.
Gene Expression Patterns Induced by HGF or EGF Added Alone
Either HGF or EGF added alone induced the characteristic histologic changes seen by the addition of the two combined. This is in agreement with our previously published results on the effects of each of the two growth factors on induction of collagen type IV and TGF-β1 (46). In view of this, it is not surprising that remarkably few differences in gene expression patterns were noted between HGF and EGF (data not shown). All genes were affected in the same direction (up- or downregulation) with differences seen being only a matter of degree (e.g., epoxide hydrolase was induced sevenfold over control by HGF but only 1.5-fold by EGF). Similar changes were also seen in a few cytochrome P450-related genes. All suppressed genes did not show significant differences between the two growth factors or from the combined addition of HGF plus EGF.
Combined Addition of Dexamethasone, HGF, and EGF
The addition of dexamethasone and HGF + EGF brings out the mature histologic phenotype of the organoid cultures, with clear distinction between biliary epithelium and hepatocytes (46). The histology is quite different compared with that seen with addition of either dexamethasone or combined HGF + EGF alone. The histologic picture is shown in Figure 1G. The maturity of the differentiated phenotype is underscored by the pattern of distribution of HNF4, shown in Figure 1H. In the absence of dexamethasone, a variable percent of the immature epithelial cells stained positive for HNF4 in the nucleus. In cultures exposed to dexamethasone only, all hepatocytes contained HNF4 but the biliary epithelium was absent. In cultures exposed to dexamethasone, HGF, and EGF, HNF4 was seen in the nuclei of the hepatocytes only, whereas the nuclei of biliary epithelial cells did not stain positive for HNF4.
Despite the fundamental differences in histology, the gene expression patterns in dexamethasone and HGF + EGF appear as a compromise between dexamethasone alone and HGF + EGF alone (data not shown). Genes induced by both dexamethasone alone and HGF + EGF alone are induced more by the combination. Most other gene expression levels are average between the two conditions. There is a small set of genes, however, that is uniquely induced by the combination of dexamethasone and HGF + EGF than either dexamethasone or HGF + EGF alone. The glutamate receptor shown as the most elevated gene has already been described as highly expressed in liver and in central nervous system structures (36). However, the role of this receptor in the liver is not understood. VEGF-D is the member of the VEGF family produced predominately by mesenchymal cells and has effects on adjacent endothelial cells. Its expression during embryonic development is associated with organ patterning in lung and other tissues (24). There is a large literature on IGF-II expression during fetal development in the liver and expression in neoplasms (57). Adult liver expresses predominantly IGF-I. The CC chemokine receptor has been found in the brain and in lymphoid tissues but is also expressed in hepatocytes (51). Angiotensin receptor has been known to be present in the liver. Angiotensin itself has co-mitogenic properties with EGF in rat hepatocytes (29). Neuromedin receptor has not been described in liver, though the ligand has mitogenic effects on rat hepatocytes (26). There is expression of both nerve growth factor and its low-affinity receptor in the liver. NGF is produced by hepatocellular carcinomas (35) and is expressed as an early gene after liver reperfusion injury (53). The decrease in expression of c-kit is consistent with low expression of this receptor in the liver and its upregulation during induction of oval cell formation in suppressed hepatic regeneration (20). RXR is expressed in the adult rat liver and there is an extensive literature on its functions.
DISCUSSION
The literature on signals governing the formation of hepatic tissue during embryogenesis and hepatic regeneration is quite extensive. Most of it is characterized by emphasis on unique signals and gene products, with specific single stimuli triggering a large response with linear downstream signaling cascades, culminating in mitogenesis, altered differentiation, etc. (45). The studies presented here show a complex picture of global alterations in gene expression induced by dexamethasone, HGF, and EGF, during the process of formation of organized histology in cultures derived from hepatic cells. Such complex alterations affecting global patterns of gene expression have been recently described for liver neoplasia (40) and early stages of liver regeneration (42). The histology induced by each of the specific signals (dexamethasone, HGF, and EGF and combination of the three) is quite different. The differences in patterns of gene expression correlated with histology allow for dissection of specific gene pathways associated with different aspects of hepatic histogenesis. Some of the effects observed (e.g., induction of HNF4 by dexamethasone) were only recently described and not fully understood (4). Others (e.g., induction of α-fetoprotein by HGF and EGF) constitute novel discoveries of linkage between established biomarkers (AFP) and well-studied hepatic growth factors (HGF + EGF). The results obtained allow us to understand how the specific signaling molecules of the study (dexamethasone, HGF, and EGF) contribute to the observed effects on the histology of the cultures. Because currently available genetic mouse models do not reveal the impact of these molecules on hepatic embryogenesis, and because it is impossible to remove the effect of the substances under study from the mouse embryo without genetic manipulations, the studies offer insights as to how the specific signals contribute to the formation of the hepatic tissue. Below, we will attempt to correlate the observed gene expression changes with the observed histology.
Effects of Dexamethasone
Inhibition of Growth of Primitive (Control Culture) Hepatocytes
The effects of corticosteroids on hepatocyte DNA synthesis have been described in several publications. This has been shown both in cell culture and in whole animal regenerating liver models (50,75). Dexamethasone inhibits the proliferative response after two thirds partial hepatectomy and liver mass is restored by hepatocyte hypertrophy. The mechanisms leading to this effect are not clear. Our results show effects on multiple families of genes associated with cell growth in general. Surprisingly, none of these genes are known to be mitogenic signaling molecules for the hepatocytes (pancreatitis-associated protein, endothelin receptor, CXC chemokine receptor, COX-2), but they have all been associated with regulation of growth in liver or other organ systems. IL-6 itself, the most suppressed gene in that category, has been associated with optimizing STAT3 activation during liver regeneration (11) and with mitogenic effects on biliary epithelial cells. Given the fact that the cells in the control cultures are immature hepatocytes, they may respond differently to IL-6 than the mature cells and have a hybrid hepatocyte and biliary response. If IL-6 is a direct mitogen for these cells (as with mature biliary epithelium), then the finding of maximal IL-6 suppression may explain in part the cessation of growth. Many other molecules suppressed by dexamethasone are also involved in liver regeneration, such as uPAR (43), FGF receptor 1 (32), etc. Of interest, one of the ligands of the mitogenic receptor EGFR (amphiregulin) is suppressed whereas another one (TGF-α) is increased. This apparently paradoxical situation suggests different effects of these ligands on the EGF receptor, or, alternatively, that the EGF receptor at that stage of differentiation does not play a mitogenic role. In fact, EGFR expression was increased by dexamethasone while growth was suppressed. The results point out that dexamethasone suppresses multiple parallel growth-related pathways in a global manner. Given the important role that many of the genes suppressed by dexamethasone play as growth regulators in liver and other organs, it is highly likely that the growth-suppressing effects of dexamethasone are mediated by suppression of these genes. Independent immunohistochemical evidence for the effects of dexamethasone on some of these genes is shown in Figure 2.
Figure 2.
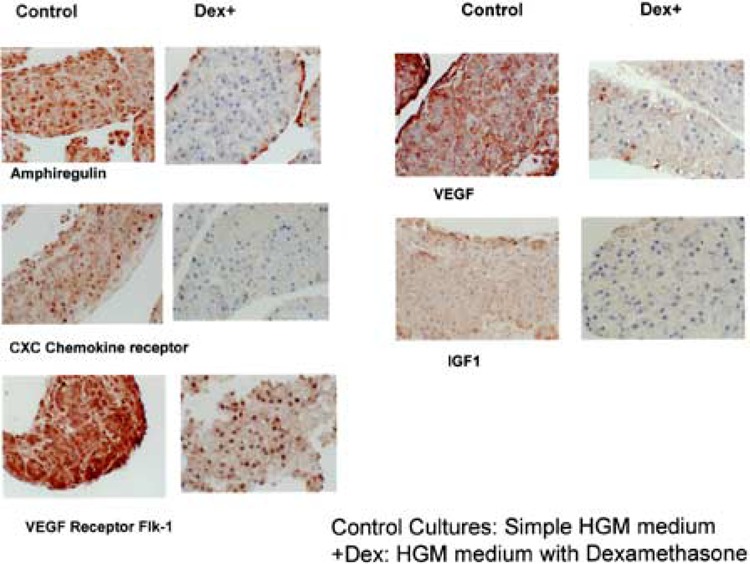
Immunohistochemistry for specific proteins from the list of genes suppressed by dexamethasone. Original magnifications: 400×.
Dexamethasone Inhibits Formation of Non-Hepatocyte-Derived Tissue Components
The dexamethasone-treated cultures have no evidence of connective tissue or growth of endothelial cells (Fig. 1C). Genetic deletion of the corticosteroid receptor in mice reveals no abnormalities in liver histology. Neonate mice die from pulmonary hemorrhage (33). This suggests that in the absence of glucocorticoid receptor, other receptors also bound by corticosteroids [e.g., PXR (37)] may play a compensating role in terms of liver development. In our system, however, the contributing effects of dexamethasone are revealed because the ligand is fully eliminated. Dexamethasone globally suppressed both the main form of VEGF and the mitogenic receptor Flk1. It also suppressed neuropilin [a co-receptor for the VEGF receptors (41)]. Most of these genes are dependent on positive inductive effects by the hypoxia-inducible factor, also suppressed by dexamethasone. The effects of dexamethasone on VEGF have been described sporadically for kidney (25) and keratinocytes (23), whereas its effects on liver tissue were not known. The global manner of suppression of angiogenesis is further illustrated by suppression of the gene for vascular cell adhesion molecule 1, whose expression has not been linked to the hypoxia-inducible factor. The lack of connective tissue also correlates with the gene expression patterns. TGF-β1, associated with formation of connective tissue and/or fibrosis in many systems including liver, is suppressed by dexamethasone. Several previous publications have described that dexamethasone interferes with the effects of TGF-β1. The inhibition of expression of TGF-β1 by dexamethasone, however, has not been previously described except in skin wound healing models (19). Many other connective tissue-related genes were also suppressed, however, and it is not clear whether the effects are mediated by suppression of TGF or directly, via modulation of the expression of the specific genes. Such genes included osteopontin (suppressed to 1.13% of control!), dermatan sulfate proteoglycan, versican, lumican, decorin, collagens type I and III, tenascin, fibronectin-1 osteonectin, etc. There was an increase, however, for fibronectin-2 and brevican. The increase in vitronectin was expected because for hepatocytes vitronectin is a secreted protein and differentiation marker.
Dexamethasone Induces Phenotypic Maturation of Hepatocytes
Induction of differentiation of the primitive hepatocytes to mature cells is apparent by simple histologic examination. Given the often observed association between differentiation and inhibition of growth, this is not surprising. Multiple publications from early literature on hepatocyte cultures document individual gene inductions by dexamethasone. The global effects of dexamethasone on hepatocyte maturation, however, observed in this system, have not been previously described, except for a recent publication pointing out the acquisition of the hepatocyte phenotype by pancreatic cell lines after exposure to dexamethasone (72). Key to this global effect of dexamethasone on hepatocyte maturation must be the combined induction of HNF4 (527% increase) and C/EBPa (356%). HNF4, originally described by Darnell and colleagues (70), is associated with expression of most of the genes associated with hepatocyte differentiation. It appears very early in embryogenesis (15). The mechanisms regulating expression of HNF4 are not clearly understood. Recently, a glucocorticoid-responsive enhancer element 6 kb upstream of the mouse HNF4 promoter was described. Many response elements to other transcription factors were also found in the same region (4). Other than that reference, there is no information relating expression of HNF4 to corticoids. In addition to HNF4, there was also induction of other liver-enriched transcription factors such as HNF3-P and -y and HNF6-P, as well retinoid X receptor (RXR). Striking also was the induction of C/EBPa, another transcription factor associated with expression of most of the hepatocyte-associated genes. Numerous studies have connected this transcription factor alone or as a ratio between C/EBPa top, as controlling hepatocyte differentiation (71). Studies from this laboratory have shown that decrease in C/EBPa is associated with dramatic decrease in differentiation in proliferating hepatocytes in monolayer culture and that matrix addition restored differentiation of hepatocytes along with reappearance of C/EBPa and increase of HNF4 in the nucleus (7.) Previous studies have also shown that dexamethasone induces enhanced expression of C/EBPa in hepatoma cells (12) and adipocytes (27). The combined induction of HNF4 and C/EBPa by dexamethasone is a powerful differentiation signal for restoration of hepatocyte differentiation.
Effects of HGF + EGF in Hepatic Tissue Formation
The role of these growth factors in hepatic tissue development has remained enigmatic. Studies with mice bearing homozygous deletion mutants for HGF (62,74) or its receptor, c-Met (14), have shown that these mutations are lethal for the embryo. Abnormalities in placental development and liver development have been cited as the cause. Yet the cited references do not provide any detail as to the nature of the hepatic abnormalities or whether these changes are secondary to the abnormalities in placental development. Histologic descriptions of the fetal livers in these strains of mice describe only smaller than normal hepatocytes. There is no reference to the hepatic histology at the time of the embryonic death. Mice with homozygous deletions for HGF were rescued by direct (in the embryo) HGF injections (73). They died shortly after birth due to abnormalities of formation of the muscle of the diaphragm. Mice with homozygous deletions of the EGF receptor that survive birth have no hepatic abnormalities (65). Even though EGF receptor is present ubiquitously in most epithelial cells, it is felt that the effects of the absence of the EGF receptor are well compensated by other receptors with overlapping function such as Her2, Neu, etc. Thus, studies with “knockout” mice cannot be used to meaningfully investigate the effects of either HGF or EGF on hepatic tissue formation. Our studies with organoid cultures show that HGF and EGF are essential in three endpoints of hepatic histology.
Formation of Connective Tissue and Stromal Elements
We showed in our previous study with this system that HGF and EGF, alone or together, induce expression of the gene for collagen type IV, probably through TGF-β1. The current studies show that HGF + EGF caused an increase in all TGF-β isoforms (1, 2, and 3). Each of these TGF-β isoforms is expressed in different tissues and they have been associated with mesenchymal development in most organs (56). Mice with homozygous deletions for the smad family of proteins (TGF-β signal transduction pathway) have abnormalities in hepatic development (76). In addition to their effects on induction of TGF-β family members, HGF + EGF cause an increase in gene expression in many genes associated in the liver with stellate cells. Many of these genes are also found in brain astrocytes (see below). HGF gene expression itself, a product of stellate cells, also increases. These findings suggest that HGF + EGF, directly or indirectly, increase the numbers and/or enhance the functions of the stellate cells, which are known to be the source for most of the connective tissue proteins in hepatic tissue. HGF and/or EGF appear to have a regulatory function in stellate cell maturation and gene expression, thus affecting formation of the connective tissue seen in these cultures.
Appearance of Cells With Mixed (Hepatobiliary, “Oval Cell”) Phenotype
The histology of the cultures demonstrates that the epithelial cells do not have mature features of either hepatocytes or biliary epithelium. However, cytokeratin 19 is expressed on the surface. The cells, morphologically, are most similar in properties to the “oval cells,” with mixed hepatocytic and biliary differentiation, described in the rodent carcinogenesis models (6). α-Fetoprotein (AFP) is used as the typical marker for oval cells (6). AFP was very highly induced in the HGF + EGF cultures (13-fold induction!). There was also increase in expression of Notch (4.6-fold increase). As mentioned above, enhanced expression of Notch is typically associated with inhibition of terminal differentiation in most systems. This finding would correlate with the observed mixed hepatobiliary phenotype, seen in the HGF + EGF cultures.
Formation of the Biliary Epithelium
We have shown in previous studies that HGF induced a ductular phenotype in hepatocytes maintained in collagen gels (7). Other studies have shown that HGF is a mitogen for biliary epithelium (31). In our studies we found that biliary epithelium is derived primarily from phenotypic transformation of the hepatocytes (47). In embryology, biliary epithelium arises from phenotypic transformation of the hepatoblasts abutting the portal nodes, rich in collagen 1 protein. There has been no demonstrated role for any growth factors in this process. In our previous studies with organoid cultures, we showed that in the absence of HGF and EGF there is no superficial expression of cytokeratin 19, a hallmark of biliary differentiation. In these studies we find that in addition to cytokeratin 19, other markers of biliary epithelium are also induced in the HGF + EGF cultures, such as dipeptidyl peptidase IV (DPP IV), cytokeratin 8, and keratin 14. Of interest, HGF + EGF also caused a 6.2-fold increase in expression of HNF6-β, a transcription factor already associated with formation of the biliary system in mice (10). In terms of formation of the biliary epithelium, however, HGF + EGF alone are not sufficient. Dexamethasone, added to HGF + EGF, induces the final maturation of the hepatocytic and biliary lineage and was associated with the appearance of both hepatocytes and biliary epithelial cells, as well as the selective expression of HNF4 on the nucleus of the hepatocytes. It should be noted that dexamethasone as well as HGF + EGF independently induce HNF6-P (see Tables 1 and 2). The histology induced by combined addition of dexamethasone and HGF + E GF suggests that transcription factors and gene expression patterns induced or activated by dexamethasone and HGF + EGF are required for the mature biliary phenotype to emerge. Notch gene expression, induced 4.6-fold in the HGF + EGF cultures, decreases to 3.6fold induction when dexamethasone is added to HGF + EGF. It is not clear, however, whether this small decrease would be sufficient to account for the observed marked separation of the differentiated phenotype between hepatocytes and biliary epithelium in the combined [Dex + HGF + EGF] cultures.
Expression of Genes Associated With the Central Nervous System
A large array of genes commonly associated with cells of the central nervous system was found induced by addition of HGF + EGF (see Results, above). The meaning of this is not clear. Some of these genes [e.g., synuclein (6.6-fold increase)] are not found in adult liver (1). Others, such as Pax-6, known as the eye transcription factor, are also expressed in pancreatic islets and have been found in models of trans-differentiation of hepatic progenitor cells into pancreatic islet cells (78). Most of the other genes from this group found expressed have not been described in liver. On the other hand, many recent studies have demonstrated that stellate cells of the liver express many proteins found in brain astrocytes. The total number of the proteins common to both stellate cells and astrocytes has not been fully tabulated and it is conceivable that the unexpected gene expression pattern of CNS genes in liver reflects positive trophic effects of HGF and EGF on stellate cell development. Other literature has also described neurotrophic effects of HGF, during brain development and on motor neurons of the spinal cord (16). The CNS gene expression pattern seen may reflect neurotrophic effects of HGF in susceptible cells derived from the liver, under the culture conditions. It should be emphasized that no cells with features of neuronal or glial cell type are seen in these cultures under any conditions.
Overall, the results demonstrate that hepatic histology that incorporates all the mature cells seen in liver is tightly regulated in part by corticosteroids and the receptor tyrosine kinase ligands HGF and EGF. These cytokines have been shown to play a role in liver regeneration as well. The model allows for other cytokines to be similarly investigated and derive information on the mechanisms controlling formation of hepatic tissue.
ACKNOWLEDGMENTS
This work was supported by NIH grants CA30241 and CA35373 (P.I. GKM). Dr. Michalopoulos is a founding member, consultant and stockholder of Kytaron, Inc.
REFERENCES
- 1. Akopian A. N.; Wood J. N. Peripheral nervous system-specific genes identified by subtractive cDNA cloning. J. Biol. Chem. 270(36):21264–21270; 1995. [DOI] [PubMed] [Google Scholar]
- 2. Alison M.; Golding M.; Lalani E. N.; Nagy P.; Thorgeirsson S.; Sarraf C. Wholesale hepatocytic differentiation in the rat from ductular oval cells, the progeny of biliary stem cells. J. Hepatol. 26(2):343–352; 1997. [DOI] [PubMed] [Google Scholar]
- 3. Ango F.; Pin J. P.; Tu J. C.; Xiao B.; Worley P. F.; Bockaert J.; Fagni L. Dendritic and axonal targeting of type 5 metabotropic glutamate receptor is regulated by homer1 proteins and neuronal excitation. J. Neurosci. 20(23):8710–8716; 2000. [DOI] [PMC free article] [PubMed] [Google Scholar]
- 4. Bailly A.; Torres-Padilla M. E.; Tinel A. P.; Weiss M. C. An enhancer element 6 kb upstream of the mouse HNF4alpha1 promoter is activated by glucocorticoids and liver-enriched transcription factors. Nucleic Acids Res. 29(17):3495–3505; 2001. [DOI] [PMC free article] [PubMed] [Google Scholar]
- 5. Betarbet R.; Sherer T. B.; Di Monte D. A.; Greenamyre J. T. Mechanistic approaches to Parkinson’s disease pathogenesis. Brain Pathol. 12(4):499–510; 2002. [DOI] [PMC free article] [PubMed] [Google Scholar]
- 6. Bisgaard H. C.; Nagy P.; Ton P. T.; Hu Z.; Thorgeirsson S. S. Modulation of keratin 14 and alpha-fetoprotein expression during hepatic oval cell proliferation and liver regeneration. J. Cell Physiol. 159(3):475–484; 1994. [DOI] [PubMed] [Google Scholar]
- 7. Block G. D.; Locker J.; Bowen W. C.; Petersen B. E.; Katyal S.; Strom S. C.; Riley T.; Howard T. A.; Michalopoulos G. K. Population expansion, clonal growth, and specific differentiation patterns in primary cultures of hepatocytes induced by HGF/SF, EGF and TGF alpha in a chemically defined (HGM) medium. J. Cell Biol. 132(6):1133–1149; 1996. [DOI] [PMC free article] [PubMed] [Google Scholar]
- 8. Broekaert D.; Eyckerman S.; Lavens D.; Verhee A.; Waelput W.; Vandekerckhove J.; Tavernier J. Comparison of leptin- and interleukin-6-regulated expression of the rPAP gene family: Evidence for differential co-regulatory signals. Eur. Cytokine Network 13(1):78–85; 2002. [PubMed] [Google Scholar]
- 9. Buniatian G. H.; Hartmann H. J.; Traub P.; Weser U.; Wiesinger H.; Gebhardt R. Acquisition of blood–tissue barrier—supporting features by hepatic stellate cells and astrocytes of myofibroblastic phenotype. Inverse dynamics of metallothionein and glial fibrillary acidic protein expression. Neurochem. Int. 38(5):373–383; 2001. [DOI] [PubMed] [Google Scholar]
- 10. Clotman F.; Lannoy V. J.; Reber M.; Cereghini S.; Cassiman D.; Jacquemin P.; Roskams T.; Rousseau G. G.; Lemaigre F. P. The onecut transcription factor HNF6 is required for normal development of the biliary tract. Development 129(8):1819–1828; 2002. [DOI] [PubMed] [Google Scholar]
- 11. Cressman D. E.; Greenbaum L. E.; DeAngelis R. A.; Ciliberto G.; Furth E. E.; Poli V.; Taub R. Liver failure and defective hepatocyte regeneration in interleukin-6-deficient mice. Science 274(5291):1379–1383; 1996. [DOI] [PubMed] [Google Scholar]
- 12. Crosson S. M.; Davies G. F.; Roesler W. J. Hepatic expression of CCAAT/enhancer binding protein alpha: Hormonal and metabolic regulation in rats. Diabetologia 40(10):1117–1124; 1997. [DOI] [PubMed] [Google Scholar]
- 13. Dhar D. K.; Naora H.; Yamanoi A.; Ono T.; Kohno H.; Otani H.; Nagasue N. Requisite role of VEGF receptors in angiogenesis of hepatocellular carcinoma: A comparison with angiopoietin/Tie pathway. Anticancer Res. 22(1A):379–386; 2002. [PubMed] [Google Scholar]
- 14. Dietrich S.; Abou-Rebyeh F.; Brohmann H.; Bladt F.; Sonnenberg-Riethmacher E.; Yamaai T.; Lumsden A.; Brand-Saberi B.; Birchmeier C. The role of SF/HGF and c-Met in the development of skeletal muscle. Development 126(8):1621–1629; 1999. [DOI] [PubMed] [Google Scholar]
- 15. Duncan S. A.; Manova K.; Chen W. S.; Hoodless P.; Weinstein D. C.; Bachvarova R. F.; Darnell J. E. Jr. Expression of transcription factor HNF-4 in the extraembryonic endoderm, gut, and nephrogenic tissue of the developing mouse embryo: HNF-4 is a marker for primary endoderm in the implanting blastocyst. Proc. Natl. Acad. Sci. USA 91(16):7598–7602; 1994. [DOI] [PMC free article] [PubMed] [Google Scholar]
- 16. Ebens A.; Brose K.; Leonardo E. D.; Hanson M. G. Jr.; Bladt F.; Birchmeier C.; Barres B. A.; Tessier-Lavigne M. Hepatocyte growth factor/scatter factor is an axonal chemoattractant and a neurotrophic factor for spinal motor neurons. Neuron 17(6):1157–1172; 1996. [DOI] [PubMed] [Google Scholar]
- 17. Evarts R. P.; Nagy P.; Marsden E.; Thorgeirsson S. S. A precursor-product relationship exists between oval cells and hepatocytes in rat liver. Carcinogenesis 8(11):1737–1740; 1987. [DOI] [PubMed] [Google Scholar]
- 18. Evarts R. P.; Hu Z.; Omori N.; Omori M.; Marsden E. R.; Thorgeirsson S. S. Precursor-product relationship between oval cells and hepatocytes: Comparison between tritiated thymidine and bromodeoxyuridine as tracers. Carcinogenesis 17(10):2143–2151; 1996. [DOI] [PubMed] [Google Scholar]
- 19. Frank S.; Madlener M.; Werner S. Transforming growth factors beta1, beta2, and beta3 and their receptors are differentially regulated during normal and impaired wound healing. J. Biol. Chem. 271(17):10188–10193; 1996. [DOI] [PubMed] [Google Scholar]
- 20. Fujio K.; Evarts R. P.; Hu Z.; Marsden E. R.; Thorgeirsson S. S. Expression of stem cell factor and its receptor, c-kit, during liver regeneration from putative stem cells in adult rat. Lab. Invest. 70(4):511–516; 1994. [PubMed] [Google Scholar]
- 21. Gaiano N.; Fishell G. The role of notch in promoting glial and neural stem cell fates. Annu. Rev. Neurosci. 25:471–490; 2002. [DOI] [PubMed] [Google Scholar]
- 22. Gehring W. J. The genetic control of eye development and its implications for the evolution of the various eye-types. Int. J. Dev. Biol. 46(1):65–73; 2002. [PubMed] [Google Scholar]
- 23. Gille J.; Reisinger K.; Westphal-Varghese B.; Kaufmann R. Decreased mRNA stability as a mechanism of glucocorticoid-mediated inhibition of vascular endothelial growth factor gene expression by cultured keratinocytes. J. Invest. Dermatol. 117(6):1581–1587; 2001. [DOI] [PubMed] [Google Scholar]
- 24. Greenberg J. M.; Thompson F. Y.; Brooks S. K.; Shannon J. M.; McCormick-Shannon K.; Cameron J. E.; Mallory B. P.; Akeson A. L. Mesenchymal expression of vascular endothelial growth factors D and A defines vascular patterning in developing lung. Dev. Dyn. 224(2):144–153; 2002. [DOI] [PubMed] [Google Scholar]
- 25. Ha I. S.; Um E. Y.; Jung H. R.; Park H. W.; Cheong H. I.; Choi Y. Glucocorticoid diminishes vascular endothelial growth factor and exacerbates proteinuria in rats with mesangial proliferative glomerulonephritis. Am. J. Kidney Dis. 39(5):1001–1010; 2002. [DOI] [PubMed] [Google Scholar]
- 26. Hasegawa K.; Carr B. I. Neurotensin-amplification of DNA synthesis stimulated by EGF or TGF alpha in primary cultures of adult rat hepatocytes. Cell Struct. Funct. 18(2):105–110; 1993. [DOI] [PubMed] [Google Scholar]
- 27. Hausman G. J. The influence of dexamethasone and insulin on expression of CCAAT/enhancer binding protein isoforms during preadipocyte differentiation in porcine stromal-vascular cell cultures: Evidence for very early expression of C/EBPalpha. J. Anim. Sci. 78(5): 1227–1235; 2000. [DOI] [PubMed] [Google Scholar]
- 28. Herbst R. S.; Nielsch U.; Sladek F.; Lai E.; Babiss L. E.; Darnell J. E. Jr. Differential regulation of hepatocyte-enriched transcription factors explains changes in albumin and transthyretin gene expression among hepatoma cells. New Biol. 3(3):289–296; 1991. [PubMed] [Google Scholar]
- 29. Houck K. A.; Michalopoulos G. K. Altered responses of regenerating hepatocytes to norepinephrine and transforming growth factor type beta. J. Cell Physiol. 141(3):503–509; 1989. [DOI] [PubMed] [Google Scholar]
- 30. Ihn H. Pathogenesis of fibrosis: Role of TGF-beta and CTGF. Curr. Opin. Rheumatol. 14(6):681–685; 2002. [DOI] [PubMed] [Google Scholar]
- 31. Joplin R.; Hishida T.; Tsubouchi H.; Daikuhara Y.; Ayres R.; Neuberger J. M.; Strain A. J. Human intrahepatic biliary epithelial cells proliferate in vitro in response to human hepatocyte growth factor. J. Clin. Invest. 90(4):1284–1289; 1992. [DOI] [PMC free article] [PubMed] [Google Scholar]
- 32. Kan M.; Huang J. S.; Mansson P. E.; Yasumitsu H.; Carr B.; McKeehan W. L. Heparin-binding growth factor type 1 (acidic fibroblast growth factor): A potential biphasic autocrine and paracrine regulator of hepatocyte regeneration. Proc. Natl. Acad. Sci. USA 86(19): 7432–7436; 1989. [DOI] [PMC free article] [PubMed] [Google Scholar]
- 33. Kaplan F.; MacRae T.; Comber J.; Gagnon S.; Sladek R.; Hudson T. J.; Sweezey N. B. Application of expression microarrays to the investigation of fetal lung development in a glucocorticoid receptor knockout mouse model. Chest 121(3 Suppl.):90S; 2002. [PubMed] [Google Scholar]
- 34. Kietzmann T.; Cornesse Y.; Brechtel K.; Modaressi S.; Jungermann K. Perivenous expression of the mRNA of the three hypoxia-inducible factor alpha-subunits, HIF1alpha, HIF2alpha and HIF3alpha, in rat liver. Biochem. J. 354(Pt. 3):531–537; 2001. [DOI] [PMC free article] [PubMed] [Google Scholar]
- 35. Kishibe K.; Yamada Y.; Ogawa K. Production of nerve growth factor by mouse hepatocellular carcinoma cells and expression of TrkA in tumor-associated arteries in mice. Gastroenterology 122(7):1978–1986; 2002. [DOI] [PubMed] [Google Scholar]
- 36. Kitaichi K.; Chabot J. G.; Moebius F. F.; Flandorfer A.; Glossmann H.; Quirion R. Expression of the purported sigma(1) (sigma(1)) receptor in the mammalian brain and its possible relevance in deficits induced by antagonism of the NMDA receptor complex as revealed using an antisense strategy. J. Chem. Neuroanat. 20(3–4):375–387; 2000. [DOI] [PubMed] [Google Scholar]
- 37. Kliewer S. A.; Moore J. T.; Wade L.; Staudinger J. L.; Watson M. A.; Jones S. A.; McKee D. D.; Oliver b. B.; Willson T. M.; Zetterstroöm R. H.; Perlmann T.; Lehmann J. M. An orphan nuclear receptor activated by pregnanes defines a novel steroid signaling pathway. Cell 92(1):73–82; 1998. [DOI] [PubMed] [Google Scholar]
- 38. Kobayashi S.; Lord R.; Goto S.; Chiba S.; Okumura K.; Nagaoka I. Production of IL-2 by hepatocytes in allografted liver of rats. Transpl. Immunol. 5(3):237–239; 1997. [DOI] [PubMed] [Google Scholar]
- 39. Kraizer Y.; Mawasi N.; Seagal J.; Paizi M.; Assy N.; Spira G. Vascular endothelial growth factor and angiopoietin in liver regeneration. Biochem. Biophys. Res. Commun. 287(1):209–215; 2001. [DOI] [PubMed] [Google Scholar]
- 40. Lee J. S.; Thorgeirsson S. S. Functional and genomic implications of global gene expression profiles in cell lines from human hepatocellular cancer. Hepatology 35(5):1134–1143; 2002. [DOI] [PubMed] [Google Scholar]
- 41. Lee P.; Goishi K.; Davidson A. J.; Mannix R.; Zon L.; Klagsbrun M. Neuropilin-1 is required for vascular development and is a mediator of VEGF-dependent angiogenesis in zebrafish. Proc. Natl. Acad. Sci. USA 99(16):10470–10475; 2002. [DOI] [PMC free article] [PubMed] [Google Scholar]
- 42. Li W.; Liang X.; Leu J. I.; Kovalovich K.; Ciliberto G.; Taub R. Global changes in interleukin-6-dependent gene expression patterns in mouse livers after partial hepatectomy. Hepatology 33(6):1377–1386; 2001. [DOI] [PubMed] [Google Scholar]
- 43. Mars W. M.; Kim T. H.; Stolz D. B.; Liu M. L.; Michalopoulos G. K. Presence of urokinase in serum-free primary rat hepatocyte cultures and its role in activating hepatocyte growth factor. Cancer Res. 56(12): 2837–2843; 1996. [PubMed] [Google Scholar]
- 44. Mars W. M.; Liu M. L.; Kitson R. P.; Goldfarb R. H.; Gabauer M. K.; Michalopoulos G. K. Immediate early detection of urokinase receptor after partial hepatectomy and its implications for initiation of liver regeneration. Hepatology 21(6):1695–1701; 1995. [PubMed] [Google Scholar]
- 45. Michalopoulos G. K.; DeFrances M. C. Liver regeneration. Science 276(5309):60–66; 1997. [DOI] [PubMed] [Google Scholar]
- 46. Michalopoulos G. K.; Bowen W. C.; Mule K.; Stolz D. B. Histological organization in hepatocyte organoid cultures. Am. J. Pathol. 159(5):1877–1887; 2001. [DOI] [PMC free article] [PubMed] [Google Scholar]
- 47. Michalopoulos G. K.; Bowen W. C.; Mule K.; Lopez-Talavera J. C.; Mars W. Hepatocytes undergo phenotypic transformation to biliary epithelium in organoid cultures. Hepatology 36(2):278–283; 2002. [DOI] [PMC free article] [PubMed] [Google Scholar]
- 48. Monga S. P.; Pediaditakis P.; Mule K.; Stolz D. B.; Michalopoulos G. K. Changes in WNT/beta-catenin pathway during regulated growth in rat liver regeneration. Hepatology 33(5):1098–1109; 2001. [DOI] [PMC free article] [PubMed] [Google Scholar]
- 49. Monga S. P.; Mars W. M.; Pediaditakis P.; Bell A.; Mule K.; Bowen W. C.; Wang X.; Zarnegar R.; Michalopoulos G. K. Hepatocyte growth factor induces Wnt-independent nuclear translocation of beta-catenin after Met-beta-catenin dissociation in hepatocytes. Cancer Res. 62(7):2064–2071; 2002. [PubMed] [Google Scholar]
- 50. Nagy P.; Kiss A.; Schnur J.; Thorgeirsson S. S. Dex-amethasone inhibits the proliferation of hepatocytes and oval cells but not bile duct cells in rat liver. Hepatology 28(2):423–429; 1998. [DOI] [PubMed] [Google Scholar]
- 51. Nomiyama H.; Heishima K.; Nakayama T.; Sakaguchi T.; Fujisawa R.; Tanase S.; Nishura H.; Matsunom K.; Takamori H.; Tabira Y.; Yamamoto T.; Miura R.; Yoshie O. Human CC chemokine liver-expressed chemokine/CCL16 is a functional ligand for CCR1, CCR2 and CCR5, and constitutively expressed by hepatocytes. Int. Immunol. 13(8):102–1029; 2001. [DOI] [PubMed] [Google Scholar]
- 52. Normanno N.; Bianco C.; De Luca A.; Salomon D. S. The role of EGF-related peptides in tumor growth. Front. Biosci. 6:D685–707; 2001. [DOI] [PubMed] [Google Scholar]
- 53. Ohkubo T.; Sugawara Y.; Sasaki K.; Maruyama K.; Ohkura N.; Makuuchi M. Early induction of nerve growth factor-induced genes after liver resection-reperfusion injury. J. Hepatol. 36(2):210–217; 2002. [DOI] [PubMed] [Google Scholar]
- 54. Pfaffle R. W.; Blankenstein O.; Wuller S.; Kentrup H. Combined pituitary hormone deficiency: Role of Pit-1 and Prop-1. Acta Paediatr. Suppl. 88(433):33–41; 1999. [DOI] [PubMed] [Google Scholar]
- 55. Radtke F.; Wilson A.; Ernst B.; MacDonald H. R. The role of Notch signaling during hematopoietic lineage commitment. Immunol. Rev. 187:65–74; 2002. [DOI] [PubMed] [Google Scholar]
- 56. Roberts A. B.; McCune B. K.; Sporn M. B. TGF-beta: Regulation of extracellular matrix. Kidney Int. 41(3):557–559; 1992. [DOI] [PubMed] [Google Scholar]
- 57. Rogler C. E.; Chisari F. V. Cellular and molecular mechanisms of hepatocarcinogenesis. Semin. Liver Dis. 12(3):265–278; 1992. [DOI] [PubMed] [Google Scholar]
- 58. Ross M. A.; Sander C. M.; Kleeb T. B.; Watkins S. C.; Stolz D. B. Spatiotemporal expression of angiogenesis growth factor receptors during the revascularization of regenerating rat liver. Hepatology 34(6): 1135–1148; 2001. [DOI] [PubMed] [Google Scholar]
- 59. Rowell D. L.; Eckmann L.; Dwinell M. B.; Carpenter S. P.; Raucy J. L.; Yang S. K.; Kagnoff M. F. Human hepatocytes express an array of proinflammatory cytokines after agonist stimulation or bacterial invasion. Am. J. Physiol. 273(2 Pt. 1):G322–332; 1997. [DOI] [PubMed] [Google Scholar]
- 60. Rowen L.; et al. Analysis of the human neurexin genes: Alternative splicing and the generation of protein diversity. Genomics 79(4):587–597; 2002. [DOI] [PubMed] [Google Scholar]
- 61. Sakamoto T.; Liu Z.; Murase N.; Ezure T.; Yokomuro S.; Poli V.; Demetris A. J. Mitosis and apoptosis in the liver of interleukin-6-deficient mice after partial hepatectomy. Hepatology 29(2):403–411; 1999. [DOI] [PubMed] [Google Scholar]
- 62. Schmidt C.; Bladt F.; Goedecke S.; Brinkmann V.; Zschiesche W.; Sharpe M.; Gherardi E.; Birchmeier C. Scatter factor/hepatocyte growth factor is essential for liver development. Nature 373(6516):699–702; 1995. [DOI] [PubMed] [Google Scholar]
- 63. Seglen P. O. Preparation of isolated rat liver cells. Methods Cell Biol. 13:29–83; 1976. [DOI] [PubMed] [Google Scholar]
- 64. Shen H.; Cheng T.; Olszak I.; Garcia-Zepeda E.; Lu Z.; Herrmann S.; Fallon R.; Luster A. D.; Scadden D. T. CXCR-4 desensitization is associated with tissue localization of hemopoietic progenitor cells. J. Immunol. 166(8):5027–5033; 2001. [DOI] [PubMed] [Google Scholar]
- 65. Sibilia M.; Steinbach J. P.; Stingl L.; Aguzzi A.; Wagner E. F. A strain-independent postnatal neurodegeneration in mice lacking the EGF receptor. EMBO J. 17(3):719–731; 1998. [DOI] [PMC free article] [PubMed] [Google Scholar]
- 66. Sirica A. E.; Cihla H. P. Isolation and partial characterizations of oval and hyperplastic bile ductular cell-enriched populations from the livers of carcinogen and noncarcinogen-treated rats. Cancer Res. 44(8):3454–3466; 1984. [PubMed] [Google Scholar]
- 67. Sirica A. E.; Lai G. H.; Endo K.; Zhang Z.; Yoon B. I. Cyclooxygenase-2 and ERBB-2 in cholangiocarcinoma: Potential therapeutic targets. Semin. Liver Dis. 22(3):303–313; 2002. [DOI] [PubMed] [Google Scholar]
- 68. Skrtic S.; Wallenius V.; Ekberg S.; Brenzel A.; Gressner A. M.; Jansson J. O. Insulin-like growth factors stimulate expression of hepatocyte growth factor but not transforming growth factor beta1 in cultured hepatic stellate cells. Endocrinology 138(11):4683–4689; 1997. [DOI] [PubMed] [Google Scholar]
- 69. Skrtic S.; Wallenius V.; Ekberg S.; Brenzel A.; Gressner A. M.; Jansson J. O. Hepatocyte-stimulated expression of hepatocyte growth factor (HGF) in cultured rat hepatic stellate cells. J. Hepatol. 30(1):115–124; 1999. [DOI] [PubMed] [Google Scholar]
- 70. Sladek F. M.; Zhong W. M.; Lai E.; Darnell J. E. Jr. Liver-enriched transcription factor HNF-4 is a novel member of the steroid hormone receptor superfamily. Genes Dev. 4(12B):2353–2365; 1990. [DOI] [PubMed] [Google Scholar]
- 71. Soriano H. E.; Bilyeu T. A.; Juan T. S.; Zhao W.; Darlington G. J. DNA binding by C/EBP proteins correlates with hepatocyte proliferation. In Vitro Cell Dev. Biol. Anim. 31(9):703–709; 1995. [DOI] [PubMed] [Google Scholar]
- 72. Tosh D.; Shen C. N.; Slack J. M. Differentiated properties of hepatocytes induced from pancreatic cells. Hepatology 36(3):534–543; 2002. [DOI] [PubMed] [Google Scholar]
- 73. Uehara Y.; Mori C.; Noda T.; Shiota K.; Kitamura N. Rescue of embryonic lethality in hepatocyte growth factor/scatter factor knockout mice. Genesis 27(3):99–103; 2000. [PubMed] [Google Scholar]
- 74. Uehara Y.; Minowa O.; Mori C.; Shiota K.; Kuno J.; Noda T.; Kitamura N. Placental defect and embryonic lethality in mice lacking hepatocyte growth factor/ scatter factor. Nature 373(6516):702–705; 1995. [DOI] [PubMed] [Google Scholar]
- 75. Vintermyr O. K.; Doskeland S. O. Characterization of the inhibitory effect of glucocorticoids on the DNA replication of adult rat hepatocytes growing at various cell densities. J. Cell Physiol. 138(1):29–37; 1989. [DOI] [PubMed] [Google Scholar]
- 76. Weinstein M.; Monga S. P.; Liu Y.; Brodie S. G.; Tang Y.; Li C.; Mishra L.; Deng C. X. Smad proteins and hepatocyte growth factor control parallel regulatory pathways that converge on beta1-integrin to promote normal liver development. Mol. Cell. Biol. 21(15):5122–5131; 2001. [DOI] [PMC free article] [PubMed] [Google Scholar]
- 77. Wu T.; Han C.; Lunz J. G. 3rd; Michalopoulos G.; Shelhamer J. H.; Demetris A. J. Involvement of 85-kd cytosolic phospholipase (2) and cyclooxygenase-2 in the proliferation of human cholangiocarcinoma cells. Hepatology 36(2):363–373; 2002. [DOI] [PubMed] [Google Scholar]
- 78. Yang L.; Li S.; Hatch H.; Ahrens K.; Cornelius J. G.; Petersen B. E.; Peck A. B. In vitro trans-differentiation of adult hepatic stem cells into pancreatic endocrine hormone-producing cells. Proc. Natl. Acad. Sci. USA 99(12):8078–8083; 2002. [DOI] [PMC free article] [PubMed] [Google Scholar]