Abstract
The lasI-lasR and the rhlI-rhlR quorum-sensing systems in Pseudomonas aeruginosa regulate the expression of numerous cellular and secreted virulence factor genes and play important roles in the development of biofilms. The las and rhl systems themselves are known to be directly or indirectly regulated by a number of transcriptional regulators, and consequently, their expression is sensitive to environmental conditions. In this report, the activities of these two quorum-sensing systems have been examined systematically under 46 growth conditions, and the regulation by environmental conditions has been investigated. The relative timing and strength of expression of these two systems varied significantly under different conditions, which contrasts with the notion of a preset hierarchy with these two systems in P. aeruginosa. Depending on the growth conditions, the correlation between each synthase and its cognate transcriptional regulator also varied, suggesting that the transcription of these genes independently allows for further fine tuning of each system. Finally, we observe that the activities of both the lasI-lasR and the rhlI-rhlR quorum-sensing systems were dramatically enhanced in the presence of extracts of sputum samples from cystic fibrosis patients.
Quorum sensing (QS) is an important global gene regulatory mechanism in bacteria that enables individual bacteria to communicate and coordinate their behaviors in populations. In general terms, it is often defined as cell density-dependent regulation of gene expression via extracellular signals. Bacteria produce small, diffusible signals, termed “autoinducers,” and when the signals reach a critical threshold concentration, the targeted QS genes are activated or repressed. In some but not all systems, the QS systems themselves are subject to positive feedback (autoinduction). Acyl-homoserine lactone (acyl-HSL) signal-mediated QS systems are the primary QS system found in gram-negative bacteria. They are typically encoded by two genes: the synthase gene whose product generates the signal and the receptor (or regulator) gene whose product responds to the signal and subsequently regulates target genes. Under typical laboratory conditions, the critical determinant in QS is therefore the activity of the synthase and the receptor.
Pseudomonas aeruginosa is a major opportunistic pathogen capable of causing a variety of soft tissue infections in susceptible hosts. In patients with cystic fibrosis (CF), P. aeruginosa chronic infection and associated pulmonary inflammation are ultimately responsible for the majority of morbidity and mortality. Extensive studies have been carried out on the P. aeruginosa QS systems (10, 26). It has been shown that there are two HSL-mediated QS systems in this microorganism, the las and rhl systems, and one 2-heptyl-3-hydroxy-4-quinolone-mediated system, the Pseudomonas quinolone signal system. The transcriptional regulator LasR and the cognate autoinducer N-(3-oxododecanoyl)-l-HSL (3-oxo-C12-HSL) constitute the las system, while RhlR and the autoinducer N-butyryl-l-HSL (C4-HSL) constitute the rhl system. lasI and rhlI are responsible for the synthesis of the major autoinducers 3-oxo-C12-HSL and C4-HSL, respectively. The two systems regulate overlapping sets of genes, and these QS systems are central for the pathogenicity of P. aeruginosa. Up to 11% of the genes in the P. aeruginosa genome are affected by the HSL signals (23, 32, 34). The expression of numerous cellular and secreted virulence factors, including alkaline protease, rhamnolipids, elastase, LasA protease, phospholipase C, lipase, exotoxin A, pyocyanin, and lectins, is regulated by the las and rhl systems. QS also plays crucial roles in the development of biofilms (4), probably the form in which P. aeruginosa persists in the airways of CF patients (24). The HSL molecules produced by the QS systems can also interact directly with eukaryotic cells and modulate the host immune system (29, 33, 36).
Under standard laboratory growth conditions, it has been shown that the las and rhl systems in P. aeruginosa are positioned in a hierarchic structure. The las system exerts a positive control over the rhl system (5), inducing both rhlI and rhlR transcription, and therefore sits at the upper level of the regulation circuit. Besides common genes controlled by both las and rhl systems, there are genes specifically regulated by either the las or the rhl system. In some cases, the two systems function in opposite directions on the same targets, where one system activates and the other represses. Despite the importance of these QS systems of P. aeruginosa in the expression of many virulence genes and the regulation of pathogenesis, recent studies indicate that a significant percentage of clinical and environmental isolates of P. aeruginosa carry mutations in lasR (1, 25), raising the question of the functionality and benefit of the QS system in certain conditions. It is possible that the hierarchy of the QS system is only conditional and that these two systems function nonequivalently under different conditions.
To understand the regulation of the QS systems in P. aeruginosa under different environmental conditions, we investigated the expression of the las and rhl QS systems under 46 growth conditions. The temporal expression profiles of the lasR-lasI and rhlR-rhlI QS genes as well as those of representative QS responsive genes aprA and rhlA, encoding alkaline protease and rhamnosyltransferase, respectively, were analyzed. We demonstrate that the expression of these two systems varies significantly under different growth conditions. Significantly, both the relative timing and the magnitude of expression were sensitive to growth conditions. Moreover, we observed no direct correlation with absolute cell density.
MATERIALS AND METHODS
Bacterial strains and culture conditions.
The bacterial strains, plasmids, and oligonucleotide primers used in this study are listed in Table 1. P. aeruginosa strains were routinely grown and maintained on Luria-Bertani (LB) plates or LB broth at 37°C. Agrobacterium tumefaciens was grown in LB medium at 30°C. Trimethoprim (Sigma-Aldrich) was added at 300 μg/ml where appropriate.
TABLE 1.
Bacterial strains, plasmids, and oligonucleotide primers used
| Strain, plasmid, or primer | Description or sequencea | Source or reference |
|---|---|---|
| Strains | ||
| P. aeruginosa PAO1 | Wild type | |
| A. tumefaciens A136 (pCF218) (pMV26) | HSL detection strain | 2 |
| PAO-JP2 | lasI-rhlI double mutant of PAO1 | 17 |
| Plasmids | ||
| pMS402 | Expression reporter plasmid carrying the promoterless luxCDABE gene; ori of pRO1614 (15) | 6 |
| pKD201 | lasI promoter cloned upstream of the luxCDABE in pMS402 | This study |
| pKD202 | pMS402 containing rhlI promoter | This study |
| pKD204 | pMS402 containing lasR promoter | This study |
| pKD205 | pMS402 containing rhlR promoter | This study |
| pKD207 | pMS402 containing aprA promoter | This study |
| pKD-rhlA | pMS402 containing rhlA promoter | 6 |
| Oligonucleotide primers | ||
| lasI forward | TTTGGATCCTATTACTCTCTGA | |
| lasI reverse | ACGCAACTTGTGGATCCCGC | |
| rhlI forward | AGAGGATCCAGAAGAAGTTCG | |
| rhlI reverse | CTTCCAGGGATCCAGAGAG | |
| lasR forward | CTGCTCGAGCCGGGCTCGGCCTGTTCT | |
| lasR reverse | CGGGATCCGGATGGCGCTCCACTCCA | |
| rhlR forward | CATGCGCGAGCAGGAGTTGCb | |
| rhlR reverse | TAGGGATCCTAATCGAAGCCCAGGCGC | |
| aprA forward | TCACTCGAGACCGCGAAGGACGTGC | |
| aprA reverse | TTGGGATCCTGGGTATACGCATCGC |
Underlined nucleotide sequences indicate endonuclease restriction sites.
The XhoI site 20 bp downstream of this primer was used to clone the promoter.
Salmon sperm DNA was purchased from Invitrogen, CA, and mucin (porcine) was from Sigma-Aldrich. LB (Bacto), Todd-Hewitt broth (Bacto) supplemented with 0.5% yeast extract (THY), brain heart infusion broth (BHI) (Bacto), and the quarter dilutions of these broths were used as base media for some of the gene expression assays. M9 medium (Bacto) supplemented with glucose (0.5%), Casamino Acids (CAA) (0.1%) was also used in a number of gene expression experiments. Trypticase soy broth treated with Chelex 100 (TSB)-DC medium (14), which consists of deferrated dialysate of TSB (Difco Laboratories, Detroit, MI) supplemented with 1% glycerol and 50 mM monosodium glutamate, was used in assays to measure iron-dependent responses. FeCl3 and the iron chelator ethylenediamine-N,N′-diacetic acid (EDDA) were added to TSB-DC at 50 μM and 400 μg/ml, respectively, to establish iron-sufficient and iron-depleted conditions. Tobramycin (Sigma-Aldrich) was added at 0.25 μg/ml and 0.5 μg/ml (subinhibitory concentrations) as indicated. AI-2 was synthesized as previously described (21) and used as in previous studies (6). The HSL autoinducers N-dodecanoyl-l-HSL (C12-HSL) and N-butyryl-l-HSL (C4-HSL) were purchased from Sigma-Aldrich. The sputum samples used in this study were processed as described previously (6).
A microaerophilic condition was achieved by placing the microtiter plates in an anaerobic jar with an Anaerocult A pack (Merck). The anaerobic jar was opened every 3 hours for plate reading, and a new pack was used afterwards.
Construction of QS gene expression reporters.
Plasmid pMS402, containing promoterless luxCDABE, was used to construct QS gene promoter reporters (6). The promoter regions of the lasR, lasI, rhlR, rhlI, and aprA genes were PCR amplified using high-fidelity Pfx DNA polymerase (Invitrogen) and primers (Table 1) synthesized according to the PAO1 genome data (28). They were cloned into the BamHI site or the BamHI-XhoI site upstream of the lux genes on pMS402. The constructs were transformed into PAO1 by electroporation. DNA manipulation, PCR, and transformation were performed, following general procedures (20). Cloned promoter sequences were confirmed by DNA sequencing. Using these lux-based reporters, gene expression under different conditions was measured as counts per second (cps) of light production with a Victor2 multilabel counter (Wallac model 1450; Perkin-Elmer).
Measurement of HSL.
The lasI-dependent 3-oxo-C12-HSL produced by P. aeruginosa was estimated using a modified A. tumefaciens system (2). On a 96-well microtiter plate, 10 μl of samples (or diluted samples) to be tested was added to 90 μl of the diluted culture of reporter strain A. tumefaciens A136 (pCF218) (pMV26) (2). The luminescence values of individual cultures (wells) were measured every hour for a total of 24 h. The relative concentration of HSL was estimated by comparing the maximal cps values to a standard curve generated from commercial 3-oxo-C12-HSL (2). The autoinducer of the rhl system, C4-HSL, was measured using an rhlA promoter-based P. aeruginosa strain, PAO-JP2 (pKD-rhlA). This detection system was developed by fusing the C4-HSL-responsive rhlA promoter upstream of luxCDABE and introducing the construct into PAO-JP2, a lasI-rhlI double-mutant strain. The assays were also carried out on a 96-well plate by using the same protocol as for the A. tumefaciens system. As a negative control, medium containing no HSL was added to the reporter strain in parallel with the samples. The HSL levels were reported as relative HSL units calculated as follows: (cps − cps of the control)/optical density (OD) values.
Monitoring gene expression.
Overnight cultures of the reporter strains were diluted to OD620 values of 0.25 and cultivated for two additional hours before use as inoculants. Assays were carried out in a 96-well black plate with a transparent bottom (9520 Costar; Corning Inc.). Twenty-five microliters of the fresh cultures was inoculated to the wells containing a total of 125 μl medium plus other components, and the OD620 value in the wells was ca. 0.05. Sixty microliters of filter-sterilized mineral oil was added to each well to prevent evaporation during the assay. Luminescence was measured every 30 min for 24 to 30 h under different conditions. Bacterial growth was monitored at the same time by measuring the OD620 in the Victor2 multilabel counter. Gene expression levels were normalized by dividing the luminescence value by the OD620 value of each sample when indicated. All the experiments were repeated at least three times, and the figures shown are representative of similar profiles.
RESULTS
HSL synthase gene expression profiles correlate with HSL production.
The synthesis of acyl-HSL in P. aeruginosa is dependent on the luxI-homologous HSL synthase genes lasI and rhlI. The synthesis reaction uses common metabolic intermediates (S-adenosyl methionine and acyl carrier protein), so it is assumed that the synthesis of HSL is a function of the synthase level. To validate that the lasI and rhlI expression levels measured are correlated with the production of their respective autoinducers, we measured lasI and rhlI promoter activities using a luxCDABE reporter system and quantitated the individual autoinducers using two autoinducer detection systems.
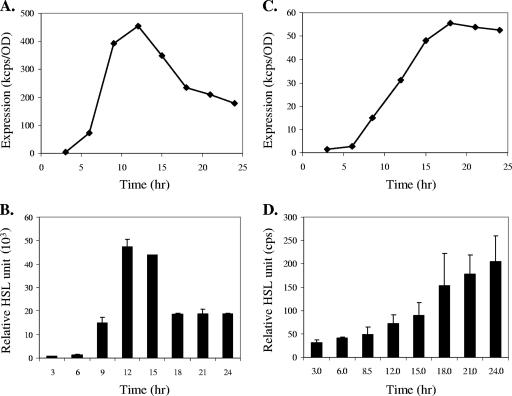
To measure lasI-dependent long chain HSLs (3-oxo-C12-HSL and C8-HSL), an A. tumefaciens system (2) was used. An rhlA-based P. aeruginosa system (PAO-JP2/pKD-rhlA) was developed and used to measure rhlI-dependent autoinducer C4-HSL. lasI and rhlI expression was measured using promoter-luxCDABE fusions. Culture samples were taken at 3-hour intervals, and the concentrations of HSL in the samples were measured. As shown in Fig. 1B, the production of 3-oxo-C12-HSL, as detected by the A. tumefaciens system, correlated with the expression profiles of lasI, especially before and at the expression peak. The C4-HSL production is in similar accordance with the rhlI expression profile (Fig. 1C and D). However, the accumulated HSLs persist after the expression levels of synthase genes start to decrease (Fig. 1). The stability of the compounds in the culture media and therefore the total of accumulated signals will be affected by medium conditions, most notably pH, as reported previously (37). Nonetheless, the maximum expression levels of lasI and rhlI correlate with the maximum amounts of 3-oxo-C12-HSL and C4-HSL, respectively. Similar results were observed in other growth conditions (data not shown). These results indicate that the levels of HSL produced by LasI and RhlI correlate with the transcription activities of their respective promoters.
FIG. 1.
Correlation between synthase gene expression and HSL production. (A) lasI expression profile in TSB-DC-EDDA medium and (B) 3-oxo-C12-HSL production as measured by the A. tumefaciens detection system. (C) rhlI expression profile in M9 medium and (D) C4-HSL production as measured by the PAO-JP2 (pKD-rhlA) system. Autoinducer production is presented as relative HSL units, i.e., the cps value minus the control cps value divided by the OD value.
Expression of QS genes under different growth conditions.
The lasR-lasI and rhlR-rhlI QS systems in P. aeruginosa have been shown to be modulated by environmental factors (12, 27, 30, 32). Each of the four genes is expressed from monocistronic operons. To further our understanding of the regulation of these systems, we examined the expression profiles of lasI, lasR, rhlI, and rhlR under 46 experimental conditions over a 30-h time course (Table 2). These include different nutritional conditions as well as addition of exogenous HSLs, mucin, DNA, subinhibitory concentrations of antibiotics, NaCl, and AI-2; some of these substances have been previously shown to modulate P. aeruginosa virulence (6, 12). Conditions limiting the availability of iron and oxygen were also examined. Finally, the response of these genes to an extract of CF sputum was also measured.
TABLE 2.
List of experimental conditions under which the expression of QS genes was examined
| Condition no. | Description |
|---|---|
| 1 | M9 (supplemented with 0.1% CAA)a |
| 2 | LB medium |
| 3 | BHI medium |
| 4 | THY medium |
| 5 | 1/4-diluted LB |
| 6 | 1/4-diluted BHI medium |
| 7 | 1/4-diluted THY medium |
| 8 | TSB-DC medium |
| 9 | TSB-DC + 50 μM FeCl3 medium |
| 10 | M9 + 100 mM NaCl |
| 11 | M9 + 200 mM NaCl |
| 12 | M9 + AI-2 (5%) |
| 13 | 1/4-diluted LB + 150 mM NaCl |
| 14 | 1/4-diluted LB + 0.5% mucin |
| 15 | 1/4-diluted LB + 0.25 μg/ml tobromycin |
| 16 | 1/4-diluted LB + 0.5 μg/ml tobromycin |
| 17 | 1/4-diluted LB + AI-2 10% |
| 18 | 1/4-diluted LB + phosphate-buffered saline |
| 19 | M9 + 2.5% sputum extract |
| 20 | M9 + 5% sputum extract |
| 21 | M9 + 2.5 μM C4-HSL |
| 22 | M9 + 5 μM C4-HSL |
| 23 | M9 + 200 μg/ml salmon sperm DNA |
| 24 | M9 + 0.5% mucin |
| 25 | M9 with 0.1% glucose instead of 0.5% (carbon source restricted) |
| 26 | M9 + 0.25 μg/ml tobromycin |
| 27 | M9 + 0.5 μg/ml tobromycin |
| 28 | TSB-DC + EDDA; microaerophilic condition |
| 29 | TSBDC + 50 μM FeCl3; microaerophilic condition |
| 30 | M9; microaerophilic condition |
| 31 | M9 + 00 mM NaCl; microaerophilic condition |
| 32 | TSB-DC medium + EDDA |
| 33 | 1/4-diluted LB, AI-2 (5%) + mucin (0.5%) |
| 34 | M9 + (C12-HSL) dodecanoyl-l-homoserine lactone (5 μM)b |
| 35 | M9 + (C12-HSL) dodecanoyl-l-homoserine lactone (10 μM) |
| 36 | M9 + phosphate-buffered saline |
| 37 | M9 + AI-2 (10%) |
| 38 | M9 + mucin (0.25%) |
| 39 | M9-BMc |
| 40 | 1/4-diluted LB-BM |
| 41 | LB-BM |
| 42 | 1/4-diluted BHI-BM |
| 43 | BHI-BM |
| 44 | 1/4-diluted THY-BM |
| 45 | THY-BM |
| 46 | TSBDC-BM |
All M9 media containing CAA supplement.
The C12-HSL is different from 3-oxo-C12-HSL produced by P. aeruginosa LasI.
Breathable membranes were used instead of mineral oil for sealing the multiwell plate.
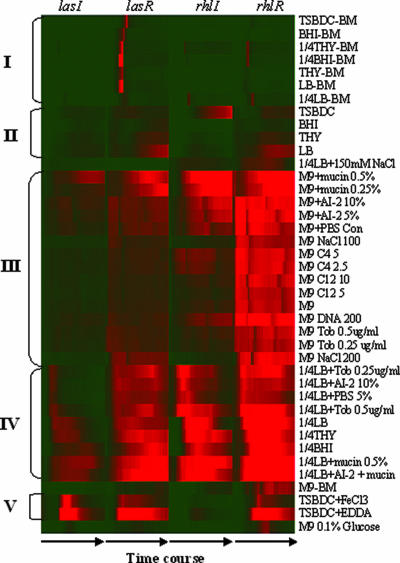
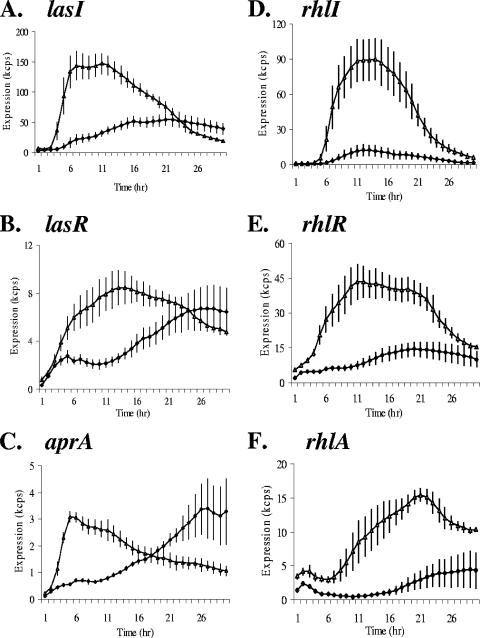
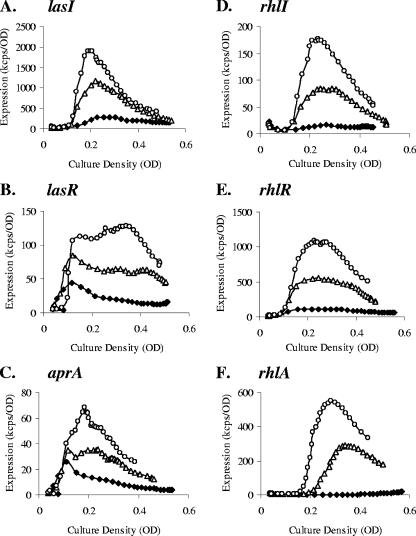
Normalized expression profiles for 40 conditions (excluding the CF sputum extracts and microaerophilic condition) are shown in Fig. 2. In general, the results indicate that the expression profiles of both the synthase genes and the transcriptional regulator genes varied widely under different conditions. Both the levels of expression and the timing of the expression peaks depend on the growth conditions. Higher expression was observed in minimal media and diluted media (1/4-diluted LB, 1/4-diluted BHI, and 1/4-diluted THY) than in rich media such as LB, THY, and BHI (Fig. 2, compare marked clusters II to III and IV). The data presented in Fig. 2 have been normalized to maximum expression values for each promoter under all conditions (excluding the addition of CF sputum extract and microaerophilic conditions). As an example of the different expression profiles under different conditions, the expression profiles of the QS genes lasI, lasR, rhlI, and rhlR and two QS-regulated genes, aprA and rhlA, under two growth conditions are presented in Fig. 3. The activation of the QS genes differed in response to the culture conditions. In minimum M9 medium and in diluted media, the QS genes were activated in the early to mid-logarithm phase instead of in early stationary phase as in LB. Much higher expression was also reached in the former medium. The responses of the las- and rhl-dependent reporters (aprA and rhlA, respectively) were generally consistent with the expression levels of the regulatory genes.
FIG. 2.
Cluster of lasI-lasR and rhlI-rhlR temporal expression profiles under 40 growth conditions. To compare the relative expression levels of each gene across all conditions, the data were normalized by the maximum values under all 40 conditions for each gene. The profiles were grouped by hierarchical clustering using average linkage analysis performed with the Cluster program and visualized using Treeview (7).
FIG. 3.
Comparison of expression profiles of the lasI, lasR, rhlI, rhlR, aprA, and rhlA promoters under two growth conditions, LB and 1/4-diluted LB. The expression profiles of the promoter-reporter fusions were measured every 30 min for 30 h at 37°C. Only every second data point is shown. Panels A to F represent the profiles of lasI, lasR, aprA, rhlI, rhlR, and rhlA, correspondingly. Solid diamonds and open triangles represent expression in LB and 1/4-diluted LB, respectively. The data are presented as cps × 10−3 (kcps) and are the average values for four repeats, with the standard deviations indicated by the vertical bars.
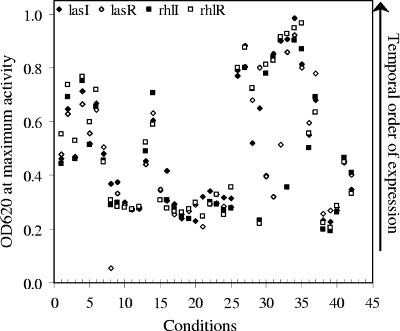
Since QS is often characterized as a cell density-dependent phenomenon, the observation that higher expression was reached in diluted media and minimal media than in rich media prompted us to further analyze the relationship of QS expression and cell densities in these cultures. Figure 4 shows a plot of the cell densities at which maximal expression of QS genes was reached. The results indicate that the cell densities at which the HSL expression was activated and at which the maximal level was reached varied dramatically, depending on the growth conditions. No correlation could be established between cell densities and the activation of QS expression over this range of conditions, indicating the absence of critical cell density as a prerequisite for QS activation. Also note that under some conditions, the maximum expression levels of the las systems preceded that of the rhl system (i.e., reached maximal activity at lower cell densities), as expected from the hierarchical organization of the two systems. However, it was also observed that the rhl system was activated earlier than the las system under other conditions. These results indicate that the hierarchical relationship between the two systems is largely condition dependent, and the cascade of the QS regulatory network seems to be variable.
FIG. 4.
Distribution of cell densities at which maximum QS gene expression was observed under 42 growth conditions. Shown are the OD values at which the maximal expression of each gene for each condition was plotted. The 40 conditions presented in Table 1 as well as growth in the presence of CF sputum extracts at two concentrations (Fig. 6) are presented. Solid diamonds, open diamonds, solid circles, and open circles represent data for lasI, lasR, rhlI, and rhlR, respectively.
The correlation between the synthase and the receptor.
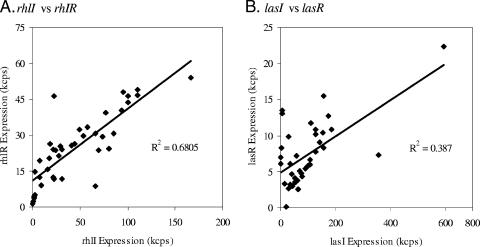
The functioning of QS depends on both autoinducer production and detection. In both the las and the rhl systems, the synthase and the receptors are expressed in separate operons and may be differentially regulated. The data presented in Fig. 4 suggest that this is the case. The relative timing of the expression of the synthase and receptor genes does not appear to be strictly correlated. To more closely examine the effect of environmental conditions on these components and their relationship, we analyzed the correlation between the expression levels for the synthase genes versus those for the receptor genes as well as with respect to downstream target genes. As shown in Fig. 5, the discordance between lasI and lasR was obvious (R2 = 0.39) over the 40 conditions, implying different effects on these components by environmental conditions. The relative strength of expression of the synthase genes, represented as the ratio of lasI to rhlI, fluctuates dramatically, from to 45:1 to 1:1.7, over the conditions listed in Table 2. The ratios between the receptor genes also varied, from 5:1 to 1:100. It is evident that one of the two systems plays a more active role than the other under some conditions.
FIG. 5.
Correlations of expression levels of synthase and regulator genes. The maximal expression values for the synthase genes (lasI and rhlI) were plotted against the maximal expression values of the regulator genes (lasR and rhlR) for all 40 conditions as for Fig. 2. R2 values are calculated from the linear regression of the data.
Modulation of QS by sputum extract, iron limitation, and sodium chloride concentration.
A major area of interest in the QS systems in P. aeruginosa is their role in the regulation of virulence determinants. P. aeruginosa is the primary pathogen associated with chronic infections in CF, and the QS systems are active in vivo (8, 9, 13, 24). This viscous mucous secretion expectorated as sputum is a complex mixture of host and bacterially derived compounds, including DNA, mucin, phosphatidylcholine, phosphatidylglycerol, albumin, and an unknown number of small molecules. We examined the expression of lasR-lasI and rhlR-rhlI in the presence of sputum extracts. A significant and dose-dependent increase in the expression of all QS genes was observed in the presence of sputum sample extract (Fig. 6). Addition of 5% sputum extract resulted in the highest level of induction of all four genes under all conditions examined. Although CF sputum has been reported to contain detectable HSL (8, 13), the reported levels are below those required to activate QS genes under the conditions of our extractions. We examined several conditions that relate to what is expected in the airways, including the addition of mucin, DNA, and different NaCl concentrations as well as low iron and microaerophilic conditions (Fig. 2). For the most part, each of these conditions resulted in only small changes in expression. It is to be noted that the mucin used in the experiments is a commercial preparation which is inevitably very different from what is present in CF sputum samples. In the case of iron limitation, a small increase in lasR-lasI gene expression levels was observed; however, the expression of rhlR-rhlI was markedly induced by iron limitation. The addition of 100 mM or 200 mM NaCl in M9 medium reduced the expression of lasI and rhlI significantly, while the expression levels of lasR and rhlR were only slightly reduced (data not shown). None of these conditions could account for the large induction of gene expression observed in the presence of sputum extracts.
FIG. 6.
Activation of QS gene expression by sputum extracts. The expression profiles of the promoter-reporter fusions were measured every 30 min for 30 h at 37°C in M9 minimal medium with glucose. The data are presented as cps × 10−3 (kcps) normalized to OD620. Panels A to F represent the profiles of lasI, lasR, aprA, rhlI, rhlR, and rhlA, correspondingly. Diamonds, triangles, and circles represent no addition, 2.5% sputum extract, and 5% sputum extract, respectively. Only every second data point is shown.
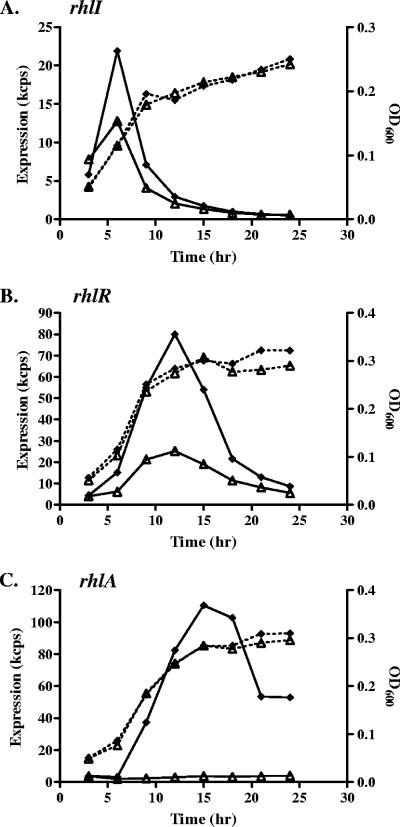
It has been shown that in the CF airways, P. aeruginosa lives in an anaerobic environment (35). We examined the expression of the QS genes under anaerobic conditions. The peak expression levels of the las genes were not significantly different in anaerobic and aerobic conditions in minimal medium with glucose; however, the temporal expression profiles differed with a short transient expression under anaerobic conditions (data not shown). A similar expression pattern was observed with the rhl system, but the rhlR expression increased about fourfold under the anaerobic condition (Fig. 7). The expression of rhlA was significantly enhanced under this condition as well. The elevated expression levels of rhlR and rhlA were repressed by the addition of 100 mM NaCl.
FIG. 7.
Expression profiles of rhlI, rhlR, and rhlA under microaerophilic conditions and the effect of NaCl. The expression profiles of the promoter-reporter fusions were measured every 3 h. The cultures were placed in an anaerobic jar and incubated at 37°C. (A) rhlI; (B) rhlR; (C) rhlA. Diamonds and open triangles represent expression with no addition and addition of 100 mM NaCl, respectively. The data are presented as cps × 10−3 (kcps) and are not normalized. Growth curves are represented by dashed lines.
DISCUSSION
QS systems play a central role in the regulation of P. aeruginosa pathogenesis and are considered global regulators affecting the expression of 353 to 616 genes (23, 32, 34). These systems themselves are regulated directly or indirectly by numerous transcriptional regulators. To further understand the expression of the P. aeruginosa QS systems in response to different growth conditions, we used a luxCDABE-based reporter system to examine the expression of the lasI-lasR genes and rhlI-rhlR genes as well as the QS-regulated virulence factor genes aprA and rhlA under 46 conditions. The results highlight the complexity in the regulation of these systems.
The correlation of QS gene expression profiles with QS signal production was validated by quantitating HSL in the cultures where expression data were collected. An rhlA-luxCDABE fusion was used for C4-HSL detection, and the A. tumefaciens system was used for 3-oxo-C12-HSL detection (2). Although the modified A. tumefaciens system is able to detect all HSLs that P. aeruginosa produces, it is 109 times more sensitive for 3-oxo-C12-HSL than for C4-HSL (2). The minimum concentration detectable for C4-HSL is 25 μM, which is above the physiologically relevant concentration of 10 μM in culture supernatant (16), making this detection system virtually a lasI-dependent HSL detection system. The rhlA-based C4-HSL detection system PAOJP2 (pKD-rhlA) was developed by fusing the C4-HSL-responsive rhlA promoter upstream of luxCDABE and putting the construct in a lasI-rhlI double-mutant background, PAOJP2 (17). The system was able to detect C4-HSL at a minimum concentration of 0.25 μM and can be used to determine C4-HSL. The correlation between the expression profiles of lasI and rhlI and their corresponding HSL products was generally consistent throughout the time course except at a later stage of growth under some conditions. It has to be taken into consideration that the profiles represent only transcriptional-level expression of the synthase genes. Once synthesized, the activity of the synthases and therefore HSL production will be dictated by other factors, including the stability of the proteins. Accumulated signal would not necessarily be reflected by the lasI and rhlI expression profiles, and the presence of HSL-degrading mechanisms also complicates the issue (11, 19). Nevertheless, the maximum expression values of lasI and rhlI are in clear accordance with the maximum amounts of 3-oxo-C12-HSL and C4-HSL, respectively.
Obtaining the temporal expression profiles of lasI, lasR, rhlI, and rhlR under 46 experimental conditions enabled systematic observation of the trends and changes of QS genes in response to environments. The data presented in Fig. 2, 3, and 4 indicate that the expression of QS, in terms of both magnitude and timing, was clearly dependent on the growth conditions. The cell densities at which QS was activated and at which the maximal expression level was reached varied dramatically. No correlation could be established between cell densities and the activation of QS expression over this range of conditions, indicating the absence of a specific cell density as a prerequisite for QS activation.
In M9 minimum medium and 1/4-diluted media, the peaks of lasI and rhlI expression were advanced to the exponential phase, while in rich media, the expression generally started at the early stationary phase (Fig. 3). A number of regulators have been shown to be involved in controlling the phase-dependent expression of QS genes. They include the stationary-phase sigma factor RpoS (22), the QS control repressor QscR (3), and the global posttranscriptional regulator RsmA (18). It is possible that these regulators behave differently in different media and result in changes of QS gene expression. It has also been reported that the QS in P. aeruginosa is connected with stress and nutrient status (27). It is tempting to postulate that all global regulatory systems, including QS, are connected with each other and have convergent effects on gene expression.
The functioning of QS depends on both autoinducer and the response regulator (receptor). However, the synthase genes and receptor genes are subject to various and sometimes different regulation processes (31). The discordance between lasI and lasR was obvious over the 46 conditions. This indicates that these genes can be independently regulated. The expression levels of rhlI and rhlR were better correlated under the conditions examined. These genes are subjected to autoregulation to a greater extent than the lasI-lasR genes, and this likely accounts for the coordinate expression under these conditions. The differences in activation of QS-regulated genes and the discordance between the synthase and receptor genes indicate that the QS regulation in P. aeruginosa is not straightforward, and the transcriptional regulators and cognate autoinducers may play different roles under different conditions.
Analysis of the data revealed that the timing and relative expression strength of these two systems also varied under different conditions, suggesting that the las system plays a dominant role under one condition and the rhl system under another. This is in agreement with the observation that in the biofilm, QS works differently from the planktonic environment (24). The hierarchic structure of the networks probably should be viewed as one state of a dynamic and flexible system. This flexibility probably enables different sets of genes to be regulated in response to changes in the environment.
The highest expression of the QS genes under all conditions tested was in the presence of CF sputum extract. There is evidence that autoinducers are present in sputa of CF patients who are infected by P. aeruginosa (8, 9, 13). The autoinducer present in the patient samples could activate the expression of QS genes; however, the high levels of activation seem to indicate that there are other factors that contribute to the activation observed. It has been reported that the host immune component interferon gamma could activate QS gene expression (36). It is possible that some of the activation could be due to the presence of this molecule in sputum extract. It is also likely that some other unknown small molecules in the sputum sample play a role in the induction of these systems. Studies are under way to try to identify the activating signal(s).
Regulation of gene expression through QS systems is a general mechanism employed by a number of bacteria. It is clear that these systems themselves can be subjected to a variety of regulatory inputs at the level of transcription. We observe that timing with respect to growth phase and cell density, as well as magnitude of expression, varies significantly under different conditions. While not all QS organisms will necessarily show the regulatory plasticity of P. aeruginosa, it is important to consider that these systems may vary under different growth conditions and that the notion of cell density will likely be condition dependent.
Acknowledgments
This research was supported by a grant from the Canadian Cystic Fibrosis Foundation. M.G.S. is a Canada Research Chair in Microbial Gene Expression and a Senior Scholar of Alberta Heritage Foundation for Medical Research (AHFMR). K.D. was supported in part by a grant from NSFC (30470098).
Footnotes
Published ahead of print on 20 April 2007.
REFERENCES
- 1.Cabrol, S., A. Olliver, G. B. Pier, A. Andremont, and R. Ruimy. 2003. Transcription of quorum-sensing system genes in clinical and environmental isolates of Pseudomonas aeruginosa. J. Bacteriol. 185:7222-7230. [DOI] [PMC free article] [PubMed] [Google Scholar]
- 2.Chambers, C. E., M. B. Visser, U. Schwab, and P. A. Sokol. 2005. Identification of N-acylhomoserine lactones in mucopurulent respiratory secretions from cystic fibrosis patients. FEMS Microbiol. Lett. 244:297-304. [DOI] [PubMed] [Google Scholar]
- 3.Chugani, S. A., M. Whiteley, K. M. Lee, D. D'Argenio, C. Manoil, and E. P. Greenberg. 2001. QscR, a modulator of quorum-sensing signal synthesis and virulence in Pseudomonas aeruginosa. Proc. Natl. Acad. Sci. USA 98:2752-2757. [DOI] [PMC free article] [PubMed] [Google Scholar]
- 4.Davies, D. G., M. R. Parsek, J. P. Pearson, B. H. Iglewski, J. W. Costerton, and E. P. Greenberg. 1998. The involvement of cell-to-cell signals in the development of a bacterial biofilm. Science 280:295-298. [DOI] [PubMed] [Google Scholar]
- 5.de Kievit, T. R., and B. H. Iglewski. 2000. Bacterial quorum sensing in pathogenic relationships. Infect. Immun. 68:4839-4849. [DOI] [PMC free article] [PubMed] [Google Scholar]
- 6.Duan, K., C. Dammel, J. Stein, H. Rabin, and M. G. Surette. 2003. Modulation of Pseudomonas aeruginosa gene expression by host microflora through interspecies communication. Mol. Microbiol. 50:1477-1491. [DOI] [PubMed] [Google Scholar]
- 7.Eisen, M. B., P. T. Spellman, P. O. Brown, and D. Botstein. 1998. Cluster analysis and display of genome-wide expression patterns. Proc. Natl. Acad. Sci. USA 95:14863-14868. [DOI] [PMC free article] [PubMed] [Google Scholar]
- 8.Erickson, D. L., R. Endersby, A. Kirkham, K. Stuber, D. D. Vollman, H. R. Rabin, I. Mitchell, and D. G. Storey. 2002. Pseudomonas aeruginosa quorum-sensing systems may control virulence factor expression in the lungs of patients with cystic fibrosis. Infect. Immun. 70:1783-1790. [DOI] [PMC free article] [PubMed] [Google Scholar]
- 9.Favre-Bonte, S., J. C. Pache, J. Robert, D. Blanc, J. C. Pechere, and C. van Delden. 2002. Detection of Pseudomonas aeruginosa cell-to-cell signals in lung tissue of cystic fibrosis patients. Microb. Pathog. 32:143-147. [DOI] [PubMed] [Google Scholar]
- 10.Fuqua, C., and E. P. Greenberg. 2002. Listening in on bacteria: acyl-homoserine lactone signalling. Nat. Rev. Mol. Cell Biol. 3:685-695. [DOI] [PubMed] [Google Scholar]
- 11.Huang, J. J., J. I. Han, L. H. Zhang, and J. R. Leadbetter. 2003. Utilization of acyl-homoserine lactone quorum signals for growth by a soil pseudomonad and Pseudomonas aeruginosa PAO1. Appl. Environ. Microbiol. 69:5941-5949. [DOI] [PMC free article] [PubMed] [Google Scholar]
- 12.Kim, E. J., W. Wang, W. D. Deckwer, and A. P. Zeng. 2005. Expression of the quorum-sensing regulatory protein LasR is strongly affected by iron and oxygen concentrations in cultures of Pseudomonas aeruginosa irrespective of cell density. Microbiology 151:1127-1138. [DOI] [PubMed] [Google Scholar]
- 13.Middleton, B., H. C. Rodgers, M. Camara, A. J. Knox, P. Williams, and A. Hardman. 2002. Direct detection of N-acylhomoserine lactones in cystic fibrosis sputum. FEMS Microbiol. Lett. 207:1-7. [DOI] [PubMed] [Google Scholar]
- 14.Ohman, D. E., J. C. Sadoff, and B. H. Iglewski. 1980. Toxin A-deficient mutants of Pseudomonas aeruginosa PA103: isolation and characterization. Infect. Immun. 28:899-908. [DOI] [PMC free article] [PubMed] [Google Scholar]
- 15.Olsen, R. H., G. DeBusscher, and W. R. McCombie. 1982. Development of broad-host-range vectors and gene banks: self-cloning of the Pseudomonas aeruginosa PAO chromosome. J. Bacteriol. 150:60-69. [DOI] [PMC free article] [PubMed] [Google Scholar]
- 16.Pearson, J. P., L. Passador, B. H. Iglewski, and E. P. Greenberg. 1995. A second N-acylhomoserine lactone signal produced by Pseudomonas aeruginosa. Proc. Natl. Acad. Sci. USA 92:1490-1494. [DOI] [PMC free article] [PubMed] [Google Scholar]
- 17.Pearson, J. P., E. C. Pesci, and B. H. Iglewski. 1997. Roles of Pseudomonas aeruginosa las and rhl quorum-sensing systems in control of elastase and rhamnolipid biosynthesis genes. J. Bacteriol. 179:5756-5767. [DOI] [PMC free article] [PubMed] [Google Scholar]
- 18.Pessi, G., F. Williams, Z. Hindle, K. Heurlier, M. T. Holden, M. Camara, D. Haas, and P. Williams. 2001. The global posttranscriptional regulator RsmA modulates production of virulence determinants and N-acylhomoserine lactones in Pseudomonas aeruginosa. J. Bacteriol. 183:6676-6683. [DOI] [PMC free article] [PubMed] [Google Scholar]
- 19.Roche, D. M., J. T. Byers, D. S. Smith, F. G. Glansdorp, D. R. Spring, and M. Welch. 2004. Communications blackout? Do N-acylhomoserine-lactone-degrading enzymes have any role in quorum sensing? Microbiology 150:2023-2028. [DOI] [PubMed] [Google Scholar]
- 20.Sambrook, J., and D. Russell. 2001. Molecular cloning: a laboratory manual, 3rd ed. Cold Spring Harbor Laboratory, Cold Spring Harbor, NY.
- 21.Schauder, S., K. Shokat, M. G. Surette, and B. L. Bassler. 2001. The LuxS family of bacterial autoinducers: biosynthesis of a novel quorum-sensing signal molecule. Mol. Microbiol. 41:463-476. [DOI] [PubMed] [Google Scholar]
- 22.Schuster, M., A. C. Hawkins, C. S. Harwood, and E. P. Greenberg. 2004. The Pseudomonas aeruginosa RpoS regulon and its relationship to quorum sensing. Mol. Microbiol. 51:973-985. [DOI] [PubMed] [Google Scholar]
- 23.Schuster, M., C. P. Lostroh, T. Ogi, and E. P. Greenberg. 2003. Identification, timing, and signal specificity of Pseudomonas aeruginosa quorum-controlled genes: a transcriptome analysis. J. Bacteriol. 185:2066-2079. [DOI] [PMC free article] [PubMed] [Google Scholar]
- 24.Singh, P. K., A. L. Schaefer, M. R. Parsek, T. O. Moninger, M. J. Welsh, and E. P. Greenberg. 2000. Quorum-sensing signals indicate that cystic fibrosis lungs are infected with bacterial biofilms. Nature 407:762-764. [DOI] [PubMed] [Google Scholar]
- 25.Smith, E. E., D. G. Buckley, Z. Wu, C. Saenphimmachak, L. R. Hoffman, D. A. D'Argenio, S. I. Miller, B. W. Ramsey, D. P. Speert, S. M. Moskowitz, J. L. Burns, R. Kaul, and M. V. Olson. 2006. Genetic adaptation by Pseudomonas aeruginosa to the airways of cystic fibrosis patients. Proc. Natl. Acad. Sci. USA 103:8487-8492. [DOI] [PMC free article] [PubMed] [Google Scholar]
- 26.Smith, R. S., and B. H. Iglewski. 2003. P. aeruginosa quorum-sensing systems and virulence. Curr. Opin. Microbiol. 6:56-60. [DOI] [PubMed] [Google Scholar]
- 27.Soberon-Chavez, G., M. Aguirre-Ramirez, and L. Ordonez. 2005. Is Pseudomonas aeruginosa only “sensing quorum”? Crit. Rev. Microbiol. 31:171-182. [DOI] [PubMed] [Google Scholar]
- 28.Stover, C. K., X. Q. Pham, A. L. Erwin, S. D. Mizoguchi, P. Warrener, M. J. Hickey, F. S. Brinkman, W. O. Hufnagle, D. J. Kowalik, M. Lagrou, R. L. Garber, L. Goltry, E. Tolentino, S. Westbrock-Wadman, Y. Yuan, L. L. Brody, S. N. Coulter, K. R. Folger, A. Kas, K. Larbig, R. Lim, K. Smith, D. Spencer, G. K. Wong, Z. Wu, I. T. Paulsen, J. Reizer, M. H. Saier, R. E. Hancock, S. Lory, and M. V. Olson. 2000. Complete genome sequence of Pseudomonas aeruginosa PA01, an opportunistic pathogen. Nature 406:959-964. [DOI] [PubMed] [Google Scholar]
- 29.Tateda, K., Y. Ishii, M. Horikawa, T. Matsumoto, S. Miyairi, J. C. Pechere, T. J. Standiford, M. Ishiguro, and K. Yamaguchi. 2003. The Pseudomonas aeruginosa autoinducer N-3-oxododecanoyl homoserine lactone accelerates apoptosis in macrophages and neutrophils. Infect. Immun. 71:5785-5793. [DOI] [PMC free article] [PubMed] [Google Scholar]
- 30.van Delden, C., R. Comte, and A. M. Bally. 2001. Stringent response activates quorum sensing and modulates cell density-dependent gene expression in Pseudomonas aeruginosa. J. Bacteriol. 183:5376-5384. [DOI] [PMC free article] [PubMed] [Google Scholar]
- 31.Venturi, V. 2006. Regulation of quorum sensing in Pseudomonas. FEMS Microbiol. Rev. 30:274-291. [DOI] [PubMed] [Google Scholar]
- 32.Wagner, V. E., D. Bushnell, L. Passador, A. I. Brooks, and B. H. Iglewski. 2003. Microarray analysis of Pseudomonas aeruginosa quorum-sensing regulons: effects of growth phase and environment. J. Bacteriol. 185:2080-2095. [DOI] [PMC free article] [PubMed] [Google Scholar]
- 33.Wagner, V. E., J. G. Frelinger, R. K. Barth, and B. H. Iglewski. 2006. Quorum sensing: dynamic response of Pseudomonas aeruginosa to external signals. Trends Microbiol. 14:55-58. [DOI] [PubMed] [Google Scholar]
- 34.Whiteley, M., K. M. Lee, and E. P. Greenberg. 1999. Identification of genes controlled by quorum sensing in Pseudomonas aeruginosa. Proc. Natl. Acad. Sci. USA 96:13904-13909. [DOI] [PMC free article] [PubMed] [Google Scholar]
- 35.Worlitzsch, D., R. Tarran, M. Ulrich, U. Schwab, A. Cekici, K. C. Meyer, P. Birrer, G. Bellon, J. Berger, T. Weiss, K. Botzenhart, J. R. Yankaskas, S. Randell, R. C. Boucher, and G. Doring. 2002. Effects of reduced mucus oxygen concentration in airway Pseudomonas infections of cystic fibrosis patients. J. Clin. Investig. 109:317-325. [DOI] [PMC free article] [PubMed] [Google Scholar]
- 36.Wu, L., O. Estrada, O. Zaborina, M. Bains, L. Shen, J. E. Kohler, N. Patel, M. W. Musch, E. B. Chang, Y. X. Fu, M. A. Jacobs, M. I. Nishimura, R. E. Hancock, J. R. Turner, and J. C. Alverdy. 2005. Recognition of host immune activation by Pseudomonas aeruginosa. Science 309:774-777. [DOI] [PubMed] [Google Scholar]
- 37.Yates, E. A., B. Philipp, C. Buckley, S. Atkinson, S. R. Chhabra, R. E. Sockett, M. Goldner, Y. Dessaux, M. Camara, H. Smith, and P. Williams. 2002. N-Acylhomoserine lactones undergo lactonolysis in a pH-, temperature-, and acyl chain length-dependent manner during growth of Yersinia pseudotuberculosis and Pseudomonas aeruginosa. Infect. Immun. 70:5635-5646. [DOI] [PMC free article] [PubMed] [Google Scholar]


