

Abstract
Phage λ lyses the host Escherichia coli at a precisely scheduled time after induction. Lysis timing is determined by the action of phage holins, which are small proteins that induce hole formation in the bacterium's cytoplasmic membrane. We present a two-stage nucleation model of lysis timing, with the nucleation of condensed holin rafts on the inner membrane followed by the nucleation of a hole within those rafts. The nucleation of holin rafts accounts for most of the delay of lysis after induction. Our simulations of this model recover the accurate lysis timing seen experimentally and show that the timing accuracy is optimal. An enhanced holin-holin interaction is needed in our model to recover experimental lysis delays after the application of membrane poison, and such early triggering of lysis is possible only after the inner membrane is supersaturated with holin. Antiholin reduces the delay between membrane depolarization and lysis and leads to an earlier time after which triggered lysis is possible.
Lytic bacteriophage irreversibly lyse their host bacteria at a precisely scheduled time after infection. This lysis releases phage progeny into the extracellular medium. Phage λ, which infects Escherichia coli, is the best-studied lytic bacteriophage (34, 35, 36), with an average lysis time after initial infection (tL) of 45 min (7, 15, 31). Individual cells lyse within ≈5 min of tL (δtL) (15), corresponding to a small fractional width δtL/tL of ≈0.1 and indicating tight regulation of lysis timing. While a narrow lysis width allows the phage to strike the best balance between early release and large numbers of phage progeny (33, 34), how precise timing is achieved by the phage has remained a mystery.
Phage λ needs two proteins to lyse its host. First, multiple copies of the “holin” protein, S105, are inserted into the inner membrane (IM), where they induce lesion formation (34, 35, 36). These IM lesions give the second protein, a muralytic endolysin, access to the peptidoglycan, which is then degraded (35). When endolysin is present, complete lysis of the host cell follows just seconds after the IM lesion formation (15), indicating that accurate lysis timing is controlled by the holin alone.
A third protein, the “antiholin” S107, forms inactive heterodimers with the holin in the IM (7, 16). Encoded by the same gene, S105 and S107 are produced at a constant ratio of 2:1 during infection, but no role in normal lysis timing has been identified for antiholin (7). Antiholin switches its role to function as a holin upon IM depolarization (2). The application of an energy poison, such as cyanide (KCN), triggers the collapse of the host proton motive force (PMF) and can lead to premature lysis (21, 30, 35).
Holin-mediated IM lesions function nonspecifically. Passage of proteins through holin lesions appears to be limited only by size (32). This suggests that holin lesions are holes in the host's inner membrane. It has been proposed that a raft with a critical number of membrane-associated holin molecules can promote the formation of an IM hole and stabilize it upon formation (32). Indeed, cross-linking studies have identified holin aggregates in the IM (37), indicating significant holin-holin interactions.
The nucleation of a new phase, such as a raft or a hole, from another is qualitatively well understood (17, 27). In homogeneous nucleation, the new phase is nucleated by thermal fluctuations. The nucleation rate depends upon the details of both the original and the final phases of the system and is proportional to the area of the original phase. The new phase starts with a nucleus of some minimal or critical size, which then spontaneously grows.
For phage λ, we propose that the lysis clock is controlled by two sequential nucleation events triggered by the accumulation of holin in the IM. Initially, holin that is inserted into the IM will form a dilute phase (Fig. 1, inset A) consisting largely of isolated holin monomers. After enough holin is inserted into the IM, the dilute phase will become supersaturated with holin (Fig. 1, inset B). The first nucleation event can then lead to the formation of a raft of holin, which is a stable cluster or domain of condensed holin phase (Fig. 1, inset C). The resulting holin rafts will coexist with the dilute holin “vapor,” and any remaining supersaturation or subsequent insertion of holin into the IM will cause the holin rafts to grow. Subsequently, when a holin raft reaches a critical size, hole nucleation can occur within the raft (Fig. 1, inset D). The first IM hole eliminates the PMF (effectively killing the cell), releases the endolysin into the periplasm, and quickly results in cell lysis.
FIG. 1.

Number of IM holin molecules versus time after phage induction. Four regimens (A to D) of our two-nucleation model are schematically illustrated in the inset and correspond to the times indicated on the graph. At early times (A and B) the number of holin molecules in a dilute phase of small clusters within the membrane (thick solid line) increases as more holin is inserted (IM). After the holin concentration becomes supersaturated on the IM (B), the nucleation of stable condensed rafts of holin (dotted line, including clusters with 20 or more holin) can occur (C). After the raft formation, holes can nucleate within the holin rafts (D). The total number of holin molecules in the IM is indicated by the thin solid line. The leftmost arrow indicates the equilibrium number of holin molecules in the IM; when the total amount of holin exceeds this value, the membrane is supersaturated with holin. After raft nucleation, the supersaturation of the dilute holin phase decreases rapidly towards a steady state at late times. The steady state is elevated with respect to equilibrium due to ongoing holin insertion. The experimental timing of hole nucleation, tL = 45 min, is indicated by the second arrow (D). This figure represents the average behavior over many bacteria, for the optimal holin interaction strength, Ĵ, as discussed in the text.
Holin is being continually produced within the bacterium and inserted into the IM, resulting in a time-dependent IM holin concentration (7). Since nonequilibrium holin configurations will be generated by the continued random holin insertion, we implement a lattice-gas Ising model (25) to represent holin monomers in the IM. An attractive interaction, J, between adjacent holin allows for raft formation, while conserved heat bath dynamics allows for isolated holin to randomly move within the membrane and for holin multimers to spontaneously associate and disassociate. Random realizations of holin insertion and motion in the IM allow us to explore variations in nucleation timing between bacteria. We simply parameterize the hole formation within rafts above a critical size, Ac, with a nucleation rate of Rh per unit area of the raft.
This two-nucleation picture of phage λ lysis raises some basic questions that we address in this paper. Can we constrain the model parameters with the available experimental phenomenology of phage λ lysis? Is the lysis timing optimized, or could small changes of the lysis dynamics lead to more accurate lysis timing? How much do the two nucleation events, raft and hole formation, contribute to the average lysis delay, tL? How much do they each contribute to the variation in the lysis timing, δtL? How much variability of lysis timing do we expect due to size variations of the host cells? Finally, can we add to our understanding of the role of antiholin in premature lysis?
MATERIALS AND METHODS
We use a square-lattice Ising model (25) with nearest-neighbor lattice-gas interactions to model holin aggregation in the E. coli IM. Conserved spin-exchange Metropolis dynamics were used to model holin movement, as well as association and disassociation of holin multimers. The holin interaction strength, J, scaled by the thermal energy corresponding to room temperature, kBT, is used in the Metropolis dynamics. Exact solutions of the Ising model allow the supersaturation threshold to be calculated from J/kBT (19). The critical raft size, Ac and the hole nucleation rate per holin, Rh, are used to determine the probability distribution of hole nucleation times from the holin cluster configurations seen in the Ising model. These model parameters are varied to achieve the experimentally observed average lysis time and lysis time variation.
Physical quantities.
We estimate some physical quantities from existing experimental studies. These include the size of each holin protein, Δx2; the surface area of the E. coli IM, L2Δx2; the time dependence of holin insertion in the IM; and the diffusion constant of holin within the IM, D.
Each holin is composed of three alpha-helical transmembrane domains (13). Alpha helices have a radius of exclusion of approximately 1 nm (3). Assuming that the helices are close packed in the membrane, the surface area of membrane covered by three domains is Δx2 = 2.39 nm2. We preserve this area per holin by assigning a nearest-neighbor distance of Δx to our Ising grid.
Approximating the rod-shaped E. coli cell as cylindrical with hemispherical caps of radius 0.5 μm and total cell length (l) of 3.05 μm, the surface area of the cell is approximately 9.6 × 10⁶ nm2. We represent the IM as a lattice of L × L possible holin sites, where L = 2,000 for l = 3.05 μm. We apply periodic boundary conditions to avoid unphysical edge effects in our model.
Single-molecule diffusion (D) of LamE in the E. coli outer membrane has been measured to be 70,000 nm2/s (26). We use this as an estimate of holin diffusion in the IM. This is within the range of diffusivities reported for single molecules diffusing in eukaryotic membranes (38) and is consistent with measurements by fluorescence recovery after photobleaching of both PleC-Yfp diffusion in the Caulobacter crescentus IM (9) and TatA-green fluorescent protein (GFP) diffusion in the E. coli IM (24). For spin-exchange Ising dynamics, D = Δx2/(4Δt), so a time step (Δt) of 8.55 ×10⁻⁶ s is used to recover D = 70,000 nm2/s.
Holin insertion.
Quantitative assays of the numbers of IM S holin and antiholin proteins indicate a 10-min delay after induction, an intermediate nonlinear regimen, and a late linear regimen with a constant S protein expression rate after 31.5 min (7). Given rapid cytoplasmic diffusivity (24), we randomly place holin into the IM. From the quantitative assays, and given the bacterial area, we estimate the late linear insertion rate for S proteins into the membrane h̃ to be 1.7 × 10⁻⁵/(nm2·min). Holin not sequestered into heterodimers accounts for a third of this total rate, h̃ = 5.67 × 10⁻⁶ (nm2·min). For our Ising model, this corresponds to a free holin insertion rate of h ≡ h̃Δx2Δt = 1.95 × 10⁻¹² per lattice site per time step. Every inserted holin is placed in a randomly chosen empty site on the lattice. At early times, the number of total S proteins is estimated from mRNA measurements as being quadratic in time (7), Searly = 3.95(t − 10)2, beginning at t = 10 min after induction. This results in a time-dependent insertion rate (h′) of 8.98 × 10⁻¹⁴(t − 10) per lattice site per time step, where t is the time after induction, measured in minutes. As shown in Fig. 1, h′ is used until t = 31.5 min, and then the constant insertion rate h is used. In systems with antiholin, PMF collapse is modeled by randomly inserting twice the existing amount of holin at the time of membrane poisoning, corresponding to the formerly sequestered holin-antiholin heterodimers.
Lysis probability statistics.
Random holin insertion, motion, association, and disassociation lead to a distinct time-dependent holin configuration for each computational run. This sample-to-sample variation captures the experimental variability between host cells of similar size. The sizes of distinct clusters of holin in the membrane are measured at 10-second intervals. From each independent sample α corresponding to a distinct cell, a time-dependent histogram, ρα(A,t), of holin cluster sizes (A) is obtained. The total number of holin molecules in system α at time t is then nα(t) = ΣAρα(A,t)A.
The probability per unit time of lysis occurring for a sample, Pα, is the product of the probability that the sample has not yet lysed and the lysis rate. The lysis rate is the product of the total size of holin clusters that are above the critical raft size,
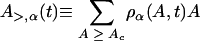 |
and the hole nucleation rate per holin Rh so that
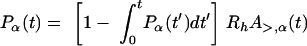 |
Lysis timing variance.
Steady-state cultures have a twofold range (10) and exponential distribution (28) of bacterial lengths. We measure average lysis times and variances for 20 cells of length l = 3.05 μm and 40 cells of length l = 1.52 μm. Because the variation of lysis times and variances is weak between these extreme cell lengths, to obtain size-weighted averages we linearly interpolate between these extremes and average over the exponential cell size distribution.
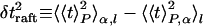
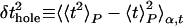
The total timing variance is given by
 |
where the angle brackets indicate the averages over the host population. The variance decomposes into three independent parts,
 |
 |
 |
where the angle brackets indicate averages over the lysis time for a single sample Pα(t), over the distinct samples at a given size, and over the sizes, as indicated by the subscripts P, α, and l, respectively. The average lysis time is tL = 〈t〉P,α,t. These three contributions to the timing variance can be thought of as due to raft nucleation variation, hole nucleation variation, and cell size variation, respectively (see Fig. 4A).
FIG. 4.

(A) Fractional width of lysis timing, δt/tL, versus critical raft size, Ac (measured in number of holins), weighted across cell sizes. The total fractional width (solid line, δtL/tL) has contributions from raft formation (dashed line, δtraft/tL), hole formation (dash-dotted line, δthole/tL), and cell size variance (dotted line, δtsize/tL). For an Ac of ≥10 the fractional width is small, approximately constant, and dominated by raft and hole formation dynamics. In this region, cell size variation is small. (B) Calculated hole nucleation rate, Rh, versus critical raft size, Ac, weighted across cell sizes. The hole nucleation rate is only slowly varying for an Ac of ≥10 due to rapid raft growth after raft nucleation. All data are for Ĵ = 4.64.
RESULTS
Constrained model is optimal.
For a given holin interaction and critical raft size, the hole nucleation rate per holin Rh was constrained by imposing the experimentally determined average lysis time tL = 45 min (7, 15, 31). Lysis timing and accuracy are sensitive to variations in the Ising interaction, J, describing holin interactions within the IM, as shown in Fig. 2. Only intermediate interaction strengths, J/kBT ≈ 4.6, result in raft nucleation with narrow fractional widths comparable to experimental values. Interactions below this failed to nucleate viable rafts before tL = 45 min. As seen in Fig. 3, interactions larger than this lead to early formation of holin rafts, at time traft, which leads to a correspondingly large variation in hole formation timing (see below). Nucleated holin rafts quickly grow (Fig. 1), but Ac must be smaller than typical raft sizes for lysis to be possible before tL. In the absence of precise measurements of Ac we use J/kBT = Ĵ ≡ 4.64, which leads to δtL/tL ≈ 0.09. A slightly smaller interaction, J/kBT = 4.60, leads to slightly later traft and a slightly narrower lysis width but has a sensitive dependence on Ac and requires Ac to be ≤40 to recover lysis.
FIG. 2.

Lysis timing accuracy, characterized by the fractional width δtL/tL versus the holin interaction strength J/kBT. The filled stars are for an Ac of 40, while the open stars are for an Ac of 20. A significant difference is seen only for the smallest J/kBT, where large rafts do not nucleate before lysis occurs. All data are weighted across cell sizes.
FIG. 3.

Average time of first raft nucleation traft versus the holin interaction strength J/kBT. Raft nucleation is taken to occur when a raft of 20 or more holin molecules is observed, corresponding to Fig. 1. Similar curves are obtained for other thresholds. Interactions with a J/kBT of less than 4.6 fail to nucleate large rafts before tL = 45 min (dotted line). As J/kBT decreases towards this threshold, the hole nucleation rate Rh must increase to recover lysis at tL. Vertical bars depict the standard deviation of traft over sampled cells, which increases with decreasing J/kBT. All data are weighted across cell sizes.
For accurate timing, a critical holin raft size Ac of ≥10 is necessary to avoid premature hole nucleation from small clusters in the dilute holin phase (regions A and B in Fig. 1). As seen in Fig. 4A, such early hole nucleation would lead to unacceptably large widths. This lower bound for Ac is only slightly above the lower bounds on the size of IM holin clusters seen in cross-linking experiments (37) or detergent extraction (34). As shown in Fig. 4B, the hole nucleation rate per holin Rh was approximately constant for an Ac of ≥10, with Rh = 1.51 × 10⁻³/(holin·min) for Ac = 40.
Since the best fractional width of our model approximately equals the experimental width (δtL/tL ≈ 0.1) (15), we conclude that phage λ timing accuracy appears to be optimal; we cannot significantly improve upon the experimental lysis timing accuracy by varying J. Significantly larger holin interaction strengths would lead to significantly less accurate lysis timing given the same average lysis time, while significantly smaller interactions are not consistent with lysis at tL. Our scaled holin interaction, Ĵ = 4.64, leads to an average line tension of holin rafts (σ) of 1.6kBT/nm (1). This is comparable to the generic 1 − 100kBT/protein line tension for proteins in bilayers predicted by Dan and Safran (8).
Holin raft formation dominates lysis delay, tL.
The assembly of the holin raft and its triggering into an IM lesion both contribute to lysis timing. However, for accurate lysis with δtL/tL of ≤0.1, lysis delay after induction is dominated by holin raft formation. As seen in Fig. 3, raft formation can occur arbitrarily close to the time of lysis. For Ĵ, holin raft formation (traft) occurs 3.5 min before lysis (tL), or 41.5 min after induction. The delay between induction and lysis is predominately for nucleation of holin rafts rather than the relatively rapid nucleation of holes within the rafts.
Size of the holin lesion.
Even the relatively small delay between raft and hole nucleation allows rafts to grow significantly at the expense of the holin supersaturation in the dilute phase, before the first IM hole is formed (Fig. 1). During normal lysis, the IM hole forms within a raft with an average size of 48 holin molecules (for a cell of length l of 3.04 μm). This raft size is consistent with the experimental lower bounds of a hole diameter of 10 nm (32), corresponding to at least 16 holin molecules (34).
Holin rafts continually decrease in number and increase in size after raft nucleation due to ongoing coarsening (4) driven by evaporation and condensation of holin from rafts. We find that there are 10 rafts per bacterium at the time of lysis, representing 36% of the free holin in the IM at that time. These results neglect any growth of raft size or of new raft nucleation due to antiholin activation after cell death.
Lysis timing variation, δt/tL.
In Fig. 4A, the total fractional timing variation, δtL/tL, can be decomposed into three independent contributions. The first (δtraft/tL) is due to variabilities in the cluster size distribution of IM holin between different cells. Most of this contribution is simply the timing variability of the holin raft nucleation. The second (δthole/tL) is due to the variability of the hole nucleation that occurs after holin rafts are formed. The third (δtsize/tL) is due to the variability of lysis times between the host cells of different sizes expected in a broth culture. These contributions add in quadrature to give the total fractional timing variation.
For our holin interaction, Ĵ, the raft nucleation timing and hole nucleation timing contribute approximately equally to the total timing variation for an Ac of ≥10. Because of rapidly growing clusters following raft nucleation, the subsequent hole nucleation is essentially a random process that has mean and standard deviation times that are both of order tL − traft. As a result, significantly stronger interactions than Ĵ will lead to earlier raft nucleation and much larger δtL/tL, as seen in Fig. 2. Conversely, weaker interactions can decrease δthole but cannot significantly decrease the overall δtL, which will then be dominated by δtraft and δtsize. Any improvement is also limited by the requirement that traft be less than tL, as illustrated in Fig. 3. To accommodate lysis at tL, the hole nucleation rate per holin, Rh, would have to diverge as traft approaches tL. As a result, our nucleation rate for Ĵ provides an effective lower bound for the in vivo hole nucleation rate, consistent with the observed timing variations.
A natural twofold variation of cell size is expected at the time of phage infection (10), and we therefore investigated the role of host cell size in lysis timing. The holin interaction and nucleation parameters are independent of cell size, and we approximate the total rate of insertion of holin per unit area into the IM (h̃) as being independent of cell size. Since the total raft nucleation rate will scale with the system area, we expect and find that smaller cells nucleate rafts and lyse systematically later. The timing variation is also systematically larger for smaller cells. However, for our holin interaction Ĵ, the size-dependent delay for a twofold variation in cell size is only on the order of 1 minute. The contribution of cell size variation to the total timing variation, at Ĵ, is consequently small (Fig. 4A).
PMF collapse strengthens holin-holin interaction.
Lysis timing experiments have typically been done with inducible lysogens that produce no antiholin and yield only half the wild-type amount of holin, thus generating the same amount of active holin as seen in wild-type cells (32). Figure 5 indicates the experimental delay until lysis after energy poison (KCN) is added to such a system (32) and the expected delay if the normal lysis time (tL = 45 min) is unchanged by the KCN. Since cell death due to the PMF collapse triggered by the energy poison will halt further production and insertion of holin into the IM, we might expect longer delays than with no KCN. Instead, poisoned cells without antiholin lyse before unpoisoned cells. Figure 5 indicates the delay until lysis after poisoning in our model using Ĵ. These points are not consistent with the experimental results.
FIG. 5.

Delay of lysis from time of poison application, (tL − tKCN) versus time of poisoning during premature lysis (tKCN). Without antiholin and with a PMF-independent holin interaction (Ĵ), our model predicts that KCN-triggered lysis (×) will be delayed compared with normal lysis at tL = 45 min (dotted line). In contrast, experimental delays (open stars, estimated from reference 32) lie below the dotted line, suggesting an enhanced holin interaction in a depolarized membrane (J′ = 5.229) (filled circles, with antiholin; filled squares, without antiholin). Vertical bars depict the standard deviation of lysis timing over sampled cells, and this systematically increases with earlier KCN application. Errors are approximately 5 times smaller than standard deviations. All data are for l = 3.04 μm.
As lysis timing remains dominated by raft formation, the short experimental lysis delay following poison application suggests that the parameter governing holin aggregation—the holin interaction—may be increased upon membrane depolarization. Accordingly, we maintained the interaction Ĵ = 4.64 during holin insertion but changed the interaction after PMF collapse. As shown in Fig. 5, a stronger interaction after PMF collapse, J/kBT = J′ ≡ 5.229, fits the experimental data timing estimated from reference 32. This increase in interaction strength after PMF collapse enables the earlier raft nucleation required for lysis at the experimentally observed times.
We are not aware of any studies of PMF effects on interactions between integral membrane proteins. However, PMF has a significant impact on the function of a number of integral membrane proteins, such as the opening of voltage-gated ion channels (6), the rotation rate of flagellar motors (12), Tsr receptor activation (11), and, of course, the configuration change of antiholin upon PMF collapse (2). It is plausible that PMF collapse affects the holin interactions. The modest 13% increase of holin-holin interactions that we predict leads to significantly more rapid lysis upon KCN application, as shown in Fig. 5, because of the cooperative nature of raft nucleation.
Triggered lysis requires a tKCN greater than tmin.
Successful lysis requires the nucleation of a holin raft in the IM, which can occur only after the IM is supersaturated with holin. For energized membranes, supersaturation occurs 26 min after lytic induction, using Ĵ. Normally, raft nucleation is very slow close to the supersaturation threshold (17) and only occurs 16.8 min later (on average) when the supersaturation is large. In contrast, holin insertion ceases upon KCN poisoning. Subsequent raft nucleation will be wholly determined by the supersaturation at the time of poisoning. With the enhanced interaction, J′, we find that the IM with a collapsed PMF is supersaturated with holin at a tmin of 19 min. After antiholin is included, where the holin content of the IM is tripled at tKCN, then supersaturation is reached at a tminAH of 15 min. No holin-induced lysis will occur for KCN application before tmin, or before tminAH with antiholin. Equivalently, tL −tKCN, the delay between KCN application and lysis, will diverge as tKCN approaches tmin.
Systems with antiholin could lyse in response to PMF collapse only shortly after substantial holin expression begins (Fig. 1). However, since complete phage assembly begins only 20 min after induction (35), which is longer than both tmin and tminAH, any phage that have been assembled at tKCN will eventually be released even without antiholin.
Effects of antiholin with membrane poisoning.
Because both raft nucleation and hole nucleation are faster with more holin present, we expect and observe in Fig. 5 that there is a shorter delay between IM poisoning and lysis for systems with antiholin than for those without. We also see that the variation of lysis times grows wider for earlier tKCN. Qualitatively, we observe smaller rafts at the time of lysis for earlier tKCN, which is consistent with both the longer delay until lysis and the larger variation of lysis times.
The sudden increase of supersaturation upon PMF collapse, through the sudden release of sequestered holin-antiholin when antiholin is present and through the predicted increase in holin interactions through J′, immediately leads to a number of holin rafts on the IM. These rafts subsequently combine through coarsening mechanisms (4). With antiholin the total number of holin molecules contributing to lysis is much larger, lysis occurs earlier, and we observe more rafts at tL. Up to 3 rafts are seen on average for tKCN near tL without antiholin, while as many as 14 rafts are observed for tKCN near tL with antiholin. As a result of coarsening during the long delay until lysis, the number of rafts reduces towards one for tKCN near tminAH or tmin, for systems with or without antiholin, respectively.
DISCUSSION
Our model is successful in matching the accurate lysis clock of λ phage infection of E. coli. The holin-controlled lysis timing can be described by the formation of holin rafts in the bacterial inner membrane (IM) due to nucleation from a dilute phase and the subsequent nucleation of transmembrane holes within those holin rafts. Nonspecific holin interactions are used with random thermal association and disassociation, together with random IM motion and holin insertion. The result is a simple but accurate lysis clock.
The holin interaction, J, and hole nucleation rate per holin, Rh, both control the average lysis time, tL, and the timing accuracy, δtL/tL. It has been argued that the tradeoff between the number of phage progeny produced by a single host cell and the early exploitation of other host cells by those progeny leads to an optimal lysis time (33, 34). This would imply that it is advantageous to the phage to have this optimal lysis time together with the narrowest possible timing accuracy. Consistent with that, as shown in Fig. 2, we cannot significantly improve upon the experimental lysis timing accuracy by varying J. With respect to the holin interactions, we conclude that lysis timing is optimal in phage λ.
Our quantitative two-stage nucleation model of lysis timing builds upon the qualitative but essentially correct “holin raft followed by hole formation” picture described by Wang et al. (32). Their model has holins oligomerizing on the membrane to form rafts. Thermal fluctuations then initiate hole formation (32). Within our model, holin is inserted into the IM, where the proteins form small transient clusters because of attractive interactions, J/kBT. Later, as the IM becomes supersaturated with holin, large stable holin rafts are able to nucleate. The holin supersaturation feeds rapid raft growth, which hastens hole nucleation, through Rh, producing IM lesions. Significantly, by including random nucleations, we can characterize the variations of lysis timing.
We also find that upon IM depolarization, the holin interaction must be moderately increased to recover the experimental observation of earlier-than-normal lysis (32). This enhanced interaction J′ allows lysis more than 10 minutes earlier in the absence of antiholin than does the energized interaction Ĵ. Graded PMF dependence of this enhancement would lead to the graded response to membrane poison seen by Gründling et al. (15) in the absence of antiholin.
What are the advantages for phage λ to have two-stage nucleation controlling lysis? In the region of weak holin interactions, the IM holin would not become supersaturated, although thermal fluctuations could still generate transient holin clusters without stable raft nucleation. These transient clusters could then be used to nucleate holes and lead to lysis at tL, provided that the hole nucleation rate was small enough. However, since the thermally induced holin clusters would be present from early times, the hole nucleation would take place over most of tL, and large timing inaccuracies would result. The advantages of the first nucleation, of condensed holin rafts from a supersaturated but dilute holin phase, are that it delays the onset of raft formation and that once formed, the rafts grow quickly from the supersaturation. Both of these effects reduce δthole. The second nucleation stage is needed because it allows hole formation to occur only in large stable rafts. If holin clusters smaller than an Ac of ≈10 could form holes, then lysis would again be spread out over much of tL, leading to large inaccuracies, as illustrated in Fig. 4. We believe that only two-stage nucleation can lead to the delayed but accurate lysis timing observed in this simple system.
Direct measurement of our model parameters would be useful, though difficult. The hole nucleation rate per holin, Rh, or the critical raft size, Ac, would require in vitro studies that could image holes within holin rafts in real time. These experiments may now be possible with holin overexpression systems (31) and atomic force microscopy techniques (20). The holin interactions J could be measured using GFP-holin fusions and fluctuation correlation spectroscopy techniques (23), as long as the holin concentration is kept below supersaturation in the experimental membrane. This approach could also, with energized membranes, directly test our predicted interaction enhancement J′.
Existing measurements of the IM holin insertion rate (h̃) and single-molecule diffusion rate (D) and estimates of holin size (Δx) are inputs to our calculations. Growth conditions and the bacterial strain used would both be expected to affect h̃. Refined measurements of D for holin in the IM, or of h̃, would affect the quantitative predictions of our model. Fortunately, the qualitative picture of holin function provided by our model is independent of these parameters, as is the efficacy of the two-stage nucleation scheme.
There are a number of novel and specific qualitative predictions that arise from our detailed model, though many would require a GFP-holin fusion system to be tested. Precise lysis timing implies late raft nucleation, and we predict that in normal lysis, as many as 10 rafts will form per cell. The rafts will form only a few minutes before lysis occurs, so there will not be large IM rafts for most of the lytic delay. Extremely slow raft nucleation near the supersaturation threshold (17) implies that raft formation will occur only with a significant supersaturation of holin in the IM. Any delay between raft formation and lysis then means that the IM rafts will end up with a significant fraction of the IM holin at the expense of the supersaturation and that the dilute holin component in the IM should be visibly reduced by the time lysis occurs. Early induction of lysis with a membrane poison should lead to stronger holin interactions, effectively enhancing the supersaturation, which will lead to more membrane rafts before lysis—even in systems without antiholin.
Additionally, several qualitative predictions could be tested with current experimental systems. We predict a threshold time tmin before which the IM is no longer supersaturated with holin and so before which raft formation and subsequent hole formation will not take place. This threshold time is earlier in the presence of antiholin, (tminAH). We also find that timing inaccuracies increase with earlier membrane poisoning, due to smaller amounts of holin in rafts. Finally, we predict a modest but significant host size dependence of lysis timing, with larger cells lysing systematically earlier, that could be explored with single-cell studies such as those done previously (15).
Within our model, antiholin appears to provide quantitative rather than qualitative advantages to the phage, leading to an earlier and much quicker (Fig. 5) response to membrane poisoning. We even expect that, like the antiholin, holin has a stronger activity when the PMF is reduced. However, given that the holin enhancement would probably be reversible, while the activation of antiholin by the insertion of its third antiholin domain into the IM (2) is probably irreversible, this may allow antiholin but not holin to significantly respond to the transient PMF disruptions associated with infection by competing phage (22).
The holin clock is very sensitive to holin interactions on the bacterial IM. As shown in Fig. 3, a 10% increase of the holin interaction J leads to more than a 50% increase of the raft nucleation time and hence of the lysis time. This could explain the marked lability of phage λ lysis timing under systematic point-directed mutagenesis (14, 29) and, presumably, in the wild. With a fixed Rh, slightly decreasing J leads to later lysis and less accurate timing (Fig. 3), while increasing J leads to earlier lysis and slightly better timing. While a strongly decreasing Rh with a fixed J similarly leads to later lysis and significantly less accurate timing, increasing Rh does not significantly shorten the lysis timing or improve the timing accuracy, since hole nucleation is already relatively fast. The observation of mutant holin with significantly earlier lysis (14) therefore implies that the holin-holin interactions are affected for those holins. The lysis width appears to broaden significantly for very late lysis mutants, but this is consistent with either Rh or J being affected by the mutations. More detailed lysis curves would be needed to distinguish the contributions from Rh and/or J in lysis timing variation for holin mutants.
The collective effects of holin interactions in condensed holin rafts may allow for a more sensitive control of lysis timing than the global lysis mechanisms postulated for the action of amphiphilic antimicrobial peptides (18), which simply have to kill quickly rather than to adjust to variable host populations (34). Nevertheless, it remains to be seen whether the various barrel stave, carpet, and toroidal models of pore formation postulated for the action of antimicrobial peptides (see, e.g., reference 5) may sometimes occur only within condensed nucleated rafts as described here for the holin protein of phage λ.
Acknowledgments
We thank Ry Young for discussions.
This work was supported by the Natural Science and Engineering Research Council of Canada (NSERC) and the Izaak Walton Killam Memorial Trusts.
Footnotes
Published ahead of print on 27 April 2007.
REFERENCES
- 1.Avron, J. E., H. van Beijeren, L. S. Schulman, and R. K. P. Zia. 1982. Roughening transition, surface tension and equilibrium droplet shapes in a two-dimensional Ising system. J. Phys. A 15:L81-L86. [Google Scholar]
- 2.Bläsi, U., C. Y. Chang, M. T. Zagotta, K. Nam, and R. Young. 1990. The lethal lambda S gene encodes its own inhibitor. EMBO J. 9:981-989. [DOI] [PMC free article] [PubMed] [Google Scholar]
- 3.Bowie, J. U. 1997. Helix packing in membrane proteins. J. Mol. Bacteriol. 272:780-789. [DOI] [PubMed] [Google Scholar]
- 4.Bray, A. J. 2002. Theory of phase-ordering kinetics. Adv. Phys. 51:481-587. [Google Scholar]
- 5.Brogden, K. A. 2005. Antimicrobial peptides: pore formers or metabolic inhibitors in bacteria? Nat. Rev. Microbiol. 3:238-250. [DOI] [PubMed] [Google Scholar]
- 6.Catterall, W. A. 1995. Structure and function of voltage-gated ion channels. Annu. Rev. Biochem. 64:493-531. [DOI] [PubMed] [Google Scholar]
- 7.Chang, C. Y., K. Nam, and R. Young. 1995. S gene expression and the timing of lysis by bacteriophage λ. J. Bacteriol. 177:3283-3294. [DOI] [PMC free article] [PubMed] [Google Scholar]
- 8.Dan, N., and S. A. Safran. 1998. Effect of lipid characteristics on the structure of transmembrane proteins. Biophys. J. 75:1410-1414. [DOI] [PMC free article] [PubMed] [Google Scholar]
- 9.Deich, J., E. M. Judd, H. H. McAdams, and W. E. Moerner. 2004. Visualization of the movement of single histidine kinase molecules in live Caulobacter cells. Proc. Natl. Acad. Sci. USA 101:15921-15926. [DOI] [PMC free article] [PubMed] [Google Scholar]
- 10.Donachie, W. D., K. J. Begg, and M. Vicente. 1976. Cell length, cell growth and cell division. Nature 264:328-333. [DOI] [PubMed] [Google Scholar]
- 11.Edwards, J. C., M. S. Johnson, and B. L. Taylor. 2006. Differentiation between electron transport sensing and proton motive force sensing by the Aer and Tsr receptors for aerotaxis. Mol. Microbiol. 62:823-837. [DOI] [PMC free article] [PubMed] [Google Scholar]
- 12.Fung, D. C., and H. C. Berg. 1995. Powering the flagellar motor of Escherichia coli with an external voltage source. Nature 375:809-812. [DOI] [PubMed] [Google Scholar]
- 13.Gründling, A., U. Bläsi, and R. Young. 2000. Biochemical and genetic evidence for three transmembrane domains in the class I holin, λ S. J. Biol. Chem. 275:769-776. [DOI] [PubMed] [Google Scholar]
- 14.Gründling, A., U. Bläsi, and R. Young. 2000. Genetic and biochemical analysis of dimer and oligomer interactions of the λ S holin. J. Bacteriol. 182:6082-6090. [DOI] [PMC free article] [PubMed] [Google Scholar]
- 15.Gründling, A., M. D. Manson, and R. Young. 2001. Holins kill without warning. Proc. Natl. Acad. Sci. USA 98:9348-9352. [DOI] [PMC free article] [PubMed] [Google Scholar]
- 16.Gründling, A., D. L. Smith, U. Bläsi, and R. Young. 2000. Dimerization between the holin and holin inhibitor of phage λ. J. Bacteriol. 182:6075-6081. [DOI] [PMC free article] [PubMed] [Google Scholar]
- 17.Gunton, J. D. 1999. Homogeneous nucleation. J. Stat. Phys. 95:903-923. [Google Scholar]
- 18.Huang, H. W., F. Y. Chen, and M. T. Lee. 2004. Molecular mechanism of peptide-induced pores in membranes. Phys. Rev. Lett. 92:198304. [DOI] [PubMed] [Google Scholar]
- 19.Huang, K. 1987. Statistical mechanics. John Wiley & Sons, New York, NY.
- 20.Ikai, A., and R. Afrin. 2003. Toward mechanical manipulations of cell membranes and membrane proteins using an atomic force microscope: an invited review. Cell. Biochem. Biophys. 39:257-278. [DOI] [PubMed] [Google Scholar]
- 21.Josslin, R. 1971. Physiological studies on the t gene defect in T4-infected Escherichia coli. Virology 44:101-107. [DOI] [PubMed] [Google Scholar]
- 22.Labedan, B., and L. Letellier. 1981. Membrane potential changes during the first steps of coliphage infection. Proc. Natl. Acad. Sci. USA 78:215-219. [DOI] [PMC free article] [PubMed] [Google Scholar]
- 23.Lippincott-Schwartz, J., E. Snapp, and A. Kenworthy. 2001. Studying protein dynamics in living cells. Nat. Rev. Mol. Cell. Biol. 2:444-456. [DOI] [PubMed] [Google Scholar]
- 24.Mullineaux, C. W., A. Nenninger, N. Ray, and C. Robinson. 2006. Diffusion of green fluorescent protein in three cell environments in Escherichia coli. J. Bacteriol. 188:3442-3448. [DOI] [PMC free article] [PubMed] [Google Scholar]
- 25.Newman, M., and G. T. Barkema. 1999. Monte Carlo methods in statistical physics. Oxford University Press, Oxford, United Kingdom.
- 26.Oddershede, L., H. Flyvberg, and K. Berg-Sørenson. 2003. Single-molecule experiment with optical tweezers: improved analysis of the diffusion of the λ-receptor in E. coli's outer membrane. J. Phys. Condens. Matter 15:S1737-S1746. [Google Scholar]
- 27.Oxtoby, D. W. 1992. Homogeneous nucleation: theory and experiment. J. Phys. Condens. Matter 4:7627-7650. [Google Scholar]
- 28.Powell, E. O. 1956. Growth rate and generation time of bacteria, with special reference to continuous culture. J. Gen. Microbiol. 15:492-511. [DOI] [PubMed] [Google Scholar]
- 29.Raab, R., G. Neal, C. Sohaskey, J. Smith, and R. Young. 1988. Dominance in lambda S mutations and evidence for translational control. J. Mol. Biol. 199:95-105. [DOI] [PubMed] [Google Scholar]
- 30.Reader, R. W., and L. Siminovitch. 1971. Lysis defective mutants of bacteriophage lambda: genetics and physiology of S cistron mutants. Virology 43:607-622. [DOI] [PubMed] [Google Scholar]
- 31.Smith, D. L., C. Y. Chang, and R. Young. 1998. The λ holin accumulates beyond the lethal triggering concentration under hyperexpression conditions. Gene Expr. 7:39-52. [PMC free article] [PubMed] [Google Scholar]
- 32.Wang, I. N., J. Deaton, and R. Young. 2003. Sizing the holin lesion with an endolysin-beta-galactosidase fusion. J. Bacteriol. 185:779-787. [DOI] [PMC free article] [PubMed] [Google Scholar]
- 33.Wang, I. N., D. E. Dykhuizen, and L. B. Slobodkin. 1996. The evolution of phage lysis timing. Evol. Ecol. 10:545-558. [Google Scholar]
- 34.Wang, I. N., D. L. Smith, and R. Young. 2000. Holins: the protein clocks of bacteriophage infections. Annu. Rev. Microbiol. 54:799-825. [DOI] [PubMed] [Google Scholar]
- 35.Young, R. 1992. Bacteriophage lysis: mechanism and regulation. Microbiol. Rev. 56:430-481. [DOI] [PMC free article] [PubMed] [Google Scholar]
- 36.Young, R., I. N. Wang, and W. D. Roof. 2000. Phages will out: strategies of host cell lysis. Trends Microbiol. 8:120-128. [DOI] [PubMed] [Google Scholar]
- 37.Zagotta, M. T., and D. B. Wilson. 1990. Oligomerization of the bacteriophage lambda S protein in the inner membrane of Escherichia coli. J. Bacteriol. 172:912-921. [DOI] [PMC free article] [PubMed] [Google Scholar]
- 38.Zhang, F., M. Lee, and K. Jacobson. 1993. Protein lateral mobility as a reflection of membrane microstructure. Bioessays 15:579-588. [DOI] [PubMed] [Google Scholar]