

Abstract
Mobile genetic elements have the potential to influence the expression of genes surrounding their insertion site upon invasion of a genome. Here, we examine the transcriptional organization of a ribonucleotide reductase operon (nrd) that has been invaded by an HNH family homing endonuclease, mobE. In Aeromonas hydrophila phage Aeh1, mobE has inserted into the large-subunit gene (nrdA) of aerobic ribonucleotide reductase (RNR), splitting it into two smaller genes, nrdA-a and nrdA-b. This gene organization differs from that in phages T4, T6, RB2, RB3, RB15, and LZ7, where mobE is inserted in the nrdA-nrdB intergenic region. We present evidence that the expression of Aeh1 mobE is regulated by transcriptional, posttranscriptional, and translational controls. An Aeh1-specific late promoter drives expression of mobE, but strikingly the mobE transcript is processed internally at an RNase E-like site. We also identified a putative stem-loop structure upstream of mobE that sequesters the mobE ribosome binding site, presumably acting to down regulate MobE translation. Moreover, our transcriptional analyses indicate that the surrounding nrd genes of phage Aeh1 are expressed by a different strategy than are the corresponding phage T4 genes and that transcriptional readthrough is the only mechanism by which the promoterless Aeh1 nrdB gene is expressed. We suggest that the occurrence of multiple layers of control to limit the expression of mobE to late in the Aeh1 infection cycle is an adaptation of Aeh1 to reduce any effects on expression of the surrounding nrd genes early in phage infection when RNR function is critical.
Homing endonucleases are a distinctive class of site-specific yet sequence-tolerant DNA endonucleases that promote the mobility of themselves and surrounding genomic sequence to genomes lacking the endonuclease by a process termed homing (reviewed in reference 3). Homing endonuclease genes are often found within self-splicing group I or II introns (3, 30) or inteins (20, 21), but many bacterial and phage genomes encode a large number of so-called freestanding endonucleases, i.e., the genomes carry endonuclease genes that are not obviously encoded within self-splicing elements (13, 29, 40, 54). Experimental evidence to date suggests that freestanding endonucleases are also mobile genetic elements, promoting their spread to genomes lacking the endonuclease by a double-strand break (DSB) repair pathway termed intronless homing (4, 28, 33, 51). Database surveys of sequenced bacterial and phage genomes have revealed that freestanding endonucleases are more abundant than intron- or intein-encoded versions, which is particularly evident in the T-even-like phages (29, 40, 44, 54). Phage T4, for instance, is infested with 15 homing endonucleases, representing ∼10% of the coding potential of the genome; 13 of these endonucleases are freestanding (40).
Whereas the mobility pathways of intron-encoded and freestanding endonucleases are well described (4, 33, 41, 46), comparatively little is known regarding the regulation of homing endonuclease expression. In particular, many freestanding endonuclease genes in phage genomes lack recognizable promoters or ribosome binding sites (RBSs), raising the question of how these genes are expressed. Furthermore, because many freestanding endonuclease genes are inserted between conserved and functionally critical phage genes (13, 40, 48), the impact of endonuclease gene insertion on the transcriptional regulation of neighboring genes is an outstanding question.
Transcriptional regulation plays a critical role in T-even phage development by determining the temporal order in which phage genes are expressed postinfection (reviewed in reference 40). Phage T4, for instance, executes a well-documented takeover of the transcriptional machinery of Escherichia coli by subverting the host RNA polymerase to transcribe phage genes preferentially over E. coli genes (40). Three temporal classes of transcripts, regulated by early, middle, and late phage promoters, orchestrate the synthesis of phage genes. Among the phage genes that are transcribed early after infection are those whose products are involved in the synthesis of precursors for DNA replication (6, 8), including the nrdA and nrdB genes encoding the large and small subunits of the class Ia aerobic ribonucleotide reductase (RNR), respectively (59, 60). In phage T4-infected cells, transcription of T4 nrdA and nrdB is tightly coordinated to ensure the maximal level of RNR activity early in T4 infection before the onset of DNA replication (59, 60).
Interestingly, the well-conserved nrd genomic region of T-even-like phage is a common target of homing endonucleases, as evidenced by the occurrence of both intron-encoded and freestanding homing endonuclease genes in a number of T-even phages (39, 40, 44, 51, 52). Of particular interest is the freestanding HNH family endonuclease gene mobE, inserted in the nrdA-nrdB intergenic region of phages T4, T6, RB2, RB3, RB15, and LZ7 (44, 51). Genetic evidence suggests that mobE spreads between genomes, as crosses between phages containing mobE and phages lacking mobE revealed a >95% frequency of inheritance of mobE in progeny (33, 51). MobE likely possesses a recognition and cleavage site within or near the nrdA or nrdB coding region.
We recently described a novel gene arrangement created by the insertion of the mobE gene into the nrdA coding region of Aeromonas hydrophila T-even-like phage Aeh1 (18). The insertion fragments the Aeh1 nrdA gene at the active site, creating two smaller genes (nrdA-a and nrdA-b) that each encode active-site residues of RNR. The mobE insertion is not a self-splicing intron or intein and, despite the absence of splicing, is not inactivating for NrdA function. We showed that the NrdA-a and NrdA-b proteins form a complex with the small-subunit NrdB protein, reconstituting a functional class Ia RNR activity by creating a composite active site with each protein providing functionally critical residues.
Here, we investigate the Aeh1 nrd operon with the goal of elucidating the regulation of mobE from the standpoint of its effect on expression of the surrounding nrd genes. Our transcriptional data, the first for phage Aeh1, suggest that regulation of the nrd and mobE genes employs a different strategy than does that of the corresponding genes of phage T4. Furthermore, we present evidence that expression of Aeh1 mobE is subject to strong negative regulation that limits MobE function to late in the Aeh1 infective cycle. We suggest that the multiple layers of control that regulate mobE function are adaptations of phage Aeh1 to limit the consequences of the mobE insertion into a critical gene of nucleotide metabolism.
MATERIALS AND METHODS
Bacterial strains, phage, and growth conditions.
Escherichia coli DH5α was used for plasmid construction and propagation, while strain INVαF′ (Invitrogen) was used for the cloning of 5′- and 3′-RLM-RACE (RNA ligase-mediated rapid amplification of cDNA ends) products. E. coli strains were grown in LB medium supplemented with the appropriate antibiotics (ampicillin, 100 μg/ml; kanamycin, 50 μg/ml). A. hydrophila strain C-1 was used to propagate bacteriophage Aeh1 in tryptic soy broth medium (EMD Bioscience) as previously described (18).
Isolation of Aeh1 genomic DNA.
Genomic DNA was extracted from 500 μl of a 2 × 10¹¹-PFU/ml phage stock. The phage were mixed with equal volumes of phenol-chloroform, mixed for 5 min by inverting the tube repeatedly, and spun for 5 min at 5,000 × g. This was repeated four times before ethanol precipitation and resuspension in 50 μl Tris-EDTA buffer (10 mM Tris-Cl, pH 8, 1 mM EDTA).
PCR.
All amplification reactions were performed with a Biometra Thermocycler programmed for 35 cycles with annealing temperatures specific for each primer pair. Products were amplified from Aeh1 genomic DNA (gDNA) using Taq DNA polymerase (New England Biolabs [NEB]) and purified using a QIAGEN PCR purification kit or purified from agarose gels using a QIAGEN gel purification kit according to the manufacturer's instructions. Primers were designed manually using the Aeh1 genome sequence (NC_005260), and a complete list of all primers used can be found in Table 1.
TABLE 1.
Primers used in this study
| Name | Purpose | Oligonucleotide sequence (5′-3′) | Position in Aeh1 genome (AY266303.2) |
|---|---|---|---|
| DE-3 | Northern probe; mobE PCR | GGAATTCCATATGAATTATAAGAGAATACACG | 43162-43139 + NdeI site |
| DE-4 | Northern probe; mobE PCR | CGGGATCCTCATCATGTTCGATCATTTTCTC | 42447-42466 + BamHI site |
| DE-15 | Northern probe; nrdA-a PCR | GAAGGAGACATGTTAGTAAGAAAATCAAGTGG | 44630-44606 + PciI site |
| DE-16 | Northern probe; nrdA-a PCR | CGGGATCCTTAGTATCTCAGAGACTTATATTGATC | 43207-43233 + BamHI site |
| DE-25 | RT-PCR; nrdA-a/mobE junction; cycle sequencing; mobE flanking region | TCGTTGATAACGTTAACTCG | 43397-43378 |
| DE-26 | RT-PCR; mobE/nrdA-b junction; cycle sequencing; mobE flanking region | GATAGTCAAGCAAGTTATCG | 42268-42287 |
| DE-109 | RT-PCR; nrdA-a/mobE junction | TCACCTCCCATACATCTTGG | 43054-43073 |
| DE-110 | Primer extension; nrdA-a; cycle sequencing; nrdA-a flanking region | ATCGATTCGAGTTCCAGCAG | 44533-44552 |
| DE-111 | RT-PCR; nrdA-a 5′ flanking region; cycle sequencing; nrdA-a flanking region | TCTCACTGGAGATTGTACCG | 44887-44868 |
| DE-128 | Primer extension; mobE | TTTGTAACCGGAGATCTCCG | 43092-43111 |
| DE-131 | RT-PCR; nrdA-b/nrdB junction; RPA probe template; nrdA-b PCR1 | TGTAAGCTTATCAATTGCCG | 41327-41346 |
| DE-132 | RT-PCR; nrdA-b/nrdB junction; RPA probe template; nrdA-b PCR1 | CAGAAACACGGCGTTAAGTC | 41587-41568 |
| DE-143 | 3′ RACE; nrdA-b PCR1 | CGCGAGCTCTATGTTGTTCATCATTTATTGAC | 43011-42988 + SacI site |
| DE-145 | RT-PCR; nrdB; Northern probe; nrdB PCR | TCAAAGTCTGCTTGACTCGG | 41210-41191 |
| DE-146 | 3′ RACE; nrdB PCR1; Northern probe; nrdB PCR | GATAGCTAGACAACTCAGCC | 40375-40394 |
| DE-153 | 3′ RACE; nrdA-b nested PCR | CGGTGCAAACGAGTGGCATC | 42071-42052 |
| DE-164 | RT-PCR; nrdB 3′ flanking region; 3′ RACE; nrdB nested PCR | CAGAATGCAGAAGATGATTC | 40696-40677 |
| DE-165 | RT-PCR; nrdB 3′ flanking region | TGTGTCCATATTAGCAGGATC | 40241-40257 |
| DE-193 | RNA adaptor | GCUGAUGGCGAUGAAUGAACACUGCGUUUGCUGGCUUUGAUGAAA | NAa |
| DE-194 | 3′ RACE; adaptor-specific oligonucleotide | TTTCATCAAAGCCAGCAAACGC | NA |
| DE-195 | 3′ RACE; adaptor-specific oligonucleotide | CAAACGCAGTGTTCATTCATCGCC | NA |
| DE-196 | 5′ RACE; adaptor-specific oligonucleotide | GCTGATGGCGATGAATGAACACTG | NA |
| DE-197 | 5′ RACE; adaptor-specific oligonucleotide | ACACTGCGTTTGCTGGCTTTGATG | NA |
| DE-198 | 5′ RACE; nrdA-a specific cDNA synthesis, PCR1 | TCTTTATCATAGATGCCGTC | 44291-44310 |
| DE-199 | 5′ RACE; nrdA-a nested PCR | TACATTTGCAGACGAGCAGC | 44384-44403 |
| DE-204 | RPA probe template; nrdA-b PCR2 | TAATACGACTCACTATAGGCATCATAGTATTACTGTAAGCTTATCAATTGCCG | 41327-41346 + T7 promoter |
| DE-205 | RPA probe template; nrdA-b PCR2 | ATCATAGTATTACCAGAAACACGGCGTTAAGTC | 41587-41568 + 13-nt |
| DE-206 | RPA probe template; nrdB PCR1 | TCTGACTTGATGTTCCATGG | 40202-40221 |
| DE-207 | RPA probe template; nrdB PCR1 | AAGAGGCTGAGTTGTCTAGC | 40398-40379 |
| DE-208 | RPA probe template; nrdB PCR2 | TAATACGACTCACTATAGGCATCATAGTATTACTCTGACTTGATGTTCCATGG | 40202-40221 + T7 promoter |
| DE-209 | RPA probe template; nrdB PCR2 | ATCATAGTATTACAAGAGGCTGAGTTGTCTAGC | 40398-40379 + 13-nt |
| DE-211 | 5′ RACE; mobE-specific cDNA synthesis, PCR1 | CCTTTGTTCGGAGCAATACTTCCAG | 42826-42850 |
| DE-212 | 5′ RACE; mobE nested PCR | TTCCACTCGCATCATGTTATAAGCG | 42937-42957 |
| DE-214 | RT-PCR; mobE/nrdA-b junction | GAAACTCTATAAGCTTGGTG | 42651-42632 |
NA, not applicable.
RNA extraction and purification.
Samples (3 ml) of Aeh1-infected cultures were taken at various times postinfection, while the 0-min sample was uninfected bacteria. Immediately after collection, samples were suspended in an equal volume of RNAlater (Ambion) and stored on ice. Infected cells were pelleted by centrifugation for 5 min at 5,000 rpm at 4°C. RNA extractions for the time course were performed simultaneously by resuspending pelleted cells in Tris-EDTA buffer supplemented with 400 μg/ml lysozyme. RNA was extracted using a QIAGEN RNeasy minikit according to the manufacturer's instructions. RNA was eluted in 80 μl RNase-free water, and a 5-μl aliquot was analyzed on a 1% agarose gel to determine RNA quality and integrity. To remove contaminating DNA, RNA was treated with TURBO DNase (Ambion) according to the manufacturer's protocol, ethanol precipitated, and resuspended in RNase-free water.
RT-PCR.
Reverse transcription-PCR (RT-PCR) was performed using 5 μg of total RNA and 20 pmol of primer. Reaction mixtures were incubated at 25°C for 5 min, 37°C for 60 min, and 72°C for 10 min with Moloney murine leukemia virus reverse transcriptase (NEB) in 50 mM Tris-HCl (pH 8.3), 75 mM KCl, 3 mM MgCl2, and 2 mM dithiothreitol (DTT). A 5-μl aliquot of each reverse transcription reaction mixture served as the template for the amplification of cDNA. PCRs were performed using Taq DNA polymerase (NEB) in supplied buffer. Cycling conditions for the amplification of cDNA were as follows: 94°C for 45 s, 42°C for 45 s, and 72°C for 60 s, for 35 cycles. Amplicons were resolved on 1% agarose gels in 1× Tris-borate-EDTA buffer (89 mM Tris, 89 mM borate, and 2 mM EDTA).
Primer extension.
Primers (Table 1) used for primer extension and cycle sequencing reactions were 5′ labeled using T4 polynucleotide kinase (PNK). Reaction mixtures consisting of 20 pmol primer, 125 μCi [γ-32P]ATP, and 10 U PNK (NEB) were incubated at 37°C for 20 min in supplied buffer. PNK was heat inactivated at 90°C for 3 min. The 5′ termini of early and late transcripts were determined by annealing 1 pmol of radiolabeled primer to 10 μg total RNA in 5 μl primer extension buffer (50 mM Tris-HCl, 50 mM KCl, 10 mM MgCl2, 10 mM DTT, 1 mM [each] deoxynucleoside triphosphate [dNTP], 0.5 mM spermidine). The mixture was denatured for 3 min at 90°C and then hybridized for 20 min at 51.7°C. Reverse transcription was carried out at 42°C for 1 h in primer extension buffer (as above) with 2 mM sodium pyrophosphate, 200 U Moloney murine leukemia virus reverse transcriptase (NEB), and 20 U RNase inhibitor (Promega). The reaction mixtures were ethanol precipitated, resuspended in 8 μl H2O, and digested with 5 U of RNase H in 50 mM Tris-HCl (pH 8.3), 75 mM KCl, 3 mM MgCl2, and 10 mM DTT at 37°C for 20 min. The reactions were stopped with 10 μl stop solution (95% formamide, 20 mM EDTA, 0.05% bromophenol blue, 0.05% xylene cyanol FF). Cycle sequencing reactions (USB) were performed on the corresponding PCR fragment of the Aeh1 genome using the same end-labeled primer as used for the primer extension reaction. The reaction products were resolved on a 6% (wt/vol) denaturing polyacrylamide gel (19:1 acrylamide-bisacrylamide) and visualized using a PhosphorImager (GE Healthcare).
Northern hybridization.
Total RNA (5 μg) was glyoxalated using glyoxal sample load dye (Ambion) and resolved on a 1% agarose gel in 1× BPTE buffer (10 mM PIPES [piperazine-N,N′-bis(2-ethanesulfonic acid)], 30 mM Bis-Tris, 10 mM EDTA). Using downward alkaline transfer, the RNA was fixed to a positively charged Biodyne nylon membrane (Pall Corporation) according to the methods of Sambrook and Russell (50a). Membranes were soaked in 20 mM Tris-HCl (pH 8.0) prior to prehybridization. Prehybridization was carried out for 2 h at 68°C in 0.5 M sodium phosphate (pH 7.2), 7% (wt/vol) sodium dodecyl sulfate (SDS), 1 mM EDTA (pH 7.0). Radiolabeled probes were generated using the Nick Translation System (Invitrogen) with 1 μg of gel-purified PCR template and 125 μCi [α-32P]dCTP according to the manufacturer's instructions. Double-stranded DNA probe (80 ng) was denatured at 100°C for 5 min before hybridization at 42°C overnight. Blots were washed once in 0.1× SSC (1× SSC is 0.15 M NaCl plus 0.015 M sodium citrate)-0.1% SDS at 42°C and three times in 0.5× SSC-0.1% SDS at 68°C. The membrane was air dried briefly and wrapped in Saran Wrap. Images were visualized using a PhosphorImager.
5′ RLM-RACE.
Tobacco acid pyrophosphatase (TAP; Epicentre) was used to remove the γ and β phosphates from 5′ termini of 13 μg RNA in 50 mM sodium acetate (pH 5.0), 0.1% β-mercaptoethanol, 1 mM EDTA, and 0.01% Triton X-100. Non-TAP-treatment control reactions were performed by replacing TAP with nuclease-free water. An RNA adaptor (DE-193) was ligated to the 5′ termini of 2.5 μg of TAP-treated or non-TAP-treated RNA using T4 RNA ligase (NEB) in supplied buffer. Ligated RNA was then purified from excess, unligated adaptor oligonucleotide using RNeasy minicolumns (QIAGEN) according to the manufacturer's instructions. RT-PCR was carried out as described above using DE-198 (for nrdA-a) or DE-200 (for mobE) and a 5-μl aliquot of 5′ adaptor-ligated RNA. Gene-specific amplification of cDNA was carried out as described above using DE-196/DE-198 (for nrdA-a 5′ termini) or DE-196/DE-200 (for mobE 5′ termini) and the following cycling conditions: 94°C for 30 s, 50°C (nrdA-a) or 58°C (mobE) for 30 s, and 72°C for 60 s, for 35 cycles. A 5-μl aliquot of this reaction mixture was used as a template for nested PCR using primers DE-197/DE-199 (for nrdA-a 5′ termini) or DE-197/DE-201 (for mobE 5′ termini). Cycling conditions for nested PCR were as follows: 94°C for 30 s, 50°C (nrdA-a) or 58°C (mobE) for 30 s, and 72°C for 60 s, for 35 cycles. Amplicons were gel purified and cloned into pCR2.1 (Invitrogen). Ten positive clones were selected and sequenced.
3′ RLM-RACE.
An RNA adaptor (DE-193) was ligated to the 3′ termini of 13 μg of total RNA using T4 RNA ligase (NEB) in supplied buffer. Ligated RNA was purified from excess adaptor oligonucleotide using RNeasy minicolumns (QIAGEN) according to the manufacturer's instructions. RT-PCR was carried out as described above using DE-194 and a 5-μl aliquot of the 3′ adaptor-ligated RNA. Gene-specific amplification of cDNA was carried out as described above using DE-194/DE-143 (for nrdA-b termini) or DE-194/DE-146 (for nrdB termini) and the following cycling conditions: 94°C for 30 s, 55°C for 30 s, and 72°C for 60 s, for 35 cycles. A 5-μl aliquot of this reaction mixture was used as a template for nested PCR using primers DE-195/DE-153 (for nrdA-b termini) or DE-195/DE-164 (for nrdB termini). Cycling conditions for nested PCR were as follows: 94°C for 30 s, 50°C for 30 s, and 72°C for 60 s, for 35 cycles. Amplicons were gel purified, cloned into pCR2.1 (Invitrogen), and sequenced.
RNase protection.
RNase protection assays (RPAs) were performed according to the manufacturer's instructions (Ambion). The antisense probe template was generated by PCR from genomic Aeh1 DNA using primers DE-132/DE-131 (nrdA-b termini) and DE-206/DE-207 (nrdB termini) with the following cycling conditions: 94°C for 30 s, 49°C for 30 s, and 72°C for 60 s, for 35 cycles. A T7 promoter and additional nonhomologous sequence were incorporated by a second round of PCR using the above amplicons as template and primers DE-204/DE-205 (nrdA-b termini) or DE-208/DE-209 (nrdB termini) using the following cycling conditions: 94°C for 30 s, 58°C for 30 s, and 72°C for 60 s, for 35 cycles. The labeled RNA probes were transcribed in 50-μl volumes consisting of 50 μCi [α-32P]UTP, 1 μl PCR template, 50 U T7 RNA polymerase (NEB), and supplied buffer. The reaction mixture was incubated at 37°C for 2 h before 2 U of Turbo-DNase (Ambion) was added, and the incubation continued for 30 min. The resultant RNA probes were gel purified from a 5% denaturing polyacrylamide gel. Total RNA (7.5 μg) was hybridized overnight with purified RNA probes (28,000 cpm of each probe) at 42°C in supplied hybridization buffer. Control reactions used 7.5 μg of yeast RNA. Hybridized probe was digested with an RNase A-T1 mixture in supplied digestion buffer for 30 min. RNases were inactivated, and the protected RNA was precipitated. The sample was analyzed by electrophoresis through a 6% denaturing polyacrylamide gel. Images were visualized on a PhosphorImager, and the amount of transcriptional readthrough and termination was estimated using ImageQuant software (GE Healthcare). The 100-bp DNA marker (Fermentas) was dephosphorylated using Antarctic phosphatase (NEB) in supplied buffer. Reaction mixtures were incubated at 37°C for 30 min, and the Antarctic phosphatase was heat inactivated at 65°C for 5 min. The dephosphorylated marker was end labeled using T4 PNK. Reaction mixtures consisting of 1 μg DNA marker, 50 μCi [γ-32P]ATP, and 10 U PNK (NEB) were incubated at 37°C for 30 min. PNK was heat inactivated at 90°C for 3 min. The end-labeled DNA marker was column purified (QIAGEN) and eluted in 30 μl Tris-EDTA buffer (pH 8.0).
Promoter predictions.
Early and late phage Aeh1 promoters were predicted by extracting 100 bp upstream and downstream of the start codon of Aeh1 genes that are homologous to phage T4 genes that are transcribed at early and late times post-T4 infection. A training model was generated for Aeh1 early- and late-transcribed genes using the Gibbs Motif Sampler in recursive sampler mode (57). This training model was then used in an unbiased search to scan the Aeh1 genome sequence for early and late promoters using DSCAN (31, 43). A user-generated program converted the Gibbs DSCAN output into an alignment file that was used to generate sequence logos (11).
RESULTS
Overview of regulatory elements in the Aeh1 nrd genomic region.
The class Ia aerobic RNR genes of phage Aeh1 are found in an operon-like arrangement, with each gene in the same transcriptional orientation and each gene preceded by an RBS (Fig. 1A) (48). The most significant difference in the organization of this region between Aeh1 and other T-even-like phages is the location of mobE, an HNH family homing endonuclease gene (29). In phage Aeh1, mobE is inserted in the Aeh1 nrdA gene, splitting the large subunit gene into two smaller genes, nrdA-a and nrdA-b (48), whereas in phages T4, T6, RB2, RB3, RB15, and LZ7, mobE is inserted between the nrdA and nrdB coding regions (33, 48, 51).
FIG. 1.

Genomic organization and regulatory elements of the Aeh1 nrd genomic region. (A) Schematic of the Aeh1 nrd genomic region, based on the complete genome sequence (44). Genes are indicated by rectangles with arrowheads indicating direction of transcription, with gene names in italics. Positions of primers used for primer extension mapping of transcripts are indicated below the nrdA-a and mobE genes. Predicted regulatory elements are indicated. (B) Consensus sequences for the phage Aeh1 early and late promoters displayed in logos format (53). (C) Putative secondary structures of predicted Rho-independent transcriptional terminators downstream of the genes 50, nrdA-b, and nrdB, respectively. Stop codons and poly(U) tracts are underlined and labeled, with the stability of each helix indicated in kcal/mol as predicted by the Mfold server (64). (D) Structure of a putative regulatory stem-loop upstream of mobE. A box indicates the position of the late promoter upstream of mobE, with a vertical line indicating the mobE RBS.
To investigate the transcriptional organization of the Aeh1 nrd genomic region, we identified putative promoters based on our own and published computational predictions (44). We identified two potential promoters, an early promoter upstream of the phage Aeh1 nrdA-a gene and a late promoter upstream of the Aeh1 mobE gene (Fig. 1A and B). The Aeh1 nrdA-a early promoter is comprised of −35 and −10 boxes separated by 17 nucleotides (nt), with a UP element upstream of the −35 box (Fig. 1B) (16, 50). The −35 box of the Aeh1 early promoter differs from the canonical T4 early promoter in that a G is preferred at position −37 rather than a T (44). The late promoter upstream of mobE is very similar to consensus T4 late promoters (9, 40), except for a slight preference for a C at position −25 (Fig. 1B), which is atypical for T4 late promoters. We could not identify an early or late promoter sequence upstream of the nrdB gene. Significantly, no middle-like promoter in the Aeh1 genome could be identified by bioinformatics methods, consistent with previous reports indicating that Aeh1 does not possess the middle-mode transcriptional machinery found in phages T4, RB69, and 44RR (44).
We examined the regions downstream of each gene in the Aeh1 nrd operon for Rho-independent transcriptional terminators (25, 49, 63) and found putative terminators downstream of genes 50, nrdA-b, and nrdB (Fig. 1A and C). The nrdA-b and nrdB terminators are 5 to 6 nt downstream of each gene's stop codon, while the stop codon of gene 50 lies within the loop region of the predicted terminator. All three terminators consist of putative 5-bp stems with a 4-nt tetraloop (Fig. 1C). Although the stem structures are not similar in sequence, the tetraloop sequences of the two terminators are identical. A short 4-nt poly(U) tract follows the nrdA-b terminator, while longer tracts follow the terminator predicted downstream of genes 50 [6-nt poly(U) tract] and nrdB [10-nt poly(U) tract].
We also identified a putative stem-loop structure immediately upstream of the mobE AUG codon in the intergenic region separating nrdA-a and mobE (Fig. 1D). This stem-loop structure does not possess features characteristic of Rho-independent terminators. Rather, this RNA hairpin has a predicted role in regulating translation of MobE, as the mobE RBS is sequestered within the hairpin. The predicted mobE late promoter is positioned such that late transcripts would not include sufficient sequence to form a stable stem-loop structure and sequester the mobE RBS.
Promoters of two temporal classes regulate expression of the Aeh1 nrd operon.
We used primer extension analysis to confirm the predicted Aeh1 early and late promoters upstream of the nrdA-a and mobE genes, respectively. To map early transcripts upstream of the nrdA-a gene, we isolated total RNA from A. hydrophila before Aeh1 infection and at various times post-Aeh1 infection. Primer extension analysis revealed a transcript that initiated at nucleotide C-24 relative to the ATG codon of the nrdA-a gene (Fig. 2A). This transcript was detected as early as 1 min postinfection (Fig. 2B, control, lane 2) but not in uninfected A. hydrophila extracts (Fig. 2B, control, lane 1). Early transcripts persisted over the time course of the phage infection and remained detectable at 50 min postinfection (Fig. 2B, control, lane 8). To confirm the initiating nucleotide, we used 5′ RLM-RACE to map the 5′ end of the transcript. The sequences of four clones were aligned with the genomic DNA sequence upstream of the nrdA-a gene (Fig. 2C), confirming that the initiating nucleotide mapped to position C-24, as determined by primer extension analysis.
FIG. 2.

Mapping of transcript initiation sites upstream of the nrdA-a gene. (A) Primer extension mapping of the transcription start site using primer DE-110 and RNA isolated 20 min post-Aeh1 infection. An aliquot of the primer extension reaction mixture was electrophoresed alongside a sequencing ladder of the nrdA-a upstream region. The initiating nucleotide is identified by an asterisk. (B) (Top) Primer extension analysis of transcription initiation at the nrdA-a promoter at various times post-Aeh1 infection. (Bottom) Primer extension analysis of RNA isolated after rifampin treatment of Aeh1-infected cells. Rifampin was added 5 min post-Aeh1 infection (indicated by a plus sign). The sequence of the nrdA-a upstream region is shown below with positions of the −35 and −10 boxes of the early promoter and transcriptional start site indicated relative to the nrdA-a ATG codon. The RBS is underlined. (C) Partial sequences of four clones from 5′-RLM-RACE analysis of nrdA-a initiated transcripts aligned with the genomic sequence (gDNA).
To determine if the persistence of the nrdA-a transcript over the course of the phage infection was due to continual transcriptional initiation, we treated Aeh1-infected cells with rifampin at 5 min postinfection to inhibit the host RNA polymerase before isolating RNA for primer extension analysis (Fig. 2B, rifampin treated). Because Aeh1 does not encode its own RNA polymerase (44, 48), transcription of phage genes is dependent on the host RNA polymerase. Primer extension analysis with rifampin-treated RNA revealed an extension product that accumulated until 10 min post-Aeh1 infection (Fig. 2B, rifampin treated, lane 4), then sharply declined, and was barely visible at 40 min postinfection. The primer extension product mapped to the same nucleotide as that observed with RNA isolated from Aeh1-infected cells not treated with rifampin (Fig. 2A). Collectively, the primer extension data suggest that the Aeh1 nrdA-a early promoter is continually active over the course of the phage infection, representing a departure from phage T4, where early promoters are active ∼1 to 3 min postinfection (35, 40).
Transcription initiation sites upstream of the mobE gene were also determined using primer extension analysis (Fig. 3A). Aeh1-specific transcripts initiating upstream of mobE were detected at 15 min postinfection but not at earlier time points, consistent with a predicted phage-specific late promoter (Fig. 3A, compare lanes 3 to 6 with lanes 1 and 2). Similar to the early transcripts, the late transcripts also persisted over the time course of the phage infection (Fig. 3A, lane 6). Two potential initiation sites were mapped to T-23 and G-22 relative to the mobE ATG codon, respectively (Fig. 3A). Two other primer extension products that map to G-10 and T-9 appear at 5 min post-Aeh1 infection and persist throughout the time course of the infection. The early appearance of the G-10 and T-9 extension products is inconsistent with initiation from a late promoter. Furthermore, the G-10 and T-9 sites are located near the RBS upstream of mobE, suggesting that these transcripts would not be translated efficiently.
FIG. 3.

Mapping of transcript initiation sites upstream of the mobE gene. (A) Representative primer extension mapping of the transcription start site using primer DE-120, electrophoresed alongside a sequencing ladder generated with the same primer. The sequence of the mobE upstream region and the structure of the predicted stem loop are indicated to the right of the gel. Potential initiating nucleotides (T-23 and G-22) are indicated by arrows, while the G-10 and T-9 sites are indicated by asterisks. (B) Experimental outline to distinguish initiated from processed transcripts using TAP as elaborated in the text. P, 5′ phosphate; open rectangle, RNA adaptor oligonucleotide. (C) Agarose gel of 5′-RLM-RACE reactions using RNA treated with (+) or without (−) TAP. Aliquots of the mixture from the final nested PCR step were electrophoresed alongside a pBR322/AluI ladder. (D) Sequences of five clones corresponding to each of the 5′-RLM-RACE products in panel B. Only partial sequences of the clones are shown. The sequences are aligned with the genomic sequence (gDNA) of the mobE coding region. The late promoter (PL), start codon, and putative RNase E sites are indicated. (E) Summary of transcript mapping and 5′-RLM-RACE data indicating that late-initiated transcripts would not include sufficient sequence to form a regulatory hairpin that sequesters the mobE RBS.
The mobE transcript is processed at an RNase E-like site.
To confirm the initiating nucleotide at the mobE late promoter, we used 5′ RLM-RACE to identify the 5′ end of the transcript and to determine if the G-10 and T-9 sites mapped by primer extension resulted from posttranscriptional processing. Posttranscriptional processing can be detected by 5′ RLM-RACE because treatment of RNA with TAP removes the γ and β phosphates from RNA with a 5′-triphosphate end but does not remove the α phosphate (5, 19). In the subsequent ligation step of the 5′-RLM-RACE procedure, only RNA molecules with a single (α) 5′ phosphate are substrates for T4 RNA ligase (Fig. 3B). Thus, initiating transcripts that possessed a 5′ triphosphate would be detected only in RNA samples that were TAP treated, whereas RNA molecules that possessed a single 5′ phosphate would be detected in both TAP−and TAP+ samples. As seen in Fig. 3C, two bands of ∼280 bp (band A) and ∼220 bp (band B) were amplified from RNA samples that were treated with TAP prior to 5′ RLM-RACE (Fig. 3C, lane 1). In contrast, a single band of ∼220 bp was amplified from RNA that was not treated with TAP prior to 5′ RLM-RACE (Fig. 3C, lane 2). To determine the 5′ ends of each of the amplified fragments, the three bands were separately excised, cloned, and sequenced.
As shown in Fig. 3D, the sequences of five clones corresponding to the larger of the two bands (band A) in the TAP+ sample were in agreement with the primer extension analysis that mapped the initiating nucleotide to G-22. Surprisingly, the 5′ ends of sequences of five clones from the smaller (band B) of the two amplified products in the TAP+ sample all mapped to an A-U-rich region within the mobE coding region, ∼60 nt away from G-22. The 5′ ends of clones corresponding to the single amplified product in the TAP− sample also mapped to the same A-U-rich region (Fig. 3D).
Collectively, the 5′-RLM-RACE results show that the initiating nucleotide of the mobE late promoter is G-22 and that the other two potential transcript initiation sites (G-10 and T-9) mapped by primer extension analyses are not true initiation sites and likely result from reverse transcriptase pausing at secondary structures in the region of the regulatory hairpin upstream of mobE. Furthermore, the lack of 5′-RLM-RACE products that map to the G-10 and T-9 sites suggests that these sites do not represent posttranscriptional processing products with 5′ monophosphates. These data also indicate that late-initiating transcripts would not include sufficient sequence to form a stem-loop structure to sequester the mobE RBS (Fig. 3E). Moreover, the amplification of a product in the TAP− sample was unexpected, because only RNA transcripts that have been internally processed would possess a single 5′ phosphate. Our data suggest that the mobE transcript is processed at an A-U-rich region that is adjacent to a hairpin, features that are characteristic of an RNase E processing site (15).
The nrd and mobE genes are transcribed on a polycistronic mRNA.
To determine the sizes of transcripts that initiate at the early and late promoters, we used Northern hybridization with probes corresponding to the nrdA-a, mobE, and nrdB genes, respectively (Fig. 4). In all three instances, the radiolabeled probe detected a band of ∼4 kb as early as 5 min postinfection, which remained detectable at >20 min postinfection (Fig. 4A, B, and C). This transcript is of sufficient length to carry the nrdA-a, mobE, nrdA-b, and nrdB genes on a polycistronic message and is similar is size to a predicted transcript of 4.3 kb. Detection of mobE-specific late transcripts is complicated by the fact that the mobE gene is also present on transcripts that initiate upstream of nrdA-a throughout the course of the phage infection (Fig. 2B). For each gene-specific probe, additional hybridizing bands were also observed. None of the bands, however, matched the predicted sizes of transcripts initiating from either the early promoter upstream of nrdA-a or the late promoter upstream of mobE and terminating at the nrdA-b or nrdB terminator. Likewise, transcripts that initiated at predicted early promoters upstream of genes 52 and 51 would have produced transcripts larger than 4.2 kb (Fig. 1A), which were not observed with any probe. It is unlikely that the additional bands resulted from spurious hybridization of the probes to A. hydrophila rRNA, because no signals were observed with RNA isolated before Aeh1 infection of A. hydrophila (lane 0 of each panel).
FIG. 4.
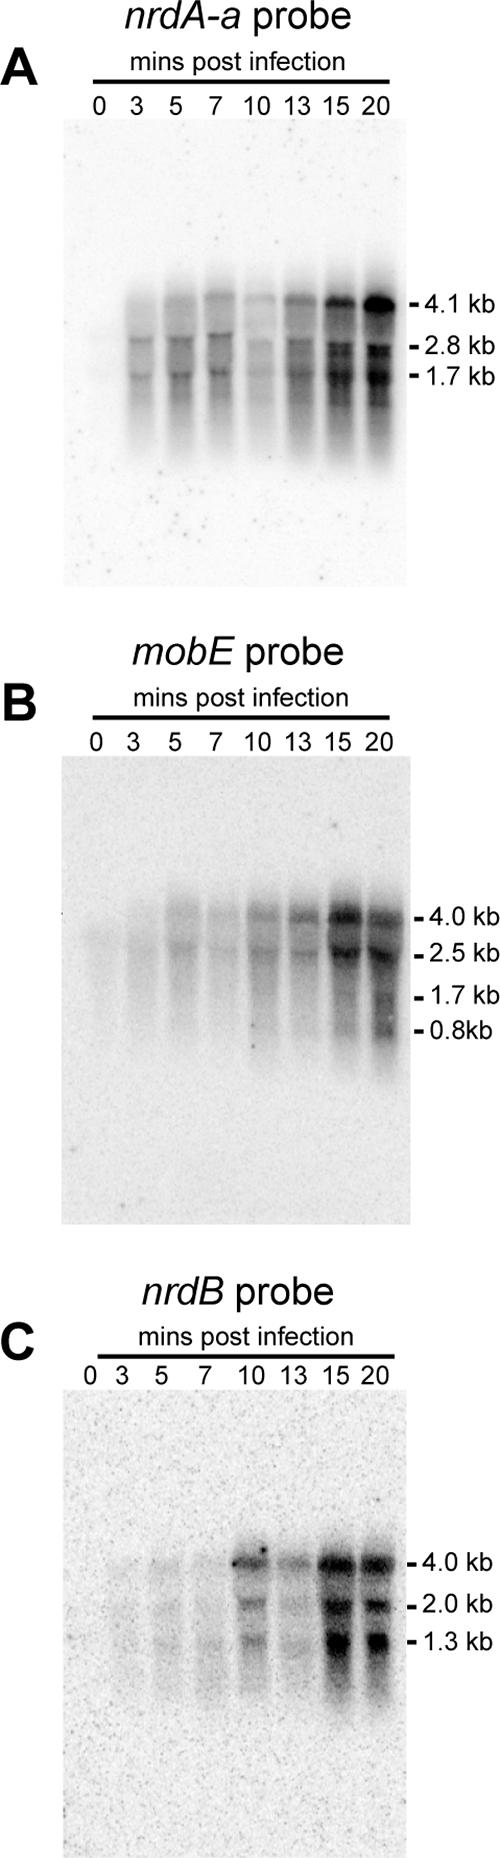
Northern blot analyses of the Aeh1 nrd operon. (A) Northern blot analysis of RNA isolated immediately before Aeh1 infection and at various times post-Aeh1 infection using a probe directed against the full-length nrdA-a gene. The sizes of the hybridizing bands are indicated. (B and C) Northern blot analyses as in panel A but using probes directed against the mobE and nrdB genes, respectively.
The Northern blot analyses suggested that the nrdA-a, mobE, nrdA-b, and nrdB genes were present on a common transcript, but the presence of additional hybridizing bands suggested that RNA processing or cross-hybridization might be responsible for the additional signals observed. To confirm that these genes are cotranscribed, we performed a series of RT-PCR experiments. Using primers designed against the nrdA-a, mobE, and nrdA-b coding regions, we amplified RT-PCR products of the predicted sizes with RNA isolated 30 minutes postinfection (Fig. 5B and C). This result indicates that the nrdA-a/mobE and mobE/nrdA-b genes are cotranscribed. Similarly, we showed that the nrdA-b and nrdB genes are cotranscribed using two different primer sets (Fig. 5E and G). Collectively, the results of the RT-PCRs support the Northern blot analyses in showing that the nrdA-a, mobE, nrdA-b, and nrdB genes are cotranscribed.
FIG. 5.

Transcription of the bacteriophage Aeh1 nrd operon as determined by RT-PCR analyses. Positions of primer pairs used in RT-PCR are indicated on a schematic of the nrd operon, along with the sizes of the expected amplicons. (A to G) Individual agarose gels corresponding to primer pairs as shown above. Lanes for each gel: 1, amplification with genomic Aeh1 DNA (gDNA); 2, RT-PCR performed without prior reverse transcriptase reaction; 3, RT-PCR performed with RNA isolated pre-Aeh1 infection of A. hydrophila; 4, RT-PCR performed with RNA isolated 30 min post-Aeh1 infection; 5, RT-PCR performed without RNA. Relevant sizes of the DNA standard are indicated alongside each gel.
Expression of the nrdB gene is dependent on transcriptional readthrough.
The Northern blot and RT-PCR experiments also served to determine the functionality of the predicted transcriptional terminators in the nrd operon. In particular, the presence of a ∼4-kb hybridizing band in Northern blots (Fig. 4), coupled with the amplification of a RT-PCR product spanning the junction of the nrdA-b and nrdB genes (Fig. 5E), suggested that the transcriptional terminator 3′ to the nrdA-b gene allowed a significant amount of transcriptional readthrough. Likewise, we were able to amplify RT-PCR products using primers that flanked the predicted transcriptional terminator downstream of the nrdB gene (Fig. 5D) and primers that flanked the predicted terminator between genes 50 and nrdA-a (Fig. 5A). RT-PCR, however, is a highly sensitive method that may detect rare transcriptional readthrough events that are otherwise not detectable by Northern hybridization.
To validate the functionality of the predicted terminators, we used 3′ RLM-RACE to map the 3′ ends of transcripts in the nrd genomic region (Fig. 6A). The sequences of 6 out of 10 clones revealed a termination event at the poly(U) tract immediately downstream of the nrdA-b terminator (Fig. 6B). Similarly, 4 out of 10 clones revealed transcriptional termination at the nrdB terminator, immediately following the poly(U) tract (Fig. 6C). In both cases, we amplified shorter products that mapped to sites 5′ to the predicted terminators, likely representing transcripts that were degraded during purification or transcripts that were partially processed from the 3′ end. These results, nonetheless, indicate that the transcriptional terminators downstream of nrdA-b and nrdB are functional.
FIG. 6.

Transcription termination and readthrough at Rho-independent terminators downstream of the nrdA-b and nrdB genes. (A) Schematic of the nrdA-b and nrdB genes with the positions of probes used for RPAs. The sizes of protected fragments corresponding to termination and readthrough are indicated. (B and C) 3′-RLM-RACE sequence results of transcripts terminating at the nrdA-b and nrdB terminators, respectively. Partial sequences of cloned 3′-RLM-RACE products are aligned with the genomic sequences (gDNA) corresponding to the 3′ regions of the nrdA-b and nrdB genes, respectively. The stem-loop structure of each terminator is indicated on the genomic sequence. (D and E) RPAs showing the ratio of readthrough transcription to termination at various times at the nrdA-b and nrdB terminators, respectively. For each protection assay, aliquots of the reaction mixtures were electrophoresed alongside a labeled 100-bp ladder (M). The percentage of product corresponding to termination or readthrough is indicated below each gel. −, probe only; +, probe digested with RNase.
We were interested in estimating the amount of transcriptional readthrough at the nrdA-b terminator, because transcriptional readthrough is the only mechanism by which the promoterless nrdB gene could be expressed. To estimate the level of transcriptional readthrough, we used an RPA with a probe that spanned the 3′ end of nrdA-b, the transcriptional terminator and intergenic region, and the 5′ end of nrdB (Fig. 6A). The probe also included 29 nt of nonhomologous sequence, which would allow us to distinguish full-length undigested probe (290 nt) from protected probe that corresponded to transcriptional readthrough (261 nt) or termination events (∼133 nt based on 3′-RLM-RACE data). As seen in Fig. 6D, with RNA isolated at 5, 10, and 15 min postinfection, 85% of the protected fragment was 261 nt in length, indicative of transcription readthrough, whereas only 15% of the protected fragment was of the length predicted for termination.
Similarly, we used RNase protection to estimate the amount of transcriptional readthrough at the nrdB terminator (Fig. 6E). With RNA isolated at 15 min post-Aeh1 infection, 93% of the protected fragment was of the size expected for termination events (111 nt), with only 7% of the protected fragment of the size expected for a readthrough event (197 nt). Similar ratios of readthrough to termination events were found for RNA isolated at 20 and 40 min postinfection. This result indicating efficient termination at the end of nrdB is in stark contrast to that observed for the nrdA-b terminator, which indicated a significant amount of readthrough.
DISCUSSION
One of the most striking differences in the genomic organization of the nrdA-nrdB region of T-even-like phage is the presence or absence of homing endonuclease genes (39, 44, 48, 51). Here, we focus on the transcriptional organization of the Aeh1 nrd genes, as the mobE insertion has created a unique opportunity to examine the integration of a mobile endonuclease gene into an operon that is under stringent transcriptional control. Overall, we find that the Aeh1 nrd and mobE genes are regulated by a different transcriptional strategy than the corresponding T4 genes and that transcriptional readthrough plays a critical role in the regulation of the Aeh1 nrdB gene. Furthermore, we find evidence that Aeh1 mobE is subject to negative regulation, which limits MobE function to late in the Aeh1 infective cycle.
The genome sequence of phage Aeh1 identified homologs of T4 proteins that function to direct the host RNA polymerase to recognize early and late phage promoters preferentially over host promoters (44, 47). One critical difference, however, was the lack of middle-promoter-like promoters in Aeh1 and the absence of the middle-mode transcription factor, MotA, from the genome sequence, suggesting that Aeh1 does not possess a class of transcripts analogous to T4 middle transcripts. In our examination of the Aeh1 nrd operon, we identified promoters upstream of nrdA-a and mobE that were active at early and late time points, respectively, but were unable to identify any promoters analogous to T4 middle promoters. Significantly, primer extension analysis of the nrdA-a early promoter showed that the promoter remained active over the course of the phage infection and that the initiating nucleotide for transcription was C-22. Both of these observations are in contrast to T4 early promoters, which usually initiate at an A nucleotide (32, 61) and which are active 1 to 3 min post-T4 infection (35, 40). Likewise, the late promoter upstream of Aeh1 mobE is active 15 min postinfection, a significant delay compared with T4 late promoters, which are active 7 min postinfection (35, 40). Our transcriptional data are similar to those found for phages S-PM2 and RB49, which like Aeh1 possess only two transcriptional classes (early and late) and lack the middle-mode transcription machinery (10, 12, 37).
With respect to transcriptional regulation of the nrd genes, the most significant difference between T4 and Aeh1 is the lack of a middle-promoter-like promoter upstream of nrdB in Aeh1 (summarized in Fig. 7). In phage T4, expression of the nrdA and nrdB genes is regulated such that the NrdA protein appears ∼1 to 2 min before the NrdB protein (reviewed in reference 23). Synthesis of NrdB is therefore the rate-limiting step in the onset of dNTP synthesis, which occurs ∼5 min postinfection. The expression of nrdA is controlled by two early promoters and one late promoter (59, 60). A middle promoter was identified upstream of nrdA by bioinformatic methods (40) and recently confirmed by transcript mapping (56, 60). An immediate-early promoter is located upstream of the frd gene, ∼4.1 kb from nrdA. Transcripts (Tu) from this promoter extend through frd, td, and nrdA and are detected as early as 2 min postinfection. At ∼3 min postinfection, transcripts (T3) initiate from a weak early promoter immediately upstream of nrdA (60). These transcripts, however, could not be capped by guanylyl transferase and thus may represent products of a posttranscriptional processing event of the Tu transcript (60). Approximately two-thirds of transcripts terminate at a Rho-independent terminator immediately downstream of nrdA, while the remaining transcripts continue through mobE and nrdB to create a “deoxyribonucleotide operon.” However, this long polycistronic message is not likely to represent a significant source of the NrdB protein, because the distance between nrdA and the 3′ end of nrdB is such that NrdB would not be translated until ∼8 min postinfection (due to the length of the transcript and rate of translation), well after the onset of dNTP synthesis in phage-infected cells. In addition, splicing of the group I intron from nrdB transcripts delays NrdB translation (45, 55). Thus, the T4 nrdB gene is also under the control of a middle promoter that is active ∼3 min postinfection (59), ensuring the appearance of the NrdB protein ∼1 min after the appearance of the NrdA protein.
FIG. 7.

Summary of transcriptional regulation in the nrd genomic region of phages Aeh1 and T4, labeled as in Fig. 1. Transcripts are indicated by lines, with approximate sizes of each transcript indicated to the right. Dashed lines indicate transcripts that initiate upstream of the nrdA gene of Aeh1 and T4, while the parentheses around the Aeh1 transcripts indicate that the initiation point has not been mapped. Transcripts for the phage T4 region are based on published material as described in the text (56, 59, 60).
Transcription of the Aeh1 nrd genes occurs by a different strategy, in part because the td and frd genes of Aeh1 are ∼160 kb distant from the nrd genes (48). Our results indicate that a ∼4-kb transcript initiates from an early promoter upstream of nrdA-a that is sufficient in length to include the nrdA-a, mobE, nrdA-b, and nrdB genes. In addition, RT-PCR experiments indicate that the nrdA-a gene is present on another transcript that likely initiates at one of two predicted early promoters upstream of gene 52 or 51. Transcripts that initiate at gene 52 or 51 could conceivably extend through the entire nrd operon, but we could not detect hybridizing bands of >4.2 kb by Northern analysis as would be expected if these transcripts extended through the nrd genes to the Rho-independent terminators downstream of nrdA-b or nrdB. At ∼15 min after Aeh1 infection, transcripts also initiate at a late promoter upstream of mobE and presumably extend through nrdA-b and nrdB. Interestingly, we do not observe a corresponding reduction in transcription from the nrdA-a early promoter, which complicates detection of late-time-specific mobE transcripts by Northern analysis because the mobE gene is present on both early and late messages. Nonetheless, our data show that transcription of the Aeh1 nrd operon is continuous throughout the infective cycle, representing a departure from transcription of the T4 nrd genes that are subject to stricter temporal control.
Studies of phage T4-infected cells have implicated the NrdB protein as the key regulator in the appearance of RNR activity (59, 60). For phage Aeh1, however, it is tempting to speculate that synthesis and posttranslational assembly of the NrdA-a and NrdA-b proteins into a complex are the rate-limiting step in the appearance of RNR activity, rather than synthesis of the NrdB protein. This hypothesis may account for the presence of a transcriptional terminator downstream of nrdA-b that would prevent an accumulation of nrdB message and protein before assembly of the NrdA-a/NrdA-b heterodimer. The late promoter upstream of mobE, which is active 15 min postinfection, may be analogous to the T4 nrdB middle promoter and act to increase Aeh1 nrdB message and protein levels to coincide with the formation of the NrdA-a/NrdA-b heterodimer.
The presence of a ∼4-kb transcript shown by Northern blot analyses using either the nrdA-a or the nrdB gene as a probe suggested that the Rho-independent terminator downstream of nrdA-b is inefficient and allows a significant amount of readthrough, although our 3′-RLM-RACE data indicated that some transcription events terminate at this point. The inefficiency of this terminator highlights another key difference between the T4 and Aeh1 nrd genes, namely, that expression of the Aeh1 nrdB gene is solely dependent on readthrough transcription at the nrdA-b terminator, from transcripts that initiate either at the nrdA-a early or at the mobE late promoter. Transcriptional readthrough has been reported in T4 and in some instances is the only mechanism of expression of promoterless or “orphaned” genes (27). We estimate from RNase protection assays that 85% of transcripts read through the Aeh1 nrdA-a terminator at all time points sampled post-Aeh1 infection. In contrast, termination is very efficient at the terminator downstream of the nrdB gene, with 93% of transcripts terminating at this point at all times sampled. The inefficiency of the nrdA-b terminator correlates with the short 4-nt poly(U) tract that follows the stem-loop structure. The length of the poly(U) tract has been shown to be critical in directing efficient termination in a number of experimental systems (1, 2, 62). Conversely, the efficiency of the nrdB terminator is positively correlated with the longer, 10-nt poly(U) tract that follows the stem-loop structure.
Few freestanding endonuclease genes in phage have been characterized in detail, but experimental evidence to date suggests that freestanding endonuclease genes have coevolved with the phage genome to minimize their impact on gene structure and function (33). The controls that we describe here for Aeh1-carried mobE include a late-regulated promoter that drives expression of mobE and a putative stem-loop structure that is predicted to sequester the mobE RBS in early transcripts that initiate upstream at the nrdA-a early promoter, presumably limiting MobE translation. This regulatory stem-loop structure would form only in early transcripts that extend through mobE, because transcripts that initiate at the late promoter upstream of mobE do not include enough RNA sequence to form a stable stem-loop to sequester the mobE RBS. The transcriptional and translation controls described for mobE are similar to those known for a number of phage T4 genes (24, 36, 38), including genes for the T4 intron-encoded endonucleases I-TevI, I-TevII, and I-TevIII (14, 22). Moreover, mobE appears to be subject to negative regulation in the form of posttranscriptional processing. We mapped an RNase E-like site in the mobE coding region, immediately upstream of a predicted hairpin that is characteristic of RNase E sites (15). RNase E is involved in posttranscriptional processing of a number of phage T4 genes (58), the most relevant to this work being the freestanding GIY-YIG endonuclease gene segG, which lies upstream of gene 32 in phage T4 (34). Interestingly, SegG-induced DSBs were detected in phage genomic DNA by Southern blot analysis (33), suggesting that RNase E processing does not abolish translation of the SegG message. It remains to be determined if RNase E is responsible for posttranscriptional processing of the mobE message and if the processing affects MobE protein levels. However, we have previously isolated a complex of the NrdA-a/NrdA-b/NrdB proteins from Aeh1-infected cells (18), indicating that posttranscriptional processing has little effect on translation of the nrdA-a, nrdA-b, and nrdB genes that are cotranscribed with mobE.
Thus, a prediction from our results is that Aeh1 mobE would be functional only at late time points during phage infection. It is possible that limiting translation from the mobE RBS on early transcripts maximizes translation of the nrdA-a, nrdA-b, and nrdB coding regions at a stage in the Aeh1 infective cycle when RNR function is critical. Alternatively, limiting MobE function to late in the infection cycle may correlate with the completion of DNA replication in Aeh1-infected cells and the availability of genome equivalents to facilitate repair of DSBs generated during mobE homing. Tight regulation of MobE expression may also correlate with the nonspecific DNA cleavage activity of the endonuclease, as we have shown elsewhere that overexpression of MobE from an inducible plasmid-based promoter in E. coli is extremely toxic (E. A. Gibb and D. R. Edgell, unpublished data). Late expression of endonuclease function during phage infection may be a general pattern, as transcription of T4 intron-encoded and freestanding endonucleases is also restricted to middle or late stages of phage infection (22, 35).
The mechanisms governing the regulation of T4 mobE have not been studied in detail, but it is interesting that T4 mobE does not apparently possess the same transcriptional and translational controls as does Aeh1 mobE. Transcript mapping of the T4 nrdA-nrdB region failed to locate a promoter that specifically drives expression of mobE but did identify a Rho-independent terminator within mobE that functions to regulate the expression of the upstream nrdA gene (59). These data suggest that expression of T4 mobE is dependent on readthrough transcription from the nrdA terminator, which occurs in one out of every three transcripts (59). Translation of T4 MobE, however, is likely an infrequent event because no readily identifiable RBS lies upstream of the mobE AUG codon (40), and thus translation may be dependent on translational coupling with the upstream nrdA gene.
In summary, our data show that expression of Aeh1 mobE is temporally regulated by a late promoter that is active ∼15 min postinfection. We also provide evidence for posttranscriptional processing of the mobE transcript by RNase E. In addition, a putative stem-loop structure sequesters the mobE RBS, presumably preventing its translation from early transcripts. Our primer extension data show that late transcripts would not include sufficient sequence to form the regulatory stem-loop, likely freeing the RBS and facilitating translation of MobE at late time points. It is tempting to speculate that these controls have evolved as a response to the mobE invasion of the Aeh1 nrdA gene, because similar controls do not appear to exist for the mobE gene in phage T4 that is located in the nrdA-nrdB intergenic region. A recent survey of sequenced T-even-like phage genomes for genes that had undergone lateral gene transfer found only a single candidate, the nrdA gene (17). This may not be surprising given the prevalence of mobile endonucleases in the nrdA-nrdB region of a number of T-even-like phages and the possibility that homing endonucleases can shuffle DNA between genomes due to coconversion of flanking sequence that accompanies an endonuclease-mediated mobility event (7, 26, 33, 42). Thus, the RNR genes of phage may prove to be a useful model for studying the evolution and function of a critical enzyme of nucleotide metabolism and also provide insight into the mechanism(s) by which mobile endonucleases integrate into transcriptional programs with minimal impact on the regulation of RNR function.
Acknowledgments
This work was supported by a grant from the Canadian Institutes of Health Research (MOP77779) to D.R.E.
We thank Gavin Wilson for assistance with promoter predictions and David Haniford for discussion and reading of the manuscript.
Footnotes
Published ahead of print on 20 April 2007.
REFERENCES
- 1.Abe, H., T. Abo, and H. Aiba. 1999. Regulation of intrinsic terminator by translation in Escherichia coli: transcription termination at a distance downstream. Genes Cells 4:87-97. [DOI] [PubMed] [Google Scholar]
- 2.Abe, H., and H. Aiba. 1996. Differential contributions of two elements of rho-independent terminator to transcription termination and mRNA stabilization. Biochimie 78:1035-1042. [DOI] [PubMed] [Google Scholar]
- 3.Belfort, M., V. Derbyshire, B. Cousineau, and A. Lambowitz. 2002. Mobile introns: pathways and proteins, p. 761-783. In N. Craig, R. Craigie, M. Gellert, and A. Lambowitz (ed.), Mobile DNA II. ASM Press, Washington, DC.
- 4.Belle, A., M. Landthaler, and D. A. Shub. 2002. Intronless homing: site-specific endonuclease SegF of bacteriophage T4 mediates localized marker exclusion analogous to homing endonucleases of group I introns. Genes Dev. 16:351-362. [DOI] [PMC free article] [PubMed] [Google Scholar]
- 5.Bensing, B. A., B. J. Meyer, and G. M. Dunny. 1996. Sensitive detection of bacterial transcription initiation sites and differentiation from RNA processing sites in the pheromone-induced plasmid transfer system of Enterococcus faecalis. Proc. Natl. Acad. Sci. USA 93:7794-7799. [DOI] [PMC free article] [PubMed] [Google Scholar]
- 6.Berglund, O. 1975. Ribonucleoside diphosphate reductase induced by bacteriophage T4. III. Isolation and characterization of proteins B1 and B2. J. Biol. Chem. 250:7450-7455. [PubMed] [Google Scholar]
- 7.Bryk, M., and M. Belfort. 1990. Spontaneous shuffling of domains between introns of phage T4. Nature 346:394-396. [DOI] [PubMed] [Google Scholar]
- 8.Chiu, C. S., S. M. Cox, and G. R. Greenberg. 1980. Effect of bacteriophage T4 nrd mutants on deoxyribonucleotide synthesis in vivo. J. Biol. Chem. 255:2747-2751. [PubMed] [Google Scholar]
- 9.Christensen, A. C., and E. T. Young. 1982. T4 late transcripts are initiated near a conserved DNA sequence. Nature 299:369-371. [DOI] [PubMed] [Google Scholar]
- 10.Clokie, M. R., J. Shan, S. Bailey, Y. Jia, H. M. Krisch, S. West, and N. H. Mann. 2006. Transcription of a ‘photosynthetic’ T4-type phage during infection of a marine cyanobacterium. Environ. Microbiol. 8:827-835. [DOI] [PubMed] [Google Scholar]
- 11.Crooks, G. E., G. Hon, J. M. Chandonia, and S. E. Brenner. 2004. WebLogo: a sequence logo generator. Genome Res. 14:1188-1190. [DOI] [PMC free article] [PubMed] [Google Scholar]
- 12.Desplats, C., C. Dez, F. Tetart, H. Eleaume, and H. M. Krisch. 2002. Snapshot of the genome of the pseudo-T-even bacteriophage RB49. J. Bacteriol. 184:2789-2804. [DOI] [PMC free article] [PubMed] [Google Scholar]
- 13.Edgell, D. R. 2005. Free-standing endonucleases of T-even phages: free-loaders or functionaries?, p. 147-160. In M. Belfort, B. L. Stoddard, D. W. Wood, and V. Derbyshire (ed.), Homing endonucleases and inteins. Springer-Verlag, Heidelburg, Germany.
- 14.Edgell, D. R., V. Derbyshire, P. Van Roey, S. LaBonne, M. J. Stanger, Z. Li, T. M. Boyd, D. A. Shub, and M. Belfort. 2004. Intron-encoded homing endonuclease I-TevI also functions as a transcriptional autorepressor. Nat. Struct. Mol. Biol. 11:936-944. [DOI] [PubMed] [Google Scholar]
- 15.Ehretsmann, C. P., A. J. Carpousis, and H. M. Krisch. 1992. Specificity of Escherichia coli endoribonuclease RNase E: in vivo and in vitro analysis of mutants in a bacteriophage T4 mRNA processing site. Genes Dev. 6:149-159. [DOI] [PubMed] [Google Scholar]
- 16.Estrem, S. T., T. Gaal, W. Ross, and R. L. Gourse. 1998. Identification of an UP element consensus sequence for bacterial promoters. Proc. Natl. Acad. Sci. USA 95:9761-9766. [DOI] [PMC free article] [PubMed] [Google Scholar]
- 17.Filee, J., E. Bapteste, E. Susko, and H. M. Krisch. 2006. A selective barrier to horizontal gene transfer in the T4-type bacteriophages that has preserved a core genome with the viral replication and structural genes. Mol. Biol. Evol. 23:1688-1696. [DOI] [PubMed] [Google Scholar]
- 18.Friedrich, N. C., E. Torrents, E. A. Gibb, M. Sahlin, B. M. Sjöberg, and D. R. Edgell. 2007. Insertion of a homing endonuclease creates a genes-in-pieces ribonucleotide reductase that retains function. Proc. Natl. Acad. Sci. USA 104:6176-6181. [DOI] [PMC free article] [PubMed] [Google Scholar]
- 19.Fromont-Racine, M., E. Bertrand, R. Pictet, and T. Grange. 1993. A highly sensitive method for mapping the 5′ termini of mRNAs. Nucleic Acids Res. 21:1683-1684. [DOI] [PMC free article] [PubMed] [Google Scholar]
- 20.Gimble, F. S. 2000. Invasion of a multitude of genetic niches by mobile endonuclease genes. FEMS Microbiol. Lett. 185:99-107. [DOI] [PubMed] [Google Scholar]
- 21.Gogarten, J. P., A. G. Senejani, O. Zhaxybayeva, L. Olendzenski, and E. Hilario. 2002. Inteins: structure, function, and evolution. Annu. Rev. Microbiol. 56:263-287. [DOI] [PubMed] [Google Scholar]
- 22.Gott, J. M., A. Zeeh, D. Bell-Pedersen, K. Ehrenman, M. Belfort, and D. A. Shub. 1988. Genes within genes: independent expression of phage T4 intron open reading frames and the genes in which they reside. Genes Dev. 2:1791-1799. [DOI] [PubMed] [Google Scholar]
- 23.Greenberg, G. R., P. He, J. Hilfinger, and M.-J. Tseng. 1994. Deoxyribonucleoside triphosphate synthesis and phage T4 DNA replication, p. 14-27. In J. D. Karam (ed.), Molecular biology of bacteriophage T4. ASM Press, Washington, DC.
- 24.Gruidl, M. E., T. C. Chen, S. Gargano, A. Storlazzi, A. Cascino, and G. Mosig. 1991. Two bacteriophage T4 base plate genes (25 and 26) and the DNA repair gene uvsY belong to spatially and temporally overlapping transcription units. Virology 184:359-369. [DOI] [PubMed] [Google Scholar]
- 25.Gusarov, I., and E. Nudler. 1999. The mechanism of intrinsic transcription termination. Mol. Cell 3:495-504. [DOI] [PubMed] [Google Scholar]
- 26.Hall, D. H., Y. Liu, and D. A. Shub. 1989. Exon shuffling by recombination between self-splicing introns of bacteriophage T4. Nature 340:575-576. [DOI] [PubMed] [Google Scholar]
- 27.Hsu, T., and J. D. Karam. 1990. Transcriptional mapping of a DNA replication gene cluster in bacteriophage T4. Sites for initiation, termination, and mRNA processing. J. Biol. Chem. 265:5303-5316. [PubMed] [Google Scholar]
- 28.Kadyrov, F. A., M. G. Shlyapnikov, and V. M. Kryukov. 1997. A phage T4 site-specific endonuclease, SegE, is responsible for a non-reciprocal genetic exchange between T-even-related phages. FEBS Lett. 415:75-80. [DOI] [PubMed] [Google Scholar]
- 29.Kutter, E., K. Gachechiladze, A. Poglazov, E. Marusich, M. Shneider, P. Aronsson, A. Napuli, D. Porter, and V. Mesyanzhinov. 1995. Evolution of T4-related phages. Virus Genes 11:285-297. [DOI] [PubMed] [Google Scholar]
- 30.Lambowitz, A. M., and S. Zimmerly. 2004. Mobile group II introns. Annu. Rev. Genet. 38:1-35. [DOI] [PubMed] [Google Scholar]
- 31.Lawrence, C. E., S. F. Altschul, M. S. Boguski, J. S. Liu, A. F. Neuwald, and J. C. Wootton. 1993. Detecting subtle sequence signals: a Gibbs sampling strategy for multiple alignment. Science 262:208-214. [DOI] [PubMed] [Google Scholar]
- 32.Liebig, H. D., and W. Ruger. 1989. Bacteriophage T4 early promoter regions. Consensus sequences of promoters and ribosome-binding sites. J. Mol. Biol. 208:517-536. [DOI] [PubMed] [Google Scholar]
- 33.Liu, Q., A. Belle, D. A. Shub, M. Belfort, and D. R. Edgell. 2003. SegG endonuclease promotes marker exclusion and mediates co-conversion from a distant cleavage site. J. Mol. Biol. 334:13-23. [DOI] [PubMed] [Google Scholar]
- 34.Loayza, D., A. J. Carpousis, and H. M. Krisch. 1991. Gene 32 transcription and mRNA processing in T4-related bacteriophages. Mol. Microbiol. 5:715-725. [DOI] [PubMed] [Google Scholar]
- 35.Luke, K., A. Radek, X. Liu, J. Campbell, M. Uzan, R. Haselkorn, and Y. Kogan. 2002. Microarray analysis of gene expression during bacteriophage T4 infection. Virology 299:182-191. [DOI] [PubMed] [Google Scholar]
- 36.Macdonald, P. M., E. Kutter, and G. Mosig. 1984. Regulation of a bacteriophage T4 late gene, soc, which maps in an early region. Genetics 106:17-27. [DOI] [PMC free article] [PubMed] [Google Scholar]
- 37.Mann, N. H., M. R. Clokie, A. Millard, A. Cook, W. H. Wilson, P. J. Wheatley, A. Letarov, and H. M. Krisch. 2005. The genome of S-PM2, a “photosynthetic” T4-type bacteriophage that infects marine Synechococcus strains. J. Bacteriol. 187:3188-3200. [DOI] [PMC free article] [PubMed] [Google Scholar]
- 38.McPheeters, D. S., A. Christensen, E. T. Young, G. Stormo, and L. Gold. 1986. Translational regulation of expression of the bacteriophage T4 lysozyme gene. Nucleic Acids Res. 14:5813-5826. [DOI] [PMC free article] [PubMed] [Google Scholar]
- 39.Miller, E. S., J. F. Heidelberg, J. A. Eisen, W. C. Nelson, A. S. Durkin, A. Ciecko, T. V. Feldblyum, O. White, I. T. Paulsen, W. C. Nierman, J. Lee, B. Szczypinski, and C. M. Fraser. 2003. Complete genome sequence of the broad-host-range vibriophage KVP40: comparative genomics of a T4-related bacteriophage. J. Bacteriol. 185:5220-5233. [DOI] [PMC free article] [PubMed] [Google Scholar]
- 40.Miller, E. S., E. Kutter, G. Mosig, F. Arisaka, T. Kunisawa, and W. Ruger. 2003. Bacteriophage T4 genome. Microbiol. Mol. Biol. Rev. 67:86-156. [DOI] [PMC free article] [PubMed] [Google Scholar]
- 41.Mueller, J. E., J. Clyman, Y. J. Huang, M. M. Parker, and M. Belfort. 1996. Intron mobility in phage T4 occurs in the context of recombination-dependent DNA replication by way of multiple pathways. Genes Dev. 10:351-364. [DOI] [PubMed] [Google Scholar]
- 42.Mueller, J. E., D. Smith, and M. Belfort. 1996. Exon coconversion biases accompanying intron homing: battle of the nucleases. Genes Dev. 10:2158-2166. [DOI] [PubMed] [Google Scholar]
- 43.Neuwald, A. F., J. S. Liu, and C. E. Lawrence. 1995. Gibbs motif sampling: detection of bacterial outer membrane protein repeats. Protein Sci. 4:1618-1632. [DOI] [PMC free article] [PubMed] [Google Scholar]
- 44.Nolan, J. M., V. Petrov, C. Bertrand, H. M. Krisch, and J. D. Karam. 2006. Genetic diversity among five T4-like bacteriophages. Virol. J. 3:30. [DOI] [PMC free article] [PubMed] [Google Scholar]
- 45.Ohman-Heden, M., A. Ahgren-Stalhandske, S. Hahne, and B. M. Sjoberg. 1993. Translation across the 5′-splice site interferes with autocatalytic splicing. Mol. Microbiol. 7:975-982. [DOI] [PubMed] [Google Scholar]
- 46.Parker, M. M., M. Belisle, and M. Belfort. 1999. Intron homing with limited exon homology. Illegitimate double-strand-break repair in intron acquisition by phage T4. Genetics 153:1513-1523. [DOI] [PMC free article] [PubMed] [Google Scholar]
- 47.Petrov, V. M., and J. D. Karam. 2004. Diversity of structure and function of DNA polymerase (gp43) of T4-related bacteriophages. Biochemistry (Moscow) 69:1213-1218. [DOI] [PubMed] [Google Scholar]
- 48.Petrov, V. M., J. M. Nolan, C. Bertrand, D. Levy, C. Desplats, H. M. Krisch, and J. D. Karam. 2006. Plasticity of the gene functions for DNA replication in the T4-like phages. J. Mol. Biol. 361:46-68. [DOI] [PubMed] [Google Scholar]
- 49.Reynolds, R., and M. J. Chamberlin. 1992. Parameters affecting transcription termination by Escherichia coli RNA. II. Construction and analysis of hybrid terminators. J. Mol. Biol. 224:53-63. [DOI] [PubMed] [Google Scholar]
- 50.Ross, W., K. K. Gosink, J. Salomon, K. Igarashi, C. Zou, A. Ishihama, K. Severinov, and R. L. Gourse. 1993. A third recognition element in bacterial promoters: DNA binding by the alpha subunit of RNA polymerase. Science 262:1407-1413. [DOI] [PubMed] [Google Scholar]
- 50a.Sambrook, J., and D. W. Russell. 2001. Molecular cloning: a laboratory manual, 3rd ed. Cold Spring Harbor Laboratory Press, Cold Spring Harbor, NY.
- 51.Sandegren, L., D. Nord, and B.-M. Sjöberg. 2005. SegH and Hef: two novel homing endonucleases whose genes replace the mobC and mobE genes in several T4-related phages. Nucleic Acids Res. 33:6203-6213. [DOI] [PMC free article] [PubMed] [Google Scholar]
- 52.Sandegren, L., and B.-M. Sjöberg. 2004. Distribution, sequence homology, and homing of group I introns among T-even-like bacteriophages: evidence for recent transfer of old introns. J. Biol. Chem. 279:22218-22227. [DOI] [PubMed] [Google Scholar]
- 53.Schneider, T. D., and R. M. Stephens. 1990. Sequence logos: a new way to display consensus sequences. Nucleic Acids Res. 18:6097-6100. [DOI] [PMC free article] [PubMed] [Google Scholar]
- 54.Sharma, M., R. L. Ellis, and D. M. Hinton. 1992. Identification of a family of bacteriophage T4 genes encoding proteins similar to those present in group I introns of fungi and phage. Proc. Natl. Acad. Sci. USA 89:6658-6662. [DOI] [PMC free article] [PubMed] [Google Scholar]
- 55.Sjöberg, B.-M., S. Hahne, C. Z. Mathews, C. K. Mathews, K. N. Rand, and M. J. Gait. 1986. The bacteriophage T4 gene for the small subunit of ribonucleotide reductase contains an intron. EMBO J. 5:2031-2036. [DOI] [PMC free article] [PubMed] [Google Scholar]
- 56.Stoskiene, G., L. Truncaite, A. Zajanckauskaite, and R. Nivinskas. 19 March 2007, posting date. Middle promoters constitute the most abundant and diverse class of promoters in bacteriophage T4. Mol. Microbiol. doi: 10.1111/j.1365-2958.2007.05659.x. [DOI] [PubMed]
- 57.Thompson, W., E. C. Rouchka, and C. E. Lawrence. 2003. Gibbs Recursive Sampler: finding transcription factor binding sites. Nucleic Acids Res. 31:3580-3585. [DOI] [PMC free article] [PubMed] [Google Scholar]
- 58.Truncaite, L., A. Zajanckauskaite, A. Arlauskas, and R. Nivinskas. 2006. Transcription and RNA processing during expression of genes preceding DNA ligase gene 30 in T4-related bacteriophages. Virology 344:378-390. [DOI] [PubMed] [Google Scholar]
- 59.Tseng, M. J., P. He, J. M. Hilfinger, and G. R. Greenberg. 1990. Bacteriophage T4 nrdA and nrdB genes, encoding ribonucleotide reductase, are expressed both separately and coordinately: characterization of the nrdB promoter. J. Bacteriol. 172:6323-6332. [DOI] [PMC free article] [PubMed] [Google Scholar]
- 60.Tseng, M. J., J. M. Hilfinger, A. Walsh, and G. R. Greenberg. 1988. Total sequence, flanking regions, and transcripts of bacteriophage T4 nrdA gene, coding for alpha chain of ribonucleoside diphosphate reductase. J. Biol. Chem. 263:16242-16251. [PubMed] [Google Scholar]
- 61.Wilkens, K., and W. Ruger. 1996. Characterization of bacteriophage T4 early promoters in vivo with a new promoter probe vector. Plasmid 35:108-120. [DOI] [PubMed] [Google Scholar]
- 62.Wilson, K. S., and P. H. von Hippel. 1995. Transcription termination at intrinsic terminators: the role of the RNA hairpin. Proc. Natl. Acad. Sci. USA 92:8793-8797. [DOI] [PMC free article] [PubMed] [Google Scholar]
- 63.Yarnell, W. S., and J. W. Roberts. 1999. Mechanism of intrinsic transcription termination and antitermination. Science 284:611-615. [DOI] [PubMed] [Google Scholar]
- 64.Zuker, M. 2003. Mfold web server for nucleic acid folding and hybridization prediction. Nucleic Acids Res. 31:3406-3415. [DOI] [PMC free article] [PubMed] [Google Scholar]