
Fig. 3.
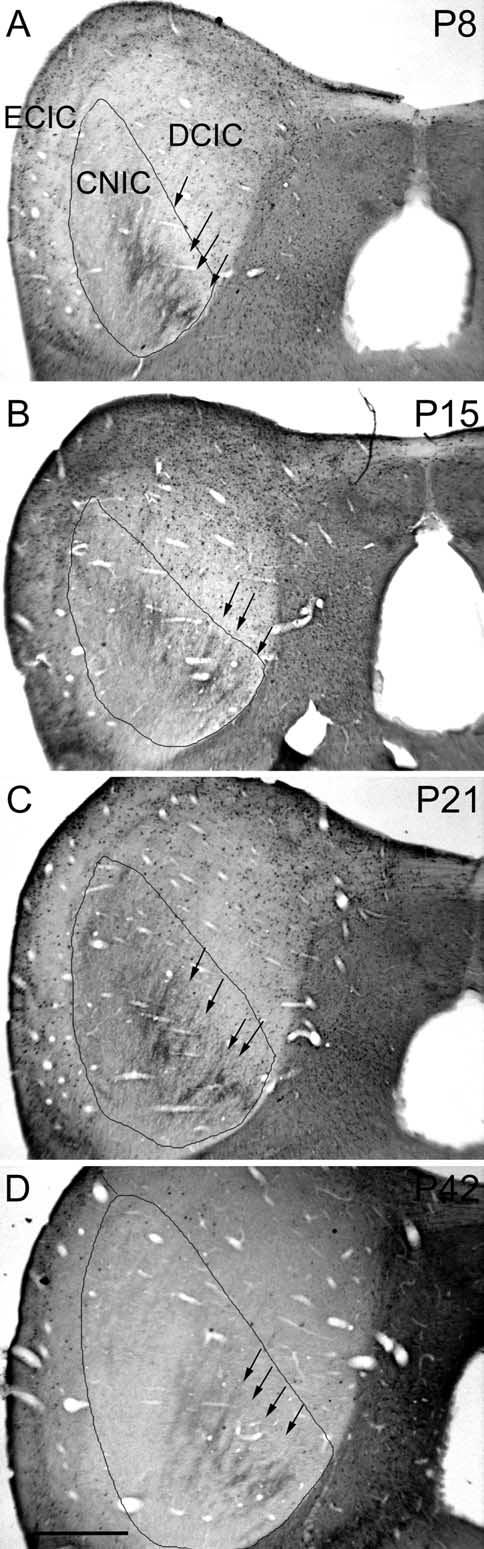
Low magnification photomicrographs illustrating CB-immunostaining in a series of postnatal kitten. Bands (see arrows) are regularly displayed in the pattern of CB-immunostaining at each of the four post-natal ages. At this magnification, developmental changes in surrounding cellular staining are barely apparent. The CNIC is outlined and the main subnuclei of IC are labeled in frame A for reference. Scale bar=0.5 mm.