
Fig. 5.
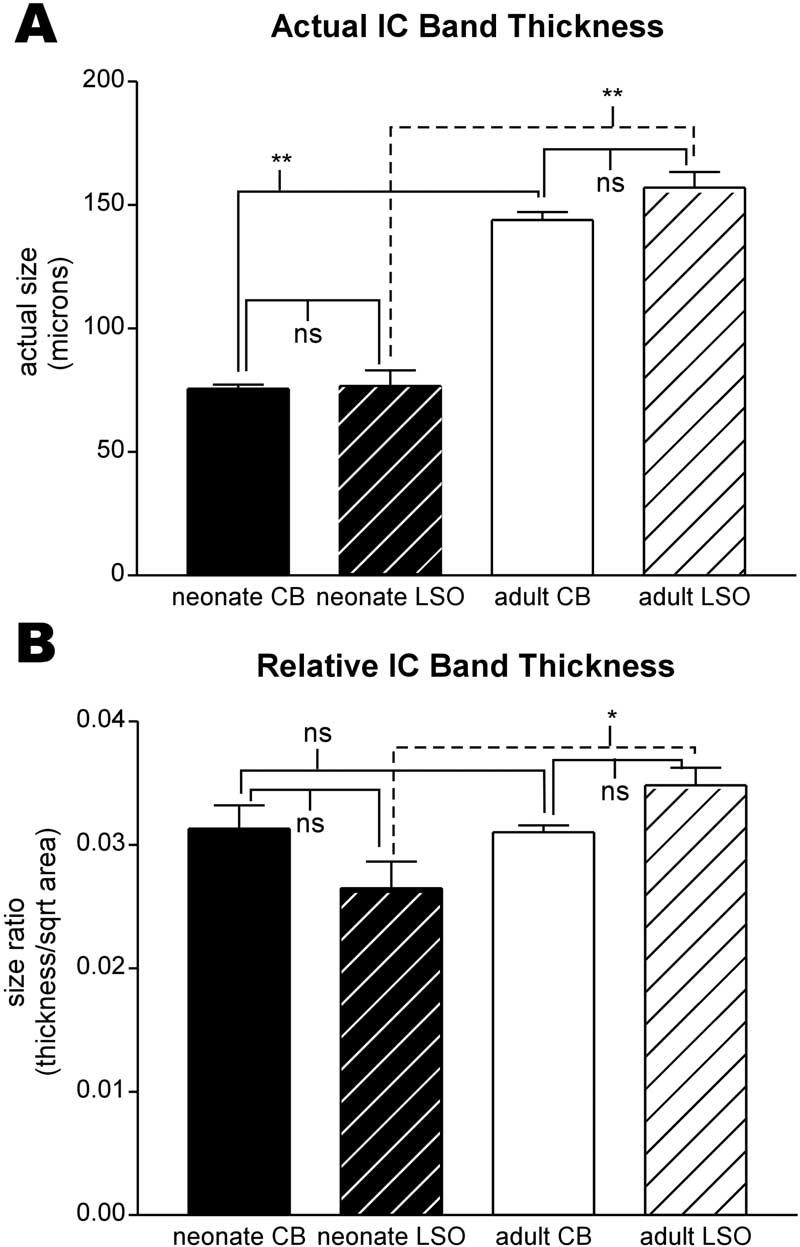
Bar graphs comparing CB- and LSO-band thickness for neonate (black bars) and adult (white bars) IC. (A) Actual mean band thickness and standard deviation. There was no significant difference between thickness of neonate CB and LSO bands; similarly, there was no difference between thickness of adult CB and LSO bands. Both groups of neonate bands were significantly different from the corresponding adult group of bands. (B) Normalized band thickness mean and standard deviation. In contrast to actual band thickness, there was no significant difference between normalized neonate and adult CB band thickness nor between neonate CB and LSO band thickness, although neonate and adult LSO band thicknesses were just different (P=0.03). Brackets in A and B indicate results of Student's t-test comparing groups: * P value <0.05; **P value <0.005; ns, no significant difference.