Abstract
Even healthy adults worry about declines in mental efficiency with aging. Subjective changes in mental flexibility, self-regulation, processing speed, and memory are often cited. We show here that focal decreases in brain activity occur with normal aging as measured with fluorodeoxyglucose and positron emission tomography. The largest declines localize to a medial network including the anterior cingulate/medial prefrontal cortex, dorsomedial thalamus, and sugenual cingulate/basal forebrain. Declining metabolism in this network correlates with declining cognitive function. The medial prefrontal metabolic changes with aging are similar in magnitude to the hypometabolism found in Mild Cognitive Impairment or Alzheimer's disease. These results converge with data from healthy elderly indicating dysfunction in the anterior attention system. The interaction of attention in the anterior cingulate cortex with memory in the medial temporal lobe may explain the global impairment that defines dementia. Despite the implications for an aging population, the neurophysiologic mechanisms of these metabolic decreases remain unknown.
Keywords: aging, attention, anterior cingulate cortex, brain metabolism, PET, Alzheimer's disease, neurodegeneration, Mild Cognitive Impairment
Introduction
The human brain appears remarkably preserved with normal aging, i.e., aging in the absence of disease (Braak et al., 2004). The assertion that the brain declines in function during normal aging remains controversial. Current evidence suggests that the loss of brain neurons with normal aging is far less than previously thought. Neuron counts in the entorhinal cortex, a key structure involved in memory, remain the same from 60 to 90 years old (Gomez-Isla et al., 1996). Therefore, identifying regions of the brain that decline in metabolism with aging and that correlate with diminished cognitive performance in otherwise normal adults becomes a prerequisite for identification, prevention, and treatment of any potential age-associated cognitive decline.
Materials and Method
Human subjects
All volunteers gave informed consent in writing according to the guidelines established by the VA Medical Center and University of Minnesota Institutional Review Boards and the VAMC Radioactive Drug Research Committee. All women of child-bearing potential underwent pregnancy testing before imaging. The volunteers (N = 46) were assessed as follows: 1) self-report of good health; 2) absence of a history of psychiatric or neurological disorder; and 3) absence of lifetime presence of a major psychiatric disorder (except substance abuse limited to current abuse) as determined through a structured clinical interview (SCID) (Spitzer et al., 1992). Thirty-one of these volunteers had additional assessment: 1) normal physical and laboratory examination including urine drug test; 2) negative screening for neuropsychological impairment based upon the Minnesota Cognitive Acuity Screen, MCAS (Knopman et al., 2000); and 3) normal clinical structural MRI. The entire group consisted of 24 men and 22 women with mean age of 56 (SD 20; range 18-90). Forty-four subjects were right-handed; one was ambidextrous; and one was left-handed. Mean Mini-Mental Status Examination (Cockrell and Folstein, M. F. 1988) was 29.1 (SD 1; range 26-30). Criteria for Mild Cognitive Impairment (MCI) were from Petersen (Petersen et al., 2001).
PET Imaging
All subjects fasted before scanning. Fourteen subjects were scanned with ECAT 953B (Siemens, Knoxville, TN) with inter-leaved transmission and emission 2-D scans allowing whole brain coverage. Thirty-two subjects were scanned with ECAT EXACT 47 scanner (Siemens, Knoxville, TN) with transmission and emission 2-D scans that covered the whole brain. The intrinsic axial resolution of ECAT 953B is 5.8 mm (Spinks et al., 1992), and that of ECAT EXACT is 5.0 mm (Wienhard et al., 1992). The small differences in intrinsic resolution between the two scanners have little impact on the final images which were reconstructed with 2-dimensional, filtered back-projection and convolved to a final image resolution of 12 mm full-width at half-maximum before statistical analysis. 18F-fluorodeoxyglucose (5 mCi/70 kg) was injected intravenously. No arterial catheters were used for absolute quantitation. The subject rested during glucose uptake with eyes closed and ears open in a dark, quiet room for 30 min (a default mode of brain function; Raichle et al., 2001). Emission scans were obtained over 10-20 minutes and contained 15 million counts.
Data analysis
Data and procedures were enabled in Oracle v9 (Redwood Shores, CA) as part of the NIH Human Brain Project. Software developed by Minoshima (Minoshima et al., 1994; Minoshima et al., 1995) was used for whole brain normalization of activity, image co-registration, and stereotactic anatomical alignment in Talairach space (Talairach and Tournoux, 1988). Linear (Figure 1) and non-linear warping converged with similar results. In-house software was used to template each image at 40% peak count; to normalize the templated image of the brain to 1,000 counts; and to correlate the normalized counts with age and cognitive scores. At least fifteen subjects had to contribute to an individual voxel to calculate the Pearson correlation coefficient, r. The r was converted into a two-tailed t-score with an associated probability Because of the problem of multiple comparisons, the significance of the correlations was estimated by dividing the experiment-wise probability threshold of 0.05 by the effective number of resolution elements for the whole brain, 586 resels (Worsley et al., 1992); uncorrected p<8.5(10)−5). This threshold was used for image display and for estimating region extent. Table 1 lists the principal regions passing a more stringent threshold (p<0.001 with 586 resels; uncorrected p<1.7(10)−6). The coordinates of the foci are derived from the center-of-mass of local maxima using a search cube of three pixels on side (6.75 mm). Scatterplots used the average regional activity at the stated coordinates. To eliminate the potential confound of an arbitrary choice for the volume of the region of interest, the radius of the spherical regions of interest was varied between 0-3 pixels to ensure that the statistical results were relatively insensitive to the precise radius.
Figure 1.
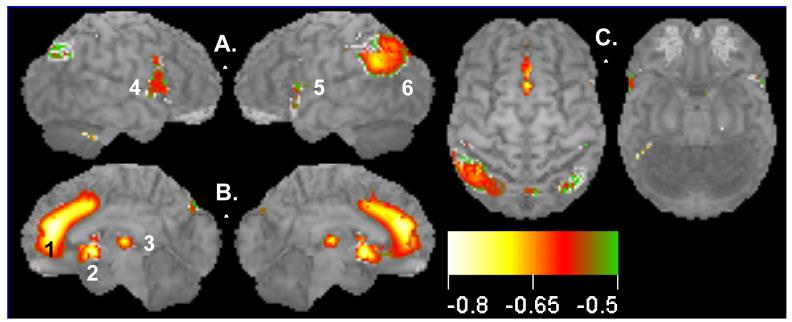
Decline of brain activity with normal aging: negative correlations between glucose uptake (resting brain activity) and age for a group of 46 healthy subjects (ages 18-90). Surface statistical projection (3D-SSP) of correlation between brain activity and age. Views of the brain: A. Left and right lateral views; B. Medial aspects of left and right hemispheres; C. Dorsal and ventral views. Note large area (1695 voxels) of medial prefrontal cortex including the ACC showing decreased activity with aging. Display threshold is set at r = −0.63 with a significance of p<0.05, corrected for multiple comparisons (586 resels). Local clusters (1, 2, 3; anterior to posterior) shown in medial views. Cluster 2 extends from the subgenual anterior cingulate cortex to the basal forebrain. Cluster 3 in the mediodorsal nucleus of the thalamus is consistent with the metabolic declines in prefrontal cortices. Clusters (4, 5, 6; anterior to posterior) are shown in lateral views. Color scale denotes Pearson correlation coefficient, r, from −0.6 to −0.8. See Table 1 for details.
Table 1.
Clusters of negative correlation of brain activity with age (from Fig. 1).
| Cluster | Region Name | BA | x mm | y mm | z mm | r | Voxels |
|---|---|---|---|---|---|---|---|
| 1 | Medial frontal gyrus | 9 | 1 | 41 | 18 | −0.79 | 1695 |
| Cingulate sulcus | |||||||
| Anterior cingulate gyrus | 32 | 3 | 16 | 36 | −0.71 | ||
| 2 | sgACC/basal forebrain | −1 | 10 | −2 | −0.73 | 423 | |
| 3 | Dorsomedial thalamus | 1 | −19 | 7 | −0.73 | 146 | |
| 4,5 | Inferior frontal gyrus, left | 44 | −44 | 5 | 31 | −0.73 | 497 |
| Inferior frontal gyrus, right | 44 | 48 | 14 | 25 | −0.72 | 569 | |
| 6 | Inferior parietal lobule, left | 40 | −55 | −51 | 29 | −0.71 | 1099 |
| Inferior parietal lobule, left | 40 | −46 | −60 | 40 | −0.65 | ||
Clusters (1-6) are seen from anterior to posterior in Figure 1. BA, approximate Broadmann area; (x,y,z) peak within cluster in Talairach coordinates in mm; r, Pearson correlation; voxels, number of voxels within cluster; sgACC, subgenual ACC. Cluster 1 is expansive and includes several regions; coordinates are only provided for local maxima.
Results
Figure 1 illustrates the Pearson correlation (r) between glucose uptake and age, projected onto the surface of the brain. These maps display the highest correlation of any brain voxel within a 10 mm perpendicular to the brain surface (3-D Surface Statistical Maps, 3D-SSP; Minoshima et al., 1995). Three medial regions showed the largest negative correlations (i.e., reduction in activity with age); the anterior cingulate cortex (ACC)/cingulate sulcus/medial prefrontal gyrus (Cluster 1, Figure 1B; peak r = −0.79); the subgenual cingulate cortex/basal forebrain (Cluster 2, Figure 1B; peak r = −0.73); and the dorsomedial thalamus (Cluster 3, Figure 1B; peak r = −0.73). Several lateral regions showed less robust correlations: bilateral inferior frontal gyri (Clusters 4 and 5, Figure 1A) and left inferior parietal cortex (Cluster 6, Figure 1A). Table 1 identifies the locations of the center of mass of the foci of peak negative correlation in Figure 1 along with the number of voxels in each cluster above a significance threshold of r = −0.63, i.e., p<0.05 after correction for multiple comparisons. For completeness, there were regions of positive correlation in the occipital lobe; however, these may be artifacts of normalization and are difficult to interpret.
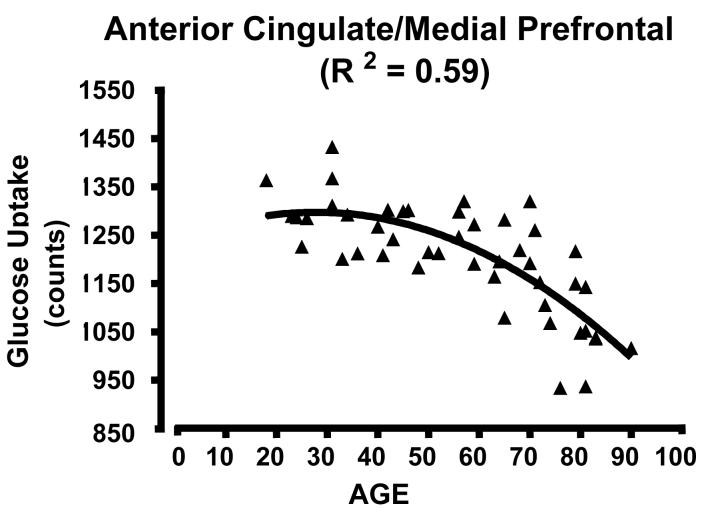
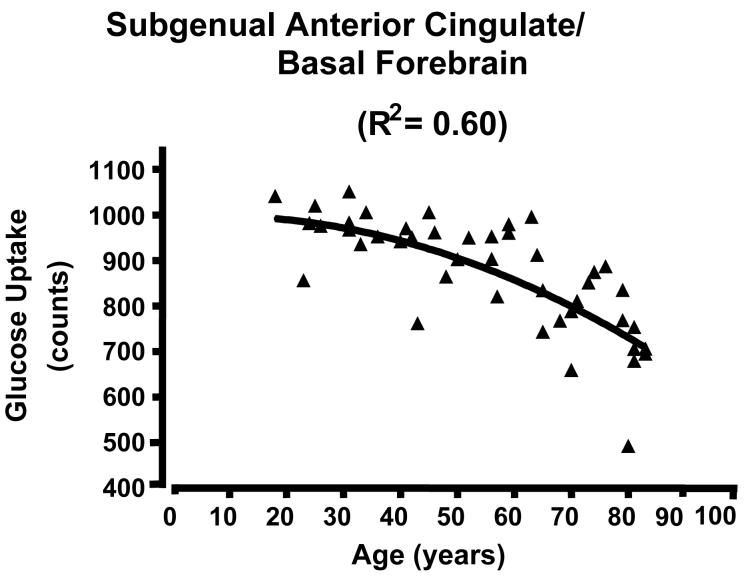
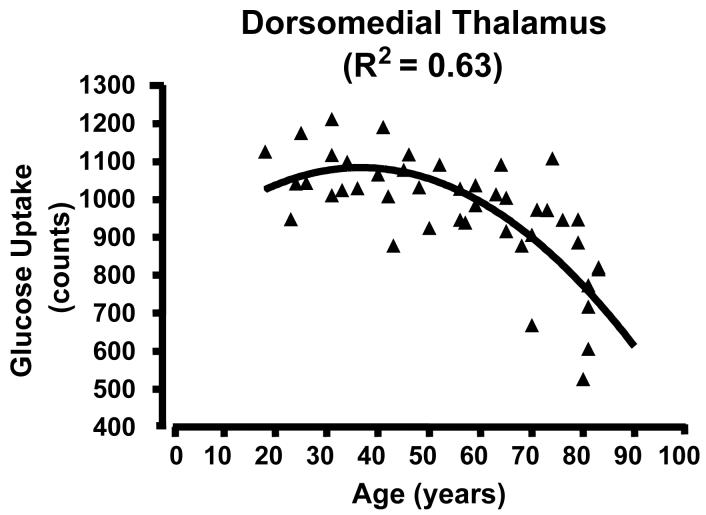
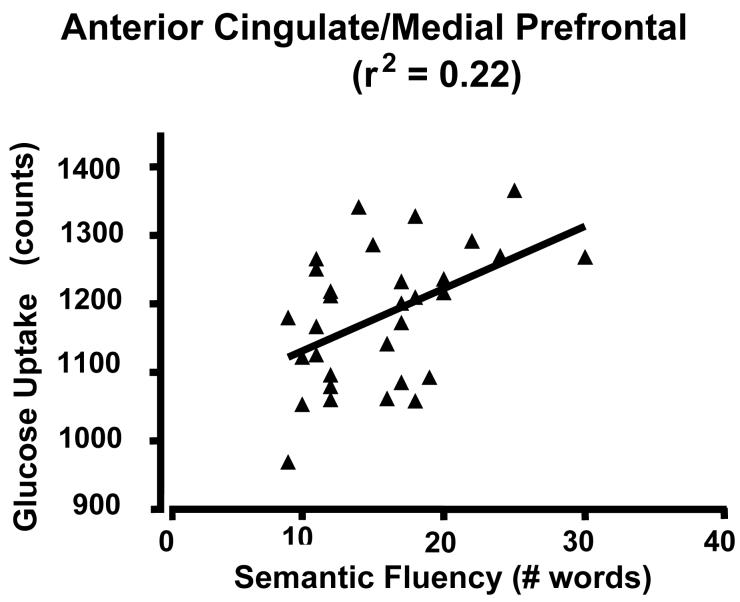
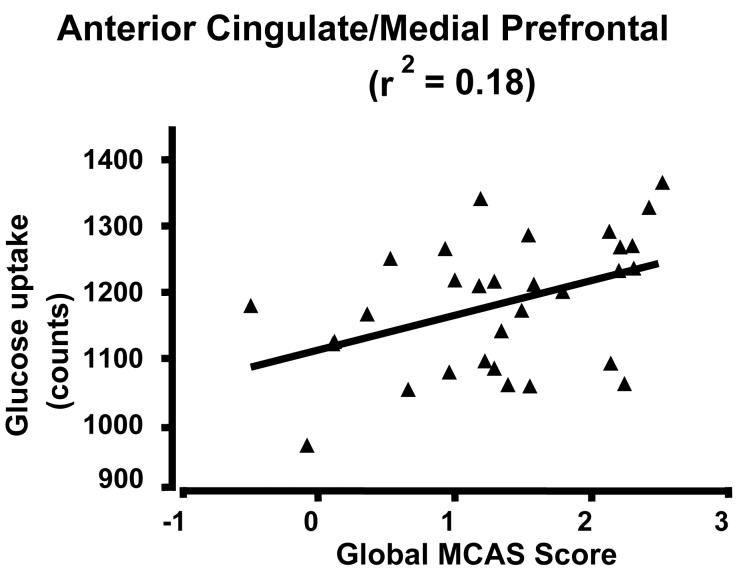
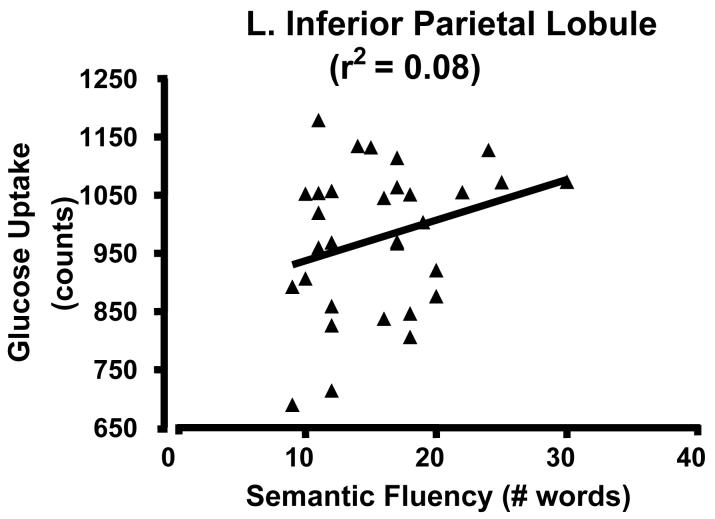
Scatter plots of glucose uptake versus age at the center of mass for each of the three medial regions confirmed both the absence of outliers and a curvilinear quadratic trend throughout the lifespan accounting for about 60% of the variance (Fig. 2). For young adults, the curve appears flat. For the dorsomedial thalamus, a local maximum in metabolism occurs between 30-40 years of age (Figure 2C). Of interest, the decreasing glucose uptake in all three medial regions correlated with the decline in cognitive performance scores, specifically the total MCAS score and the verbal fluency score (i.e., number of exemplars in a broad semantic category produced in 30 seconds) (e.g., Figure 3 A and B p < 0.05; r2 ≈ 0.20). However, the lateral regions showed no significant correlation with cognitive decline (e.g., Figure 3C). To determine if the activity in the three medial regions correlated with each other, partial correlation coefficients were calculated regressing the effect of age. None of these correlations approached significance.
Figure 2.
Scatterplots of glucose uptake in a region of interest located at the center of mass of the medial clusters showing high correlation between glucose uptake and age across the lifespan. There is a curvilinear, quadratic relationship between uptake and age. A) AC/medial prefrontal cluster; curve R2 = 0.59; B) subgenual AC; R2 = 0.60; C) dorsomedial thalamus; R2 = 0.53 . Note that the decline begins in adulthood and extends to the elderly. See clusters in Figure 1 and locations in Table 1.
Figure 3.
Scatterplot of glucose uptake and cognitive scores. A) ACC/medial prefrontal cluster and verbal fluency; B) ACC/medial prefrontal and total MNCAS score; and C) Left inferior parietal lobe and verbal fluency
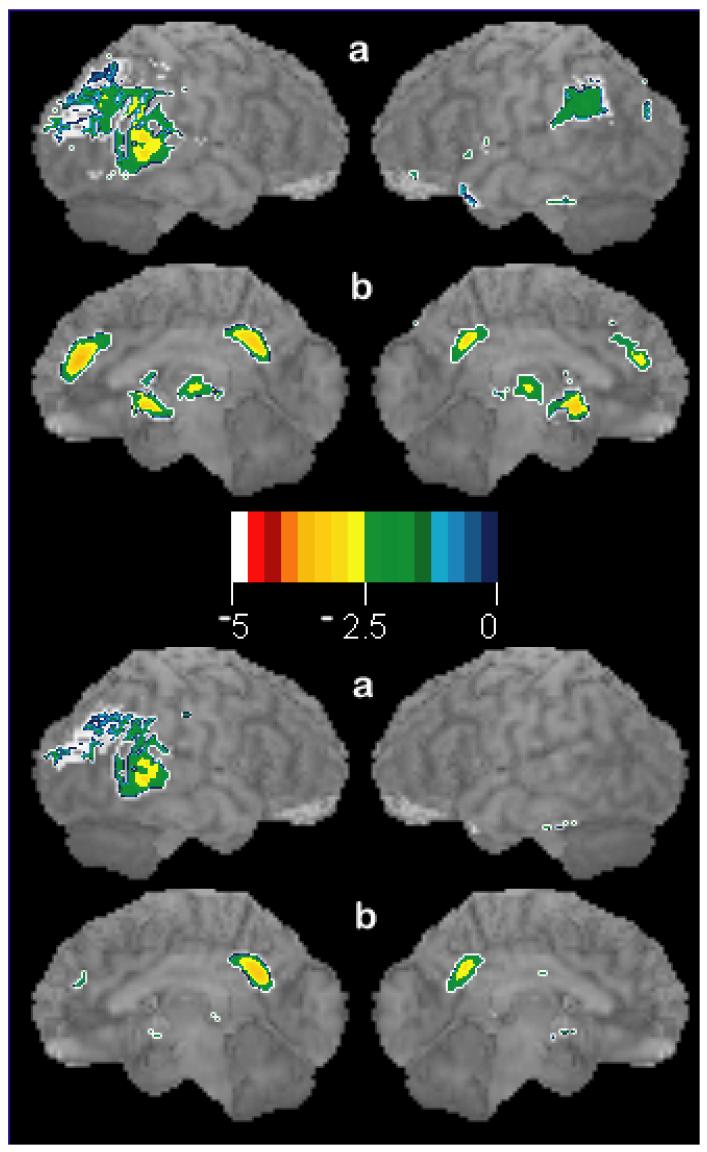
The correlation map of the subjects with full work-ups (physical examination; laboratory studies; neuropsychological screening; and MRI) converged with the map of all subjects combined (not shown). In individual subjects assessed for early Alzheimer's disease (MCI) without age-correction, the medial prefrontal changes are as large as those seen classically in Alzheimer's disease (Figure 4). Age correction removes the medial prefrontal decreases and highlights only the parietal changes found classically related to Alzheimer's disease.
Figure 4.
Surface statistical projection of decreases in glucose uptake in a seventy-six year old patient (scan pL0047) with Mild Cognitive Impairment (MCI) as compared to 33 healthy control subjects with average age of 52 years. Upper panel shows changes without age correction in classical Alzheimer's disease (parietal and posterior cingulate) as well as the changes reported here (AC, subgenual AC/basal forebrain, and dorsomedial thalamus). Lower panel shows the decreases in glucose uptake when age-regressed to 76 years: only classical Alzheimer's changes are noted. For display purposes, threshold t-score = −2.0, p ≈ 0.05 without multiple correction. Orientation of brains (a,b) in each panel follows convention in Figure 1. Color scale indicates t-scores (−5 to 0).
Discussion
Decreased glucose uptake with age in the ACC, other medial regions, as well as the lateral clusters may reflect tissue loss or shrinkage (structural atrophy), decreased glucose metabolism, or both. PET alone cannot currently distinguish between these two possibilities. Modern, high resolution, structural MRI measurements of the thickness of cortical grey matter over the life span show in one study thickening of the ACC with extension to the subcallosal cortex (Salat et al., 2004), while in another case the grey matter density was noted to decrease less precipitously and to a lesser extent than on the lateral brain surfaces (Sowell et al., 2003). The cingulate sulcus enlarges with aging which could result in an apparent decrease in metabolism because of partial volume effects in PET (Kochunov et al., 2005). One study with a large sample reported that their atrophy correction could account for most reductions in metabolism with aging (Yanase et al., 2005). However, the magnitude of the corrections approached the magnitude of the actual measurements (75-120% changes in regional metabolism), and no cognitive measures were obtained. We conclude that the changes seen here probably reflect, at least in part, decreased metabolic activity.
In contrast, PET studies of patients with early Alzheimer's disease (i.e., Mild Cognitive Impairment, MCI) and pre-symptomatic Alzheimer's disease find parietal and posterior cingulate hypometabolism (Reiman et al., 1996; Silverman et al., 2001). These changes are not found in Figure 1 except to a lesser degree in left parietal cortex. If brain metabolism is not adjusted for age, our data indicate that individual MCI patients can have ACC hypometabolism as large as the typical PET metabolic changes seen in Alzheimer's disease (Fig. 4). Therefore, these data fail to support the hypothesis that normal aging and Alzheimer's disease are simply different stages of normal senescence.
The decline in medial frontal metabolism with aging can have multiple interpretations. We favor a pathologic process given the age-associated cognitive decline seen in this cohort. However, increases in synaptic efficiency and pruning could account for reduced metabolism without the necessity to invoke pathology. The latter processes may account for the slight reduction in dorsomedial thalamic metabolism in those under 30 years old.
Besides the ACC, two other medial structures showed prominent metabolic decline with aging. The extension of the subgenual anterior cingulate hypoactivity into the subcallosal cingulate and the basal forebrain is noteworthy. Unfortunately, the limited resolution prevents clear separation between these structures. The involvement of the basal forebrain in Alzheimer's disease has been known since 1981 (Whitehouse et al., 1981). These data suggest that some involvement of this region or projections to this region may undergo aging effects. Also, the decline in the mediodorsal nucleus of the thalamus is consistent with the prefrontal hypometabolism observed with aging.
Diminished glucose uptake, reflecting diminished brain metabolism and/or atrophy, correlated with age-associated cognitive decline in this healthy sample. Total MCAS score and verbal fluency showed this effect. Alzheimer's or other pathology may be present in the healthy elderly, but it has not yet become manifest because of minimal brain involvement or because of cognitive reserve (Jagust et al., 2006; Bennett et al., 2006). However, this sample did not show the posterior cingulate changes seen typically in early Alzheimer's disease or Mild Cognitive Impairment (Figure 4). At some point, the question becomes semantic if it is not possible to ascertain health without awaiting many years of follow-up. Regardless, our data point to an anatomically interconnected, medial prefrontal circuit consisting of ACC/medial frontal gyrus; subgenual anterior cingulate cortex/basal forebrain; and mediodorsal thalamsus as a nexus of the earliest cognitive changes, particularly in executive function, associated with the aging process.
The involvement of the anterior cingulate cortex in aging is supported by previous studies. Martin (Martin et al., 1991) found within the ACC a negative correlation (r = −0.61, p<0.01) between regional brain blood flow, also a marker for brain activity, and age in 30 resting, healthy subjects with ages 30-85 years. Moeller (Moeller et al., 1996) provided evidence for a decline in metabolism in the medial frontal region of 130 healthy volunteers with ages 21-90 years. Schultz (Schultz et al., 1999) looked for age-related decreases in brain blood flow in 37 healthy subjects with ages 19-50 years. They found that the medial frontal cortex, including the ACC, showed the largest negative correlation (r = −0.63, p<0.001) and noted that these changes occurred in young and mid-life adults. Despite these key previous observations, the prominence of ACC and medial prefrontal declines with aging throughout the lifespan are not widely appreciated. Several reasons may account for this across the different studies: use of region of interest analyses; lack of adjustment for multiple comparisons; sparse data on cortical thinning; and older PET scanner technology with decreased axial sampling and decreased signal-to-noise ratios. Our study not only confirms and highlights ACC involvement in normal aging, but also relates the finding to age-associated cognitive decline. To our knowledge, this relationship has not been reported previously.
The ACC has multiple functions, perhaps most importantly, in attention and mood regulation (Posner and Rothbart, M. K. 1998). Unlike memory performance, these brain functions are more difficult to isolate and quantify; they have only recently become a focus for aging research. As might be anticipated from the present data, healthy elderly adults show evidence of dysfunction in attention and in ACC activation. Milham (Milham et al., 2002) found behavioral and imaging evidence in ten, healthy, elderly adults consistent with ACC dysfunction in the Stroop paradigm, a task involving conflict that recruits the ACC (Pardo et al., 1990). Older adults showed age-related increases in sensitivity to competing information and required greater ACC activation to accomplish the same task as young adults. We estimate from our data (Figure 2A) that these increases in BOLD signal arose despite an approximate 8% decrease in ACC metabolism. Spierler, Balota, and Faust detected an impairment in inhibitory processing (one component of conflict resolution) during the Stroop task consistent with ACC dysfunction in healthy elderly adults (Spieler et al., 1996). Therefore, both the performance in attention tasks and imaging data indicate a decline in ACC function with normal aging. A degraded interaction of the ACC, supporting many cognitive functions, with the medial temporal lobe, involved in mnemonic processing, may explain the global cognitive impairment that defines dementia.
These results reveal the ACC and adjacent regions in the medial frontal lobe as key targets for tomorrow's interventions to treat or prevent the loss in brain function associated with normal aging. Identifying the loci of brain decline with aging should enable more refined and specific neuropsychological tests to detect and characterize the specific cognitive operations of attention that decline with aging. The ACC can show plasticity in recovery of attentional functions (Janer and Pardo, 2001) and is rich in neuromodulators (Boskurt et al., 2005) whose activity can be changed with medications. Cognitive tasks recruiting the ACC offer potential rehabilitation strategies to reverse the effects of aging. Aerobic and cardiovascular fitness modulates ACC plasticity and has been shown to improve cognition in healthy older adults (Colcombe et al., 2004).
Acknowledgments
This work was supported by the NIH (RO1 AG120852), the Alzheimer's Disease Association, and the Department of Veterans Affairs. We thank the many volunteers who participated in this study for their generosity and patience; the staff at Lifescan, Edina, MN, for excellent technical support; and our colleagues at the Cognitive Neuroimaging Unit. We thank the anonymous reviewers for providing recommendations that improved this work.
Footnotes
Publisher's Disclaimer: This is a PDF file of an unedited manuscript that has been accepted for publication. As a service to our customers we are providing this early version of the manuscript. The manuscript will undergo copyediting, typesetting, and review of the resulting proof before it is published in its final citable form. Please note that during the production process errors may be discovered which could affect the content, and all legal disclaimers that apply to the journal pertain.
References
- Bennett DA, Schneider JA, Arvanitakis ZM, Kelly JF, Aggarwal NT, Shah RC, Wilson RS. Neuropathology of older persons without cognitive impairment from two community-based studies. Neurology. 2006;66:1837–1844. doi: 10.1212/01.wnl.0000219668.47116.e6. [DOI] [PubMed] [Google Scholar]
- Boskurt A, Zilles K, Schleicher A, Kamper L, Argita ES, Uylings HBM, Kotter R. Distributions of transmitter receptors in the macaque cingulate cortex. Neuroimage. 2005;25:219–229. doi: 10.1016/j.neuroimage.2004.10.040. [DOI] [PubMed] [Google Scholar]
- Braak H, Tredici KD, Braak E. Spectrum of Pathology. In: Petersen RC, editor. Mild Cognitive Impairment. Oxford Press; New York: 2004. pp. 149–189. [Google Scholar]
- Cockrell JR, Folstein MF. Mini-Mental State Examination (MMSE) Psychopharmacol. Bull. 1988;24:689–692. [PubMed] [Google Scholar]
- Colcombe SJ, Kramer AF, Erickson KI, Scalf P, McAuley E, Cohen NJ, Webb A, Jerome GJ, Marquez DX, Elavsky S. Cardiovascular fitness, cortical plasticity, and aging. Proc. Natl. Acad. Sci. U. S. A. 2004;101:3316–3321. doi: 10.1073/pnas.0400266101. [DOI] [PMC free article] [PubMed] [Google Scholar]
- Gomez-Isla T, Price JL, McKeel DW, Jr., Morris JC, Growdon JH, Hyman BT. Profound loss of layer II entorhinal cortex neurons occurs in very mild Alzheimer's disease. J. Neurosci. 1996;16:4491–4500. doi: 10.1523/JNEUROSCI.16-14-04491.1996. [DOI] [PMC free article] [PubMed] [Google Scholar]
- Jagust W, Gitcho A, Sun F, Kuczynski B, Mungas D, Haan M. Brain imaging evidence of preclinical Alzheimer's disease in normal aging. Ann Neurol. 2006;59:673–681. doi: 10.1002/ana.20799. [DOI] [PubMed] [Google Scholar]
- Janer KW, Pardo JV. Deficits in selective attention following bilateral anterior cingulotomy. J. Cognit. Neurosci. 2001;3:231–241. doi: 10.1162/jocn.1991.3.3.231. [DOI] [PubMed] [Google Scholar]
- Knopman DS, Knudson D, Yoes ME, Weiss DJ. Development and standardization of a new telephonic cognitive screening test: the Minnesota Cognitive Acuity Screen (MCAS) Neuropsychiatry Neuropsychol. Behav. Neurol. 2000;13:286–296. [PubMed] [Google Scholar]
- Kochunov P, Mangin JF, Coyle T, Lancaster J, Thompson P, Riviere D, Cointepas Y, Regis J, Schlosser A, Royall DR, Zilles K, Mazziotta J, Toga A, Fox PT. Age-related morphology trends of cortical sulci. Hum. Brain Mapp. 2005;26:210–220. doi: 10.1002/hbm.20198. [DOI] [PMC free article] [PubMed] [Google Scholar]
- Martin AJ, Friston KJ, Colebatch JG, Frackowiak RS. Decreases in regional cerebral blood flow with normal aging. J. Cereb. Blood Flow Metab. 1991;11:684–689. doi: 10.1038/jcbfm.1991.121. [DOI] [PubMed] [Google Scholar]
- Milham MP, Erickson KI, Banich MT, Kramer AF, Webb A, Wszalek T, Cohen NJ. Attentional control in the aging brain: insights from an fMRI study of the stroop task. Brain Cogn. 2002;49:277–296. doi: 10.1006/brcg.2001.1501. [DOI] [PubMed] [Google Scholar]
- Minoshima S, Frey KA, Koeppe RA, Foster NL, Kuhl DE. A diagnostic approach in Alzheimer's disease using three-dimensional stereotactic surface projections of fluorine-18-FDG PET. J. Nucl. Med. 1995;36:1238–1248. [PubMed] [Google Scholar]
- Minoshima S, Koeppe RA, Frey KA, Kuhl DE. Anatomic standardization: linear scaling and nonlinear warping of functional brain images. J. Nucl. Med. 1994;35:1528–1537. [PubMed] [Google Scholar]
- Moeller JR, Ishikawa T, Dhawan V, Spetsieris P, Mandel F, Alexander GE, Grady C, Pietrini P, Eidelberg D. The metabolic topography of normal aging. J. Cereb. Blood Flow Metab. 1996;16:385–398. doi: 10.1097/00004647-199605000-00005. [DOI] [PubMed] [Google Scholar]
- Pardo JV, Pardo PJ, Janer KW, Raichle ME. The anterior cingulate cortex mediates processing selection in the Stroop attentional conflict paradigm. Proc. Natl. Acad. Sci. U. S. A. 1990;87:256–259. doi: 10.1073/pnas.87.1.256. [DOI] [PMC free article] [PubMed] [Google Scholar]
- Petersen RC, Doody R, Kurz A, Mohs RC, Morris JC, Rabins PV, Ritchie K, Rossor M, Thal L, Winblad B. Current concepts in mild cognitive impairment. Arch. Neurol. 2001;58:1985–1992. doi: 10.1001/archneur.58.12.1985. [DOI] [PubMed] [Google Scholar]
- Posner MI, Rothbart MK. Attention, self-regulation and consciousness. Philos. Trans. R. Soc. Lond B Biol. Sci. 1998;353:1915–1927. doi: 10.1098/rstb.1998.0344. [DOI] [PMC free article] [PubMed] [Google Scholar]
- Raichle ME, MacLeod AM, Snyder AZ, Powers WJ, Gusnard DA, Shulman GL. A default mode of brain function. Proc. Natl. Acad. Sci. U. S. A. 2001;98:676–682. doi: 10.1073/pnas.98.2.676. [DOI] [PMC free article] [PubMed] [Google Scholar]
- Reiman EM, Caselli RJ, Yun LS, Chen K, Bandy D, Minoshima S, Thibodeau SN, Osborne D. Preclinical evidence of Alzheimer's disease in persons homozygous for the epsilon 4 allele for apolipoprotein E. N. Engl. J. Med. 1996 Mar 21;334:752–758. doi: 10.1056/NEJM199603213341202. [DOI] [PubMed] [Google Scholar]
- Salat DH, Buckner RL, Snyder AZ, Greve DN, Desikan RS, Busa E, Morris JC, Dale AM, Fischl B. Thinning of the cerebral cortex in aging. Cereb. Cortex. 2004;14:721–730. doi: 10.1093/cercor/bhh032. [DOI] [PubMed] [Google Scholar]
- Schultz SK, O'Leary DS, Boles Ponto LL, Watkins GL, Hichwa RD, Andreasen NC. Age-related changes in regional cerebral blood flow among young to mid-life adults. Neuroreport. 1999;10:2493–2496. doi: 10.1097/00001756-199908200-00011. [DOI] [PubMed] [Google Scholar]
- Silverman DH, Small GW, Chang CY, Lu CS, Kung De Aburto MA, Chen W, Czernin J, Rapoport SI, Pietrini P, Alexander GE, Schapiro MB, Jagust WJ, Hoffman JM, Welsh-Bohmer KA, Alavi A, Clark CM, Salmon E, de Leon MJ, Mielke R, Cummings JL, Kowell AP, Gambhir SS, Hoh CK, Phelps ME. Positron emission tomography in evaluation of dementia: Regional brain metabolism and long-term outcome. JAMA. 2001;286:2120–2127. doi: 10.1001/jama.286.17.2120. [DOI] [PubMed] [Google Scholar]
- Sowell ER, Peterson BS, Thompson PM, Welcome SE, Henkenius AL, Toga AW. Mapping cortical change across the human life span. Nat. Neurosci. 2003;6:309–315. doi: 10.1038/nn1008. [DOI] [PubMed] [Google Scholar]
- Spieler DH, Balota DA, Faust ME. Stroop performance in healthy younger and older adults and in individuals with dementia of the Alzheimer's type. J. Exp. Psychol. Hum. Percept. Perform. 1996;22:461–479. doi: 10.1037//0096-1523.22.2.461. [DOI] [PubMed] [Google Scholar]
- Spinks TJ, Jones T, Bailey DL, Townsend DW, Grootoonk S, Bloomfield PM, Gilardi MC, Casey ME, Sipe B, Reed J. Physical performance of a positron tomography for brain imaging with retractable septa. Phys. Med. Biol. 1992;37:1637–1655. doi: 10.1088/0031-9155/37/8/002. [DOI] [PubMed] [Google Scholar]
- Spitzer RL, Williams JB, Gibbon M, First MB. The Structured Clinical Interview for DSM-III-R (SCID). I: History, rationale, and description. Arch. Gen. Psychiatry. 1992;49:624–629. doi: 10.1001/archpsyc.1992.01820080032005. [DOI] [PubMed] [Google Scholar]
- Talairach J, Tournoux P. Co-Planar Stereotaxic Atlas of the Human Brain. Thieme; New York: 1988. [Google Scholar]
- Weinhard K, Eriksson L, Grootoonk S, Casey M, Pietrzyk U, Heiss HD. Performance evaluation of the positron scanner ECAT EXACT. J. Comput. Assist. Tomogr. 1992;16:804–813. doi: 10.1097/00004728-199209000-00024. [DOI] [PubMed] [Google Scholar]
- Whitehouse PJ, Price DL, Clark AW, Coyle JT, DeLong MR. Alzheimer disease: evidence for selective loss of cholinergic neurons in the nucleus basalis. Ann Neurol. 1981;10:122–126. doi: 10.1002/ana.410100203. [DOI] [PubMed] [Google Scholar]
- Worsley KJ, Evans AC, Marrett S, Neelin P. A three-dimensional statistical analysis for CBF activation studies in human brain. J. Cereb. Blood Flow Metab. 1992;12:900–918. doi: 10.1038/jcbfm.1992.127. [DOI] [PubMed] [Google Scholar]
- Yanase D, Matsunari I, Yajima K, Chen W, Fujikawa A, Nishimura S, Matsuda H, Yamada M. Brain FDG PET study of normal aging in Japanese: effect of atrophy correction. Eur. J. Nucl. Med Mol. Imaging. 2005;32:794–805. doi: 10.1007/s00259-005-1767-2. [DOI] [PubMed] [Google Scholar]


