

Abstract
Aims/hypothesis
The thiazolidinedione (TZD) rosiglitazone is a peroxisome proliferator-activated receptor-γ agonist that induces adipocyte differentiation and, hence, lipid accumulation. This is in apparent contrast to the long-term glucose-lowering, insulin-sensitising effect of rosiglitazone. We tested whether the action of rosiglitazone involves specific effects on mature adipocytes, which are different from those on preadipocytes.
Materials and methods
Differentiated mature 3T3-L1 adipocytes were used as an in vitro model. Transcriptomics, proteomics and assays of metabolism were applied to assess the effect of rosiglitazone in different insulin and glucose conditions.
Results
Rosiglitazone does not induce an increase, but rather a decrease in the lipid content of mature adipocytes. Analysis of transcriptome data, confirmed by quantitative RT-PCR and measurements of lipolysis, indicates that an altered energy metabolism may underlie this change. The pathway analysis shows a consistent picture dominated by lipid catabolism. In addition, we confirmed at both mRNA level and protein level that rosiglitazone represses adipokine expression and production, except for genes encoding adiponectin and apolipoprotein E. Moreover, transcriptome changes indicate that a general repression of genes encoding secreted proteins occurs.
Conclusions/interpretation
Our findings suggest that the change of adiposity as seen in vivo reflects a shift in balance between the different effects of TZDs on preadipocytes and on mature adipocytes, while the changes in circulating adipokine levels primarily result from an effect on mature adipocytes.
Electronic supplementary material
Supplementary material is available in the online version of this article at http://dx.doi.org/10.1007/s00125-006-0565-0 and is accessible to authorised users only
Keywords: Adipokine, Adipose tissue, Energy metabolism, Lipogenesis, Lipolysis, Mature adipocytes, Microarray, Secretion, Thiazolidinediones
Introduction
Rosiglitazone (BRL-49653), a thiazolidinedione (TZD) drug, is used in the treatment of type 2 diabetes mellitus [1]. It has been proposed that the glucose-lowering action of TZDs is mainly mediated by activating peroxisome proliferator-activated receptor (PPAR)-γ (PPARG) [2, 3]. PPARG is most abundantly produced in adipose tissue, suggesting that this is the primary site of action of TZDs [4]. Proposed mechanisms underlying the adipocyte-mediated glucose-lowering action of TZDs are the trapping of fatty acids inside adipocytes and away from muscle, the so-called ‘fatty acid steal’ hypothesis and the altering adipokine release [1].
PPARG is a critical transcription factor in adipogenesis [5]. Its production increases strongly during adipocyte differentiation [6]. By activating PPARG, rosiglitazone promotes adipocyte differentiation in vitro [7, 8]. An increase in the number of small adipocytes and fat mass by TZDs in both animal models and human subjects, suggests that adipocyte differentiation also occurs in vivo [9, 10]. Compared with preadipocytes, adipocytes have a much higher capacity for fatty acid uptake and lipid storage and are potentially more insulin-sensitive due to higher numbers of glucose transporters and insulin receptors [6]. By increasing the number of adipocytes, TZDs can lower circulating NEFA and improve lipid exposure of peripheral tissues, thus improving whole-body insulin sensitivity [1].
This hypothesis is clearly attractive, but other effects of TZDs may occur. It has been pointed out that the increased number of small adipocytes caused by TZD treatment is not only a result of the appearance of new adipocytes, but also due to the shrinkage and/or disappearance of existing mature adipocytes [10]. TZD-induced body weight gain in vivo is used as a marker of increased adiposity. However, there is evidence that this may also be due to fluid retention [11]. In fact, the fat mass may be unaffected or even decreased. In ob/ob mouse, whole body weight was increased, but the fat pad weight was not changed after rosiglitazone treatment [12]. In type 2 diabetes patients, the visceral fat area was found to be decreased [13]. ‘Fatty acid steal’ therefore is not just a matter of increased lipid storage.
The maturation of adipocytes is positively correlated with the production of adipokines. Several of these profoundly influence insulin sensitivity and glucose metabolism, e.g. leptin, adiponectin and resistin [14]. However, it has been observed that TZDs decrease the circulating level of individual adipokines such as leptin [15], resistin [16] and plasminogen activator inhibitor-1 [17], and also of cytokines [18]. A decreased production of these adipokines by TZDs seems to conflict with the adipogenic properties of these drugs.
The above discrepancy could be due to different effects on preadipocytes and mature adipocytes in adipose tissue. It is clear that TZDs stimulate preadipocytes into the process of differentiation. However, their effect on mature adipocytes is less clear. In vivo studies do not allow us to distinguish between the effects on these two cell types. Therefore, to study the effects of TZDs on mature adipocytes, we used in vitro differentiated mature 3T3-L1 adipocytes. In addition to the assessment of lipid accumulation and adipokine secretion, we used transcriptomics to obtain insight into the effects of rosiglitazone. Although high insulin and high glucose levels mimic the situation in vivo when rosiglitazone is administered, we also included low insulin and low glucose levels for comparison.
Materials and methods
Cell culture and sample preparation Murine 3T3-L1 fibroblasts (CL-173; American Type Culture Collection, Manassas, VA, US) were cultured and differentiated to adipocytes in vitro as described [19]. On day 8, differentiated cells, grown in DMEM/F-12 (1:1) supplemented with 10% fetal calf serum (Perbio Science, Erembodegem, Belgium), were treated with 0.5 μmol/l rosiglitazone maleate (GlaxoSmithKline, Worthing, UK) with low (4.5 mmol/l) glucose and (fetal calf serum level) insulin (Rosi), or with high (15.75 mmol/l) glucose and 1 μmol/l insulin (RosiIG). In parallel, control cells were cultured in the same medium with low (basal) or high glucose and insulin (IG). Each condition was created in quadruplicate. On day 10, two replications were collected separately for total RNA isolation using Trizol as described [19]. Cells of the other two replications were washed and incubated with the corresponding serum-free medium, supplemented with 2.2 mg/l transferrin and 10.6 nmol/l sodium selenite for 6 h. The number of cells was counted and culture medium proteins were collected as described [20]. The duplicated protein samples were pooled for later analysis. Three independent experiments were performed.
Oil red O staining An optimised Oil Red O staining method [21] was adapted for 3T3-L1 adipocytes cultured in a six-well plate. We added an additional quick wash with 70% ethanol after fixing and washing with water. After staining and washing, the neutral lipid-bound pigment was dissolved in DMSO and absorbance at 540 nm was measured. The staining for 3T3-L1 preadipocytes was used as background to correct for unspecific binding. The obtained absorbance values were further corrected for cell numbers measured in replicated wells. Five independent experiments were performed in duplicate, but in the first two experiments Basal and Rosi conditions were not measured.
Glycerol assay The culture media of cells that had been treated for 48 h were collected per condition, frozen in liquid N2, then stored at −80°C until analysis. The concentration of glycerol in the medium was measured by a quantitative enzymatic assay kit (Sigma, St Louis, MO, USA), according to the manufacturer’s instructions. The concentrations were corrected for cell numbers measured in replicated wells in parallel.
Microarray The mouse 10K_A oligo set (MWG, Ebersberg, Germany) and additional oligonucleotides of genes encoding secretory proteins and proteins involved in energy metabolism were printed in-house and further annotated as described [19]. Five total RNA samples of three independent experiments per condition were used for hybridisation against reference RNA, also as described [19].
Microarray data analysis The data were analysed as described [19]. Briefly, spots with an average intensity, over all arrays, of lower than twofold above average background were removed from further analysis, then the intensities of the remaining 4,019 spots were normalised against reference. Fold-change calculations, Student’s t tests and correlation test (Pearson) were performed in Excel (Microsoft). Fold-change equals ratio in the case of increase and equals −1/ratio in the case of decrease. Cut-off criteria for differential expression was set at fold-change >1.3 and p < 0.05. For genes with replicated spots, the average value of individual spots was used.Data were further analysed using Ingenuity Pathways Analysis (Ingenuity Systems, http://www.ingenuity.com). The program recognised 4,005 of 4,019 spot entries, and thus 3,718 genes. Differentially expressed genes that associated with a canonical pathway in the Ingenuity Pathways Knowledge Base were considered for evaluation. The significance of the association between the data set and the canonical pathway was measured in two ways: (1) a ratio of the number of genes from the data set that map to the pathway divided by the total number of genes that map to the canonical pathway is displayed; (2) Fischer’s exact test was used to calculate a p value determining the probability that the association between the genes in the dataset and the canonical pathway is explained by chance alone. A pathway with a significance <0.05 was taken as significantly regulated.Quantitative real-time RT-PCR All six total RNA samples per treatment were used for quantitative real-time RT-PCR (Q-PCR) of 22 genes (primer information in Electronic supplementary material [ESM] Table 1). Q-PCR was performed as described [19]. Ribosomal protein S15 (Rps15) mRNA was used as reference.
One- and two-dimensional gel electrophoresis Protein samples were analysed by one-dimensional (1D) and two-dimensional (2D) gel electrophoresis, corrected for cell numbers, as described [19]. Brefeldin-A-treated adipocyte medium protein sample [20] was loaded on the same 1D gel, to verify protein secretion. Differentially expressed secreted protein bands were excised and identified by matrix-assisted laser desorption ionisation-time of flight mass spectrometry [22].
Western blotting The secretion level of adiponectin was analysed by 1D western blotting as described [20].
Results
Effect of rosiglitazone on the lipid content of mature adipocytes To assess the effect of rosiglitazone on lipid accumulation in mature adipocytes, we measured the lipid content of differentiated 3T3-L1 adipocytes. Visual inspection by microscopy showed no change in morphology and fat cell percentage in the population of 3T3-L1 adipocytes after 2 days of treatment with RosiIG or Rosi (0.5 μmol/l rosiglitazone at either high or low insulin/glucose levels, respectively), as compared with untreated adipocytes. Nevertheless, the lipid content, as detected by Oil Red O staining, was 10% lower (p < 0.001, n = 5) in RosiIG-treated cells, while no difference was observed in Rosi-treated cells (Fig. 1).
Fig. 1.
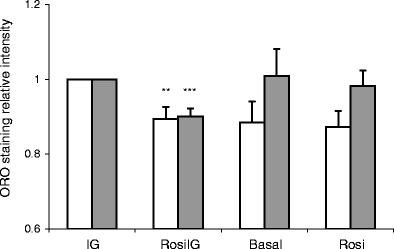
Oil Red O staining (ORO) for lipid content in 3T3-L1 adipocytes. Data are expressed as mean±SD. n = 5 for high glucose and insulin (control condition) (IG) and rosiglitazone with high insulin and glucose condition (RosiIG); n = 3 for basal and rosiglitazone with low insulin and glucose condition (Rosi). Blank bars: absorbance, relative value; filled bars: absorbance, relative value corrected for cell numbers. ** p < 0.01 compared with IG condition before cell number correction (t test), *** p < 0.001 compared with IG condition after cell number correction (t test)
Effect of rosiglitazone on gene expression To reveal the possible mechanisms for the decreased lipid content of rosiglitazone-treated 3T3-L1 adipocytes, we used DNA microarray to profile the gene expression. The complete analysis set was imported into Ingenuity Pathway Analysis for canonical pathway analysis. The significantly changed pathways were involved in metabolism, but not in signalling, such as PPAR signalling or insulin receptor signalling (Fig. 2). The expression of Pparg itself was downregulated 1.8- and 2.2-fold (p < 0.005) by Rosi and RosiIG treatment, respectively. Notably, pathways related to energy metabolism were among those that were most changed. Taking the high redundancy among these pathways in the Ingenuity database into account, we checked the individual pathways for redundancy. This showed that oxidative phosphorylation, fatty acid metabolism, glycolysis and gluconeogenesis, the pentose phosphate pathway, the citric acid (TCA) cycle, glycerolipid metabolism, glutathione metabolism, steroid (androgen, oestrogen and C21 steroids) metabolism and prostaglandin metabolism are independent pathways, while for the others it cannot be ruled out that they were identified as significant just because they contain genes overlapping with other pathways. For these independently regulated pathways, we determined the direction of change by examining the individual genes in the pathways. The regulation of gene expression of rate-limiting or otherwise representative enzymes is presented in Table 1. High insulin/glucose attenuated the effect of rosiglitazone on some genes of complex I and II of the electron transport chain. However, high insulin/glucose treatment itself did not induce a change in the expression of these genes from the basal state. In general, rosiglitazone produced dominant effects, as indicated by the Pearson product moment correlation coefficient of 0.875 for the fold changes of the complete analysis set of Rosi/Basal and RosiIG/IG. The changes in the pathways indicate that rosiglitazone enhanced both energy metabolism at the TCA cycle and oxidative phosphorylation. The generated energy may be dispensed with the help of upregulated uncoupling protein 2 (Ucp2). Enhanced energy metabolism is mainly supported by upregulation of the pathways involved in uptake and activation of fatty acids and in beta-oxidation in both mitochondria and peroxisomes. In contrast, de novo fatty acid synthesis was downregulated, as indicated by fatty acid synthase (Fasn) and stearoyl-coenzyme A desaturase 1 (Scd1). The downregulation of triacylglycerol synthesis enzymes and upregulation of adipocyte lipase (also known as patatin-like phospholipase domain containing 2) together imply a decreased lipogenesis in mature adipocytes (Table 1). Accompanying fatty acid catabolism, glycerol activation by glycerol kinase and oxidation by glycerol phosphate dehydrogenase to dihydroxyacetone phosphate were upregulated, feeding glycolysis and gluconeogenesis. The enzymes catalysing glycolysis/gluconeogenesis were all upregulated, possibly in favour of gluconeogenesis. In addition, the upregulation of glycogenin, a gene priming glycogen synthesis, implies an increase of glycogen synthesis.Most genes in the amino acid metabolism pathways that were regulated also participate in fatty acid metabolism or in glycolysis. Therefore, we did not take amino acid metabolism pathways as independent rosiglitazone-regulated pathways. However, two key enzymes that catalyse the catabolism of leucine (Table 1) were downregulated. This implies that rosiglitazone saves amino acids from being used as fuel in energy metabolism.Glutathione metabolism was significantly changed by rosiglitazone treatment. Two glutathione S-transferases that detoxify lipid peroxides, microsomal glutathione S-transferase 3 and glutathione S-transferase A4, were upregulated, while other glutathione S-transferases were downregulated by rosiglitazone. This is in line with the upregulation of fatty acid oxidation by rosiglitazone.Microsomal glutathione S-transferase 3 is involved not only in glutathione metabolism, but also in eicosanoid metabolism, which is also regulated by rosiglitazone. The expression of genes encoding enzymes involved in prostaglandin metabolism implies that the conversion from prostaglandin H2 to E2, F2 and D2 may be enhanced, while conversion to I2 may be reduced.Cholesterol biosynthesis and steroid hormone metabolism were also affected by rosiglitazone. Expression of some steroid dehydrogenases were upregulated, while hydroxysteroid 11-beta dehydrogenase 1 was downregulated (Table 1). The latter has been reported as one of the beneficial effects of TZDs, leading to a decrease in the stress hormone cortisol [23].
Fig. 2.
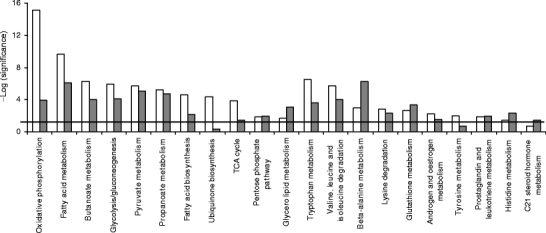
Regulated canonical pathways by rosiglitazone. Microarray data analysed by Ingenuity Pathway Analysis. Blank bars, with low insulin/glucose; filled bars, with high insulin/glucose. Bold line, threshold
Table 1.
Key enzymes of metabolism pathways regulated by rosiglitazone
| Pathway | Change | Gene symbol | Gene ID | Name | Rosi/Basal | RosiIG/IG | ||
|---|---|---|---|---|---|---|---|---|
| Fold-change | p value | Fold- change | p value | |||||
| TCA cycle | Up | Idh3a | 67834 | Isocitrate dehydrogenase 3 (NAD+) alpha | 2.53 | 0.000 | 2.55 | 0.000 |
| Cs | 12974 | Citrate synthase | 1.95 | 0.000 | 1.47 | 0.000 | ||
| Oxidative phosphorylation | Up | Ndufa5 | 68202 | NADH dehydrogenase (ubiquinone) 1 alpha subcomplex, 5 | 1.72 | 0.009 | 1.20 | 0.235 |
| Sdhd | 66925 | Succinate dehydrogenase complex, subunit D | 1.83 | 0.001 | 1.51 | 0.039 | ||
| Uqcrc1 | 22273 | Ubiquinol-cytochrome c reductase core protein I | 1.47 | 0.007 | 1.33 | 0.017 | ||
| Cox7a1 | 12865 | Cytochrome c oxidase subunit VIIa polypeptide 1 | 1.78 | 0.002 | 1.55 | 0.003 | ||
| Atp5h | 71679 | ATP synthase, H+ transporting, mitochondrial F0 complex, subunit d | 1.71 | 0.006 | 1.49 | 0.005 | ||
| Fatty acid uptake and transport | Up | Cd36 | 12491 | CD36 antigen, fatty acid translocase | 2.54 | 0.000 | 2.27 | 0.006 |
| Fabp4 | 11770 | Fatty acid bind protein 4, adipocyte | 1.64 | 0.088 | 1.57 | 0.142 | ||
| Fatty acid activation | Up | Acsl1 | 14081 | Acyl-CoA synthetase long-chain family member 1 | 2.50 | 0.000 | 1.97 | 0.000 |
| Fatty acid beta oxidation | Up | Crat | 12908 | Carnitine acetyltransferase | 1.45 | 0.006 | 1.47 | 0.007 |
| Slc25a20 | 57279 | Solute carrier family 25 (mitochondrial carnitine/acylcarnitine translocase), member 20 | 1.63 | 0.003 | 1.22 | 0.092 | ||
| Acox1 | 11430 | Acyl-coenzyme A oxidase 1, palmitoyl | 2.70 | 0.000 | 2.54 | 0.000 | ||
| Acaa1 | 113868 | Acetyl-coenzyme A acyltransferase 1 (peroxisomal) | 1.67 | 0.002 | 1.29 | 0.017 | ||
| Acaa2 | 52538 | Acetyl-coenzyme A acyltransferase 2 (mitochondrial) | 2.70 | 0.000 | 1.94 | 0.000 | ||
| Fatty acid synthesis | Down | Fasn | 14104 | Fatty acid synthase | −1.52 | 0.000 | −1.55 | 0.001 |
| Scd1 | 20249 | Stearoyl-CoA desaturase 1 | −3.65 | 0,000 | −4.31 | 0.000 | ||
| Triacylglycerol synthesis | Down | Ppap2b | 67916 | Phosphatidic acid phosphatase type 2B | −1.38 | 0.001 | −1.48 | 0.000 |
| Dgat2 | 67800 | Diacylglycerol O-acyltransferase 2 | −1.31 | 0.003 | −1.37 | 0.006 | ||
| Lipid droplet formation | Up/down | Adfp | 11520 | Adipose differentiation related protein | 5.97 | 0.000 | 6.60 | 0.000 |
| Cav1 | 12389 | Caveolin, caveolae protein 1 | −2.20 | 0.000 | −2.30 | 0.001 | ||
| Glycerolipid lysis | Up | Pnpla2 | 66853 | Patatin-like phospholipase domain containing 2 | 1.52 | 0.006 | 1.67 | 0.007 |
| Glycerol metabolism | Up | Gk | 14933 | Glycerol kinase | 1.86 | 0.007 | 1.88 | 0.003 |
| Gpd1 | 14555 | Glycerol-3-phosphate dehydrogenase 1 (soluble) | 2.07 | 0.009 | 1.68 | 0.032 | ||
| Energy expenditure | Up | Ucp2 | 22228 | Uncoupling protein 2 (mitochondrial, proton carrier) | 1.78 | 0.001 | 1.50 | 0.003 |
| Glutathione metabolism | Up/down | Mgst3 | 66447 | Microsomal glutathione S-transferase 3 | 2.11 | 0.001 | 1.88 | 0.001 |
| Gsta4 | 14860 | Glutathione S-transferase A4 | 1.36 | 0.046 | −1.01 | 0.924 | ||
| Gstm1 | 14862 | Glutathione S-transferase M1 | −1.88 | 0.000 | −2.01 | 0.010 | ||
| Gstt1 | 14871 | Glutathione S-transferase theta 1 | −1.38 | 0.060 | −1.51 | 0.044 | ||
| Gstz1 | 14874 | Glutathione transferase zeta 1 | −1.44 | 0.001 | −1.57 | 0.015 | ||
| Prostaglandin metabolism | Up/down | Cbr3 | 109857 | Carbonyl reductase 3 | 3.04 | 0.000 | 3.96 | 0.000 |
| Ptges2 | 96979 | Prostaglandin E synthase 2 | 1.45 | 0.012 | 1.61 | 0.000 | ||
| Ptgis | 19223 | Prostaglandin I2 (prostacyclin) synthase | −1.71 | 0.002 | −1.41 | 0.004 | ||
| Steroids metabolism | Up/down | Hsd17b7 | 15490 | Hydroxysteroid 17-beta dehydrogenase 7 | 1.63 | 0.003 | 1.73 | 0.002 |
| Nsdhl | 18194 | NAD(P) dependent steroid dehydrogenase-like | 1.51 | 0.039 | 1.37 | 0.017 | ||
| Hsd11b1 | 15483 | Hydroxysteroid 11-beta dehydrogenase 1 | −2.73 | 0.001 | −2.05 | 0.004 | ||
| Glyconeogenesis | Up | Fbp2 | 14120 | Fructose-1,6-bisphosphatase 2 | 2.92 | 0.003 | 2.82 | 0.014 |
| Glycogen synthesis | Up | Gyg | 27357 | Glycogenin | 1.52 | 0.001 | 1.34 | 0.008 |
| Pyruvate metabolism | Up | Pdha1 | 18597 | Pyruvate dehydrogenase E1 alpha 1 | 1.38 | 0.001 | 1.33 | 0.001 |
| Pdhb | 68263 | Pyruvate dehydrogenase (lipoamide) beta | 1.59 | 0.005 | 1.61 | 0.004 | ||
| Pentose phosphate | Up | H6pd | 100198 | Hexose-6-phosphate dehydrogenase (glucose 1-dehydrogenase) | 1.60 | 0.000 | 1.47 | 0.001 |
| Taldo1 | 21531 | Transaldolase 1 | 1.57 | 0.001 | 1.33 | 0.036 | ||
| Leu catabolism | Down | Ivd | 56357 | Isovaleryl coenzyme A dehydrogenase | −1.42 | 0.004 | −1.72 | 0.000 |
| Mccc1 | 72039 | Methylcrotonoyl-coenzyme A carboxylase 1 (alpha) | −1.26 | 0.026 | −1.35 | 0.031 | ||
Mean value of microarray data (n = 5)
Rosi/basal: the effect with low insulin/glucose; RosiIG/IG: the effect with high insulin/glucose
Effect of rosiglitazone on the expression of genes encoding adipocyte-secreted proteins To assess whether protein secretion by mature adipocytes is altered by rosiglitazone, we checked genes encoding adipocyte-secreted proteins. The list was based on literature [24–27] and our previous work [20]. In total, 61 genes were present on the array. Il1b, Il6, Il10 and leptin showed very low signals (less than twofold of background) and were excluded from the analysis. Among the remaining 57 genes, only apolipoprotein E (Apoe) was upregulated by Rosi treatment, and more than 40% of the genes were significantly downregulated with both Rosi and RosiIG treatment (Table 2). Interestingly, the general downregulation of adipokines was also observed for other genes encoding secreted proteins. We used Gene Ontology to cluster the expressed genes on the microarray into secreted protein encoding genes and intracellular/unknown location protein-encoding genes (additional gene expression information is available at www.foodbioactives.nl). In the first cluster, more genes were significantly downregulated (Fig. 3a and c). Of 477 genes, 24.9 and 25.8% were significantly downregulated, while 9.6 and 6.7% were upregulated by Rosi and RosiIG, respectively. Of the upregulated genes, most encode multi-location proteins, which can also reside in the nucleus, mitochondria and/or membranes. If these genes are omitted from the analysis, only seven genes were upregulated (1.5%). In the cellular protein cluster, by contrast, the majority of the regulated genes were upregulated (Fig. 3b and d). Of 3,382 genes, 10.3 and 10.1% were significantly upregulated, while 5.1 and 5.0% were downregulated by Rosi and RosiIG treatment, respectively. To complement array data, we used 2D and 1D gel electrophoresis and western blotting to examine the effect of rosiglitazone on secretion. With regard to complement C3, a 30% reduction of secretion by Rosi or RosiIG treatment was observed on the 1D gel (Fig. 4). This is less than the change observed at the gene expression level. Nine spots on the 2D gel were identified as adipsin. We assessed the changes for individual spots, as well as for all spots in total. In both cases, the decrease effected by rosiglitazone at the gene expression level was similar to the decrease found at the secreted protein level with RosiIG treatment. However, this decrease at the protein level was less prominent with Rosi treatment (Fig. 5). The secretion of adiponectin was also analysed by western blotting. A slight increase with rosiglitazone was detected (Fig. 6), although there was no change at the gene expression level.
Table 2.
Effect of rosiglitazone on the expression of genes encoding adipocyte-secreted proteins
| Function | Gene symbol | Gene ID | Name | Rosi/Basal | RosiIG/IG | ||
|---|---|---|---|---|---|---|---|
| Fold-change | p value | Fold-change | p value | ||||
| Lipid metabolism | Adn | 11537 | Complement factor D (adipsin) | −3.55 | 0.000 | −4.23 | 0.000 |
| C3 | 12266 | Complement component 3 | −2.25 | 0.000 | −2.68 | 0.001 | |
| Lpl | 16956 | Lipoprotein lipase | 1.12 | 0.166 | −1.02 | 0.627 | |
| Apoe | 11816 | Apolipoprotein E | 1.34 | 0.026 | 1.18 | 0.145 | |
| Insulin sensitivity | Retn | 57264 | Resistin | −3.07 | 0.000 | −3.17 | 0.001 |
| Igf1 | 16000 | Insulin-like growth factor 1 | −1.55 | 0.012 | −1.58 | 0.001 | |
| Pbef1 | 59027 | Pre-B-cell colony-enhancing factor 1 | −1.24 | 0.050 | −1.28 | 0.085 | |
| Adipoq | 11450 | Adiponectin | −1.09 | 0.462 | −1.25 | 0.108 | |
| Inflammation | Hp | 15439 | Haptoglobin | −2.93 | 0.000 | −4.42 | 0.000 |
| Ptx3 | 19288 | Pentaxin-related gene | −1.68 | 0.001 | −1.58 | 0.000 | |
| Tgfb3 | 21809 | Transforming growth factor, beta 3 | −1.58 | 0.008 | −1.44 | 0.056 | |
| B2m | 12010 | Beta-2 microglobulin | −1.54 | 0.018 | −1.64 | 0.006 | |
| Ccl2 | 20296 | Chemokine (C-C motif) ligand 2 (previously known as monocyte chemoattractant protein-1) | −1.54 | 0.012 | −1.48 | 0.023 | |
| Saa3 | 20210 | Serum amyloid A 3 | −1.49 | 0.047 | −1.38 | 0.001 | |
| Cxcl12 | 20315 | Chemokine (C-X-C motif) ligand 12 | −1.45 | 0.006 | −1.42 | 0.046 | |
| Il6ra | 16194 | Interleukin 6 receptor, alpha | −1.16 | 0.128 | −1.15 | 0.037 | |
| Tgfb1 | 21803 | Transforming growth factor, beta 1 | −1.15 | 0.163 | 1.02 | 0.914 | |
| Tgfb2 | 21808 | Transforming growth factor, beta 2 | −1.15 | 0.306 | −1.07 | 0.584 | |
| Il18 | 16173 | Interleukin 18 | −1.15 | 0.224 | −1.01 | 0.937 | |
| D17Wsu104e | 28106 | DNA segment, Chr 17, Wayne State University 104, expressed (previously known as IL25) | −1.03 | 0.794 | −1.16 | 0.088 | |
| Lgals1 | 16852 | Lectin, galactose binding, soluble 1 | 1.05 | 0.774 | 1.08 | 0.590 | |
| Lcn2 | 16819 | Lipocalin 2 | 1.11 | 0.228 | 1.20 | 0.179 | |
| Mif | 17319 | Macrophage migration inhibitory factor | 1.18 | 0.076 | 1.17 | 0.137 | |
| Vascular function | Adm | 11535 | Adrenomedullin | −1.41 | 0.003 | −1.50 | 0.000 |
| Agt | 11606 | Angiotensinogen | −1.22 | 0.161 | −1.15 | 0.150 | |
| Serpinf1 | 20317 | Serine (or cysteine) peptidase inhibitor, clade F, member 1 (previously known as pigment epithelium derived factor) | −1.15 | 0.237 | −1.25 | 0.187 | |
| Vegfa | 22339 | Vascular endothelial growth factor A | −1.03 | 0.724 | −1.08 | 0.644 | |
| Apln | 30878 | Apelin | 1.01 | 0.969 | 1.02 | 0.790 | |
| Serpine1 | 18787 | Serine (or cysteine) peptidase inhibitor, clade E, member 1 (previously known as plasminogen activator inhibitor-1) | −1.01 | 0.897 | 1.27 | 0.013 | |
| Antioxidant | Sod3 | 20657 | Superoxide dismutase 3, extracellular | −1.09 | 0.500 | −1.39 | 0.036 |
| Mt1 | 17748 | Metallothionein 1 | −1.11 | 0.577 | −1.12 | 0.417 | |
| Extracellular matrix component | Nid2 | 18074 | Nidogen 2 | −1.64 | 0.002 | −1.96 | 0.003 |
| Sparc | 20692 | Secreted acidic cysteine rich glycoprotein | −1.63 | 0.000 | −1.56 | 0.000 | |
| Col5a2 | 12832 | Procollagen, type V, alpha 2 | −1.62 | 0.000 | −1.62 | 0.003 | |
| Col5a1 | 12831 | Procollagen, type V, alpha 1 | −1.59 | 0.003 | −1.48 | 0.013 | |
| Col1a2 | 12843 | Procollagen, type I, alpha 2 | −1.64 | 0.020 | −1.40 | 0.002 | |
| Col1a1 | 12842 | Procollagen, type I, alpha 1 | −1.60 | 0.065 | −1.38 | 0.020 | |
| Col3a1 | 12825 | Procollagen, type III, alpha 1 | −1.52 | 0.024 | −1.59 | 0.002 | |
| Col4a5 | 12830 | Procollagen, type IV, alpha 5 | −1.44 | 0.034 | −1.37 | 0.019 | |
| Col6a2 | 12834 | Procollagen, type VI, alpha 2 | −1.32 | 0.011 | −1.19 | 0.108 | |
| Col6a1 | 12833 | Procollagen, type VI, alpha 1 | −1.31 | 0.117 | 1.05 | 0.740 | |
| Col5a3 | 53867 | Procollagen, type V, alpha 3 | −1.20 | 0.046 | −1.29 | 0.076 | |
| Col4a1 | 12826 | Procollagen, type IV, alpha 1 | −1.16 | 0.114 | −1.16 | 0.069 | |
| Col4a2 | 12827 | Procollagen, type IV, alpha 2 | −1.16 | 0.153 | −1.29 | 0.003 | |
| Nid1 | 18073 | Nidogen 1 | −1.04 | 0.723 | 1.04 | 0.767 | |
| Col6a3 | 12835 | Procollagen, type VI, alpha 3 | −1.03 | 0.690 | −1.01 | 0.960 | |
| Extracellular matrix processing | Mmp3 | 17392 | Matrix metalloproteinase 3 | −2.01 | 0.003 | −2.02 | 0.013 |
| Lox | 16948 | Lysyl oxidase | −1.87 | 0.005 | −2.17 | 0.002 | |
| Timp2 | 21858 | Tissue inhibitor of metalloproteinase 2 | −1.81 | 0.002 | −1.92 | 0.000 | |
| Mmp2 | 17390 | Matrix metalloproteinase 2 | −1.44 | 0.054 | −1.30 | 0.100 | |
| Timp1 | 21857 | Tissue inhibitor of metalloproteinase 1 | −1.32 | 0.095 | −1.30 | 0.055 | |
| Pcolce | 18542 | Procollagen C-endopeptidase enhancer protein | −1.31 | 0.029 | −1.48 | 0.002 | |
| Mmp19 | 58223 | Matrix metalloproteinase 19 | −1.01 | 0.848 | −1.08 | 0.347 | |
| Mmp11 | 17385 | Matrix metalloproteinase 11 | 1.05 | 0.860 | −1.12 | 0.413 | |
| Timp4 | 110595 | Tissue inhibitor of metalloproteinase 4 | 1.06 | 0.672 | 1.25 | 0.055 | |
| Miscellaneous | Gal | 14419 | Galanin | −3.04 | 0.000 | −2.89 | 0.000 |
| Gsn | 227753 | Gelsolin | −1.63 | 0.000 | −1.52 | 0.000 | |
| Ppic | 19038 | Peptidylprolyl isomerase C | −1.27 | 0.049 | −1.38 | 0.001 | |
Mean value of microarray data (n = 5)
Rosi/basal: the effect with low insulin/glucose; RosiIG/IG: the effect with high insulin/glucose
Fig. 3.
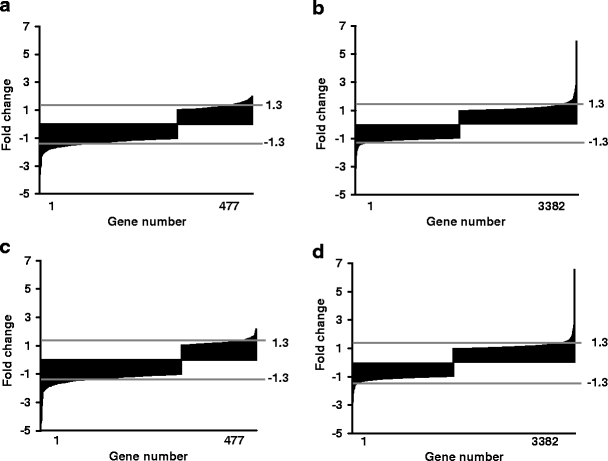
Regulation pattern by rosiglitazone of genes encoding extracellular proteins and of genes encoding intracellular proteins or proteins of unknown location. a, c: extracellular pattern; b, d: intracellular pattern. a, b: rosiglitazone with low insulin/glucose; c, d: rosiglitazone with high insulin/glucose
Fig. 4.
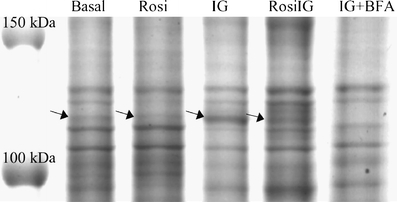
The effect of rosiglitazone on the secretion of complement C3 as measured by 1D gel analysis. The marked bands (arrows) were identified as C3. One representative image is shown. A sample treated by Brefeldin A (+BFA) was used to verify secretion
Fig. 5.
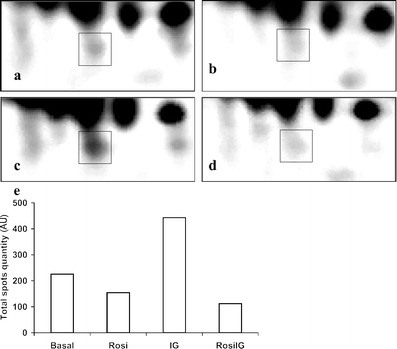
The effect of rosiglitazone on the secretion of adipsin as measured by 2D gel analysis. A section of one representative 2D gel image is shown for an individual adipsin spot (squares) from a low glucose and insulin control condition (Basal), b rosiglitazone with low insulin and glucose condition (Rosi), c high glucose and insulin control condition (IG) and d rosiglitazone with high insulin and glucose condition (RosiIG). e Total quantity of adipsin in the culture medium of 3T3-L1 adipocytes expressed in arbitrary units (AU)
Fig. 6.
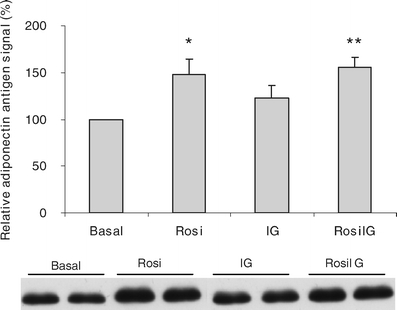
The effect of rosiglitazone on the secretion of adiponectin as measured by western blotting. Data are expressed as mean ± SD (n = 3) and one representative western blot image is shown. *p < 0.05 compared with Basal condition (t test); **p < 0.01 compared with IG condition (t test). Basal, low glucose and insulin control condition; Rosi, rosiglitazone with low insulin and glucose condition; IG, high glucose and insulin control condition; RosiIG, rosiglitazone with high insulin and glucose condition
General confirmation of the microarray data by quantitative real-time RT-PCR analysis To confirm our microarray data, we checked the expression of 22 genes that encode secreted proteins or are related to lipid metabolism, by Q-PCR, using Rps15 as reference. Rps15 was chosen because of its constant expression behaviour on the arrays. A gene was selected as target gene because either itself or its family member showed changed expression based on microarray data. The comparison showed a strong correlation between array data and Q-PCR data (ESM Fig. 1), with Pearson correlation coefficients of 0.987 and 0.986 for Rosi/basal and RosiIG/IG, respectively.
The effect of rosiglitazone on lipolysis We assessed the glycerol level in the culture medium as a measure of the lipolysis of adipocytes. RosiIG treatment significantly increased the release of glycerol from 3T3-L1 mature adipocytes, whereas glycerol release was significantly decreased by Rosi treatment (Fig. 7).
Fig. 7.
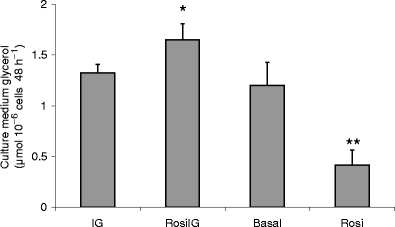
The effect of rosiglitazone on the culture medium glycerol levels. Data are expressed as mean±SD (n = 3). *p < 0.05 compared with IG condition (t test); **p < 0.01 compared with Basal condition (t test). Basal, low glucose and insulin control condition; Rosi, rosiglitazone with low insulin and glucose condition; IG, high glucose and insulin control condition; RosiIG, rosiglitazone with high insulin and glucose condition
Discussion
As a PPARG agonist, rosiglitazone stimulates adipogenesis, which is accompanied by an increasing lipid content of the differentiating cells. However, our results showed that rosiglitazone does not induce an increase of the lipid content, but decreases it in mature adipocytes at high insulin/glucose level. The pathway analysis based on transcriptome data points out that an altered energy metabolism may underlie this phenomenon.
Although the level of insulin/glucose has some influence, the effect of rosiglitazone on the transcriptome was clearly dominant. The most significantly regulated pathways by rosiglitazone in 3T3-L1 adipocytes were fatty acid oxidation, the TCA cycle and oxidative phosphorylation. Besides an upregulation of fatty acid catabolism pathways, our data indicate that rosiglitazone encourages adipocytes to utilise fatty acids for energy production and spares glucose and amino acids by enhancing glycogen synthesis and inhibiting amino acid catabolism pathways. This is in line with the upregulation of Ucp2 and the downregulation of Scd1 expression. The increase in the level of UCP2 is correlated with a shift in substrate utilisation in favour of lipids as the dominant metabolic fuel [28]. SCD1 is involved in fatty acid synthesis, but it has also been shown that SCD1 deficiency activates metabolic pathways that promote beta-oxidation and decrease lipogenesis [29].
Our conclusions regarding energy metabolism are consistent with recent studies. Mitochondrial changes have been shown in response to TZD treatment in 3T3-L1 adipocytes [30], human adipocytes in vitro [31] and mouse adipocytes in vivo [12]. These studies show that TZDs, including rosiglitazone, upregulate fatty acid oxidation by increasing mitochondrial protein and gene expression, but not in a trans-differentiation manner [12, 30]. This has been confirmed by direct measurement of labelled palmitic acid oxidation [12] or indirect calorimetric calculation [32]. We also found that among the genes involved in protein biosynthesis, more than 80% of those upregulated by rosiglitazone were genes encoding mitochondrial ribosomal proteins. This is consistent with an increase of mitochondrial biogenesis and remodelling [12]. We speculate that the maintenance of increased mitochondrial mass and function utilises (part of) the energy that the cell no longer needs for lipid synthesis under rosiglitazone treatment.
A decrease in lipogenesis pathways accompanies the increased fatty acid catabolism pathways caused by rosiglitazone in mature adipocytes, as shown by decreased expression of genes encoding triacylglycerol synthesis enzymes and the genes encoding lipase. The downregulation of Fasn by TZD has also been observed in brown adipocytes [33]. Caveolin-1 (CAV1) is an important protein for efficient lipid droplet formation [34]. The downregulation of its gene expression supports a decrease of lipid accumulation. The upregulation of adipocyte differentiation related protein gene (Adfp), which encodes a lipid droplet-associated protein, seems to conflict with the decreased lipogenesis observed by us (Table 1). However, in mature 3T3-L1 adipocytes, ADFP is spatially associated with lipid droplets subjected to lipolysis and is suggested to play a role in lipolysis [35]. Furthermore, the protein level of ADFP in mature adipocytes is not determined by the mRNA expression, but by the amount of micro-lipid droplets [35]. Therefore the increase in Adfp expression might also be interpreted as being in agreement with upregulated lipolysis.
The pentose phosphate pathway provides NADPH to be used in reductive biosynthesis, including fatty acid biosynthesis [36]. Rosiglitazone enhances the pentose phosphate pathway, but inhibits fatty acid biosynthesis, while stimulating other NADPH-dependent pathways, such as glutathione detoxification, cholesterol and steroid biosynthesis, and prostaglandin metabolism (carbonyl reductase 3). The excess of NADPH may be a driving force behind the upregulation of these pathways by rosiglitazone.
The present study indicates that in mature 3T3-L1 adipocytes rosiglitazone enhances fatty acid catabolism, increases lipolysis and reduces lipogenesis pathways. This may lead to a net decrease of lipid content of the cells. Indeed, we observed increased lipolysis expressed in terms of an increased glycerol level in the medium and a decreased lipid content of the cells under RosiIG treatment. This is in line with the increased lipolysis effected by rosiglitazone in a recent study on rat white adipose tissue [37]. We did not observe increased lipolysis under Rosi treatment, where in fact the glycerol level was decreased rather than increased. The difference implies that the insulin/glucose level alters the effect of rosiglitazone. It is likely that at low insulin/glucose level, the ‘starved’ adipocytes use glycerol as an energy source, rather than releasing it into the medium. However, it should be noted that low insulin/glucose is not a realistic situation in vivo when rosiglitazone is administered. The decreased lipid content is consistent with the physiological effects of TZDs in both animal models [10, 38] and in humans [9], where TZDs increase the number of small adipocytes. In adipose tissue treated with TZDs, mature adipocytes can become smaller by actively burning fat, in parallel to the emerging of small immature adipocytes due to preadipocyte differentiation. With rosiglitazone, mature adipocytes take fatty acids for burning rather than for storage. This still fits the ‘fatty acid steal’ hypothesis [1] and can explain part of the glucose-lowering effects of rosiglitazone.
Rosiglitazone affects the function of mature adipocytes not only with regard to fat metabolism, but also with regard to adipokine secretion. Despite the limitations of the present study, namely that a mid-size array was used and that the expression changes of several genes could not be detected due to sensitivity, our data at both the mRNA level and the protein level confirmed that rosiglitazone represses adipokine expression, except adiponectin and Apoe. Since the majority of adipokines are negatively correlated with insulin sensitivity [39], the general repression may correct the disturbance of insulin sensitivity caused by obesity. Furthermore, our transcriptome analysis suggests that rosiglitazone induces a general decrease in expression of genes encoding secreted proteins. This implies a general mechanism, in which energy redistribution might be involved.
We observed that repression at the secretion level was less significant than at the gene expression level. One explanation is that the effect on protein lags behind the effect on mRNA. Another reason might be the influence of insulin. We have recently studied the role of insulin in 3T3-L1 adipocyte secretion [19]. We observed that at a low insulin level, the secretion of proteins is already suppressed. Consequently, the inhibitory effect of rosiglitazone on secretion is less prominent in the low insulin condition.
In contrast to most adipokines, adiponectin is reversely correlated with obesity, and its circulating level is upregulated by TZDs [40]. A functional PPAR-responsive element (PPRE) in the adiponectin promoter could be the reason for the stimulation [41]. We observed an upregulation only at the secretion level, but not at gene expression level. This is in line with the conclusion from another study, that although plasma levels of adiponectin were upregulated by TZDs, there was no significant effect on adiponectin gene expression [16].
Rosiglitazone is a potent PPARG agonist. It seems logical to assume that all these effects are mediated through regulation of PPARG. Indeed, we observed that rosiglitazone induced a significant decrease of Pparg expression in mature 3T3-L1 adipocytes. This is in contrast to an overwhelming increase during adipogenesis, but it is in line with several reports [42–44]. With respect to PPARG downstream effects, we found here that two PPRE-bearing genes, Cav1 and Scd1, were downregulated, and two other genes, adiponectin and lipoprotein lipase, remained unchanged, while most PPRE-bearing genes [45], such as CD36 antigen, fatty acid binding protein 4, adipocyte and acyl-coenzyme A oxidase 1, palmitoyl, were upregulated by rosiglitazone (Tables 1 and 2). The effect of TZDs on Scd1 in mature adipocytes is opposite to that in preadipocytes [46], and the effect on Cav1 is in contrast to the reports in other cell types [47, 48]. It has been known that PPARG acts with different transcriptional partners, co-repressors and/or co-activators as a complex, to activate or repress the expression of target genes [49, 50]. Possibly, the PPARG complex is modulated by rosiglitazone in mature adipocytes in a manner that is different from that occurring in preadipocytes and other cell types.
In conclusion, we have shown that rosiglitazone, in contrast to the stimulation of adipogenesis in preadipocytes, reduces adiposity of mature adipocytes by increasing fatty acid catabolism pathways. In addition, rosiglitazone represses the expression and secretion of adipokines of mature adipocytes. Our findings suggest that the change of adiposity as seen in vivo [13] may reflect a shift in balance between the effects of TZDs on preadipocytes and those on mature adipocytes, while the changes in circulating adipokine levels primarily result from an effect on mature adipocytes. These aspects all contribute to the therapeutic effects of TZDs.
Electronic Supplementary Material
Below is the link to the electronic supplementary material
Q-PCR primer sequences (DOC 26 kb)
Comparison between microarray and quantitative real time RT-PCR analysis. The mean of the fold-change is shown. n = 5 for array n = 6 for RT-PCR. The lines at 1.3 and −1.3 fold changes indicate thresholds of differentially expression (DOC 51 kb)
Acknowledgements
We thank our colleagues in the Functional Genomics Group and the Food Bioactives Group, especially V. de Boer, for technical support and helpful discussions. We also thank GlaxoSmithKline for the gift of rosiglitazone. This study was financed by the Centre for Human Nutrigenomics in The Netherlands.
Duality of interest The authors have declared that there is no conflict of interest with regard to the contents of this paper.
Abbreviations
- ADFP
adipocyte differentiation-related protein
- APOE
apolipoprotein E
- CAV1
caveolin 1
- 1D
one-dimensional
- 2D
two-dimensional
- FASN
fatty acid synthase
- IG
high glucose and insulin condition
- PPAR
peroxisome proliferator-activated receptor
- PPARG
peroxisome proliferator-activated receptor-γ
- PPRE
PPAR-responsive element
- Q-PCR
quantitative real time RT- PCR
- Rosi
rosiglitazone with low (4.5 mmol/l) glucose and (fetal calf serum level) insulin
- RosiIG
rosiglitazone with high (15.75 mmol/l) glucose and 1 μmol/l insulin
- RPS15
ribosomal protein S15
- SCD1
stearoyl-coenzyme A desaturase 1
- TCA cycle
citric acid cycle
- TZD
thiazolidinedione
- UCP2
uncoupling protein 2
Footnotes
Electronic supplementary material
Supplementary material is available in the online version of this article at http://dx.doi.org/10.1007/s00125-006-0565-0 and is accessible to authorised users only
References
- 1.Yki-Jarvinen H (2004) Thiazolidinediones. N Engl J Med 351:1106–1118 [DOI] [PubMed]
- 2.Olefsky JM (2000) Treatment of insulin resistance with peroxisome proliferator-activated receptor gamma agonists. J Clin Invest 106:467–472 [DOI] [PMC free article] [PubMed]
- 3.Larsen TM, Toubro S, Astrup A (2003) PPARgamma agonists in the treatment of type II diabetes: is increased fatness commensurate with long-term efficacy? Int J Obes Relat Metab Disord 27:147–161 [DOI] [PubMed]
- 4.Kintscher U, Law RE (2005) PPARgamma-mediated insulin sensitization: the importance of fat versus muscle. Am J Physiol Endocrinol Metab 288:E287–E291 [DOI] [PubMed]
- 5.Rosen ED, Hsu CH, Wang X et al (2002) C/EBPalpha induces adipogenesis through PPARgamma: a unified pathway. Genes Dev 16:22–26 [DOI] [PMC free article] [PubMed]
- 6.Gregoire FM, Smas CM, Sul HS (1998) Understanding adipocyte differentiation. Physiol Rev 78:783–809 [DOI] [PubMed]
- 7.Hutley LJ, Newell FM, Joyner JM et al (2003) Effects of rosiglitazone and linoleic acid on human preadipocyte differentiation. Eur J Clin Investig 33:574–581 [DOI] [PubMed]
- 8.Shao D, Lazar MA (1997) Peroxisome proliferator activated receptor gamma, CCAAT/enhancer-binding protein alpha, and cell cycle status regulate the commitment to adipocyte differentiation. J Biol Chem 272:21473–21478 [DOI] [PubMed]
- 9.Boden G, Cheung P, Mozzoli M, Fried SK (2003) Effect of thiazolidinediones on glucose and fatty acid metabolism in patients with type 2 diabetes. Metabolism 52:753–759 [DOI] [PubMed]
- 10.de Souza CJ, Eckhardt M, Gagen K et al (2001) Effects of pioglitazone on adipose tissue remodeling within the setting of obesity and insulin resistance. Diabetes 50:1863–1871 [DOI] [PubMed]
- 11.Fonseca V (2003) Effect of thiazolidinediones on body weight in patients with diabetes mellitus. Am J Med 115 (Suppl 8A):42S–48S [DOI] [PubMed]
- 12.Wilson-Fritch L, Nicoloro S, Chouinard M et al (2004) Mitochondrial remodeling in adipose tissue associated with obesity and treatment with rosiglitazone. J Clin Invest 114:1281–1289 [DOI] [PMC free article] [PubMed]
- 13.Miyazaki Y, Mahankali A, Matsuda M et al (2002) Effect of pioglitazone on abdominal fat distribution and insulin sensitivity in type 2 diabetic patients. J Clin Endocrinol Metab 87:2784–2791 [DOI] [PubMed]
- 14.Fasshauer M, Paschke R (2003) Regulation of adipocytokines and insulin resistance. Diabetologia 46:1594–1603 [DOI] [PubMed]
- 15.Tonelli J, Li W, Kishore P et al (2004) Mechanisms of early insulin-sensitizing effects of thiazolidinediones in type 2 diabetes. Diabetes 53:1621–1629 [DOI] [PubMed]
- 16.Rasouli N, Yao-Borengasser A, Miles LM, Elbein SC, Kern PA (2006) Increased plasma adiponectin in response to pioglitazone does not result from increased gene expression. Am J Physiol Endocrinol Metab 290:E42–E46 [DOI] [PubMed]
- 17.Mattoo V, Eckland D, Widel M et al (2005) Metabolic effects of pioglitazone in combination with insulin in patients with type 2 diabetes mellitus whose disease is not adequately controlled with insulin therapy: results of a six-month, randomized, double-blind, prospective, multicenter, parallel-group study. Clin Ther 27:554–567 [DOI] [PubMed]
- 18.Mohanty P, Aljada A, Ghanim H et al (2004) Evidence for a potent antiinflammatory effect of rosiglitazone. J Clin Endocrinol Metab 89:2728–2735 [DOI] [PubMed]
- 19.Wang P, Keijer J, Bunschoten A, Bouwman F, Renes J, Mariman E (2006) Insulin modulates the secretion of proteins from mature 3T3-L1 adipocytes: a role for transcriptional regulation of processing. Diabetologia 49:2453–2462 [DOI] [PubMed]
- 20.Wang P, Mariman E, Keijer J et al (2004) Profiling of the secreted proteins during 3T3-L1 adipocyte differentiation leads to the identification of novel adipokines. Cell Mol Life Sci 61:2405–2417 [DOI] [PMC free article] [PubMed]
- 21.Koopman R, Schaart G, Hesselink MK (2001) Optimisation of oil red O staining permits combination with immunofluorescence and automated quantification of lipids. Histochem Cell Biol 116:63–68 [DOI] [PubMed]
- 22.Bouwman F, Renes J, Mariman E (2004) A combination of protein profiling and isotopomer analysis using matrix-assisted laser desorption/ionization-time of flight mass spectrometry reveals an active metabolism of the extracellular matrix of 3T3-L1 adipocytes. Proteomics 4:3855–3863 [DOI] [PubMed]
- 23.Berger J, Tanen M, Elbrecht A et al (2001) Peroxisome proliferator-activated receptor-gamma ligands inhibit adipocyte 11beta -hydroxysteroid dehydrogenase type 1 expression and activity. J Biol Chem 276:12629–12635 [DOI] [PubMed]
- 24.Rajala MW, Scherer PE (2003) Minireview: the adipocyte—at the crossroads of energy homeostasis, inflammation, and atherosclerosis. Endocrinology 144:3765–3773 [DOI] [PubMed]
- 25.Krug AW, Ehrhart-Bornstein M (2005) Newly discovered endocrine functions of white adipose tissue: possible relevance in obesity-related diseases. Cell Mol Life Sci 62:1359–1362 [DOI] [PMC free article] [PubMed]
- 26.Maquoi E, Munaut C, Colige A, Collen D, Lijnen HR (2002) Modulation of adipose tissue expression of murine matrix metalloproteinases and their tissue inhibitors with obesity. Diabetes 51:1093–1101 [DOI] [PubMed]
- 27.Trayhurn P, Wood IS (2004) Adipokines: inflammation and the pleiotropic role of white adipose tissue. Br J Nutr 92:347– 355 [DOI] [PubMed]
- 28.Dulloo AG, Seydoux J, Jacquet J (2004) Adaptive thermogenesis and uncoupling proteins: a reappraisal of their roles in fat metabolism and energy balance. Physiol Behav 83:587–602 [DOI] [PubMed]
- 29.Ntambi JM, Miyazaki M, Stoehr JP et al (2002) Loss of stearoyl-CoA desaturase-1 function protects mice against adiposity. Proc Natl Acad Sci USA 99:11482–11486 [DOI] [PMC free article] [PubMed]
- 30.Wilson-Fritch L, Burkart A, Bell G et al (2003) Mitochondrial biogenesis and remodeling during adipogenesis and in response to the insulin sensitizer rosiglitazone. Mol Cell Biol 23:1085–1094 [DOI] [PMC free article] [PubMed]
- 31.Bogacka I, Ukropcova B, McNeil M, Gimble JM, Smith SR (2005) Structural and functional consequences of mitochondrial biogenesis in human adipocytes in vitro. J Clin Endocrinol Metab 90:6650–6656 [DOI] [PubMed]
- 32.Boden G, Homko C, Mozzoli M, Showe LC, Nichols C, Cheung P (2005) Thiazolidinediones upregulate fatty acid uptake and oxidation in adipose tissue of diabetic patients. Diabetes 54:880–885 [DOI] [PubMed]
- 33.Teruel T, Hernandez R, Rial E, Martin-Hidalgo A, Lorenzo M (2005) Rosiglitazone up-regulates lipoprotein lipase, hormone-sensitive lipase and uncoupling protein-1, and down-regulates insulin-induced fatty acid synthase gene expression in brown adipocytes of Wistar rats. Diabetologia 48:1180–1188 [DOI] [PubMed]
- 34.Cohen AW, Razani B, Schubert W et al (2004) Role of caveolin-1 in the modulation of lipolysis and lipid droplet formation. Diabetes 53:1261–1270 [DOI] [PubMed]
- 35.Brasaemle DL, Dolios G, Shapiro L, Wang R (2004) Proteomic analysis of proteins associated with lipid droplets of basal and lipolytically stimulated 3T3-L1 adipocytes. J Biol Chem 279:46835–46842 [DOI] [PubMed]
- 36.Berg J, Tymoczko J, Stryer L, Clarke ND (2002) Biochemistry. Freeman, New York
- 37.Festuccia WT, Laplante M, Berthiaume M, Gelinas Y, Deshaies Y (2006) PPARgamma agonism increases rat adipose tissue lipolysis, expression of glyceride lipases, and the response of lipolysis to hormonal control. Diabetologia 49:2427–2436 [DOI] [PubMed]
- 38.Okuno A, Tamemoto H, Tobe K et al (1998) Troglitazone increases the number of small adipocytes without the change of white adipose tissue mass in obese Zucker rats. J Clin Invest 101:1354–1361 [DOI] [PMC free article] [PubMed]
- 39.Lazar MA (2005) How obesity causes diabetes: not a tall tale. Science 307:373–375 [DOI] [PubMed]
- 40.Hammarstedt A, Andersson CX, Rotter Sopasakis V, Smith U (2005) The effect of PPARgamma ligands on the adipose tissue in insulin resistance. Prostaglandins Leukot Essent Fat Acids 73:65–75 [DOI] [PubMed]
- 41.Iwaki M, Matsuda M, Maeda N et al (2003) Induction of adiponectin, a fat-derived antidiabetic and antiatherogenic factor, by nuclear receptors. Diabetes 52:1655–1663 [DOI] [PubMed]
- 42.Rosenbaum SE, Greenberg AS (1998) The short- and long-term effects of tumor necrosis factor-alpha and BRL 49653 on peroxisome proliferator-activated receptor (PPAR)gamma2 gene expression and other adipocyte genes. Mol Endocrinol 12:1150–1160 [DOI] [PubMed]
- 43.Hauser S, Adelmant G, Sarraf P, Wright HM, Mueller E, Spiegelman BM (2000) Degradation of the peroxisome proliferator-activated receptor gamma is linked to ligand-dependent activation. J Biol Chem 275:18527–18533 [DOI] [PubMed]
- 44.Takamura T, Nohara E, Nagai Y, Kobayashi K (2001) Stage-specific effects of a thiazolidinedione on proliferation, differentiation and PPARgamma mRNA expression in 3T3-L1 adipocytes. Eur J Pharmacol 422:23–29 [DOI] [PubMed]
- 45.Desvergne B, Wahli W (1999) Peroxisome proliferator-activated receptors: nuclear control of metabolism. Endocr Rev 20:649–688 [DOI] [PubMed]
- 46.Kurebayashi S, Hirose T, Miyashita Y, Kasayama S, Kishimoto T (1997) Thiazolidinediones downregulate stearoyl-CoA desaturase 1 gene expression in 3T3-L1 adipocytes. Diabetes 46:2115–2118 [DOI] [PubMed]
- 47.Llaverias G, Vazquez-Carrera M, Sanchez RM et al (2004) Rosiglitazone upregulates caveolin-1 expression in THP-1 cells through a PPAR-dependent mechanism. J Lipid Res 45:2015–2024 [DOI] [PubMed]
- 48.Chintharlapalli S, Smith R, 3rd, Samudio I, Zhang W, Safe S (2004) 1,1-Bis(3′-indolyl)-1-(p-substitutedphenyl)methanes induce peroxisome proliferator-activated receptor gamma-mediated growth inhibition, transactivation, and differentiation markers in colon cancer cells. Cancer Res 64:5994–6001 [DOI] [PubMed]
- 49.Tan NS, Michalik L, Desvergne B, Wahli W (2005) Multiple expression control mechanisms of peroxisome proliferator-activated receptors and their target genes. J Steroid Biochem Mol Biol 93:99–105 [DOI] [PubMed]
- 50.Guan HP, Ishizuka T, Chui PC, Lehrke M, Lazar MA (2005) Corepressors selectively control the transcriptional activity of PPARgamma in adipocytes. Genes Dev 19:453–461 [DOI] [PMC free article] [PubMed]
Associated Data
This section collects any data citations, data availability statements, or supplementary materials included in this article.
Supplementary Materials
Below is the link to the electronic supplementary material
Q-PCR primer sequences (DOC 26 kb)
Comparison between microarray and quantitative real time RT-PCR analysis. The mean of the fold-change is shown. n = 5 for array n = 6 for RT-PCR. The lines at 1.3 and −1.3 fold changes indicate thresholds of differentially expression (DOC 51 kb)