

Abstract
Aims/hypothesis
Type 2 diabetes mellitus has been associated with brain atrophy and cognitive decline, but the association with ischaemic white matter lesions is unclear. Previous neuroimaging studies have mainly used semiquantitative rating scales to measure atrophy and white matter lesions (WMLs). In this study we used an automated segmentation technique to investigate the association of type 2 diabetes, several diabetes-related risk factors and cognition with cerebral tissue and WML volumes.
Subjects and methods
Magnetic resonance images of 99 patients with type 2 diabetes and 46 control participants from a population-based sample were segmented using a k-nearest neighbour classifier trained on ten manually segmented data sets. White matter, grey matter, lateral ventricles, cerebrospinal fluid not including lateral ventricles, and WML volumes were assessed. Analyses were adjusted for age, sex, level of education and intracranial volume.
Results
Type 2 diabetes was associated with a smaller volume of grey matter (−21.8 ml; 95% CI −34.2, −9.4) and with larger lateral ventricle volume (7.1 ml; 95% CI 2.3, 12.0) and with larger white matter lesion volume (56.5%; 95% CI 4.0, 135.8), whereas white matter volume was not affected. In separate analyses for men and women, the effects of diabetes were only significant in women.
Conclusions/interpretation
The combination of atrophy with larger WML volume indicates that type 2 diabetes is associated with mixed pathology in the brain. The observed sex differences were unexpected and need to be addressed in further studies.
Electronic supplementary material
The online version of this article (doi:10.1007/s00125-007-0688-y) contains a list of members of the Utrecht Diabetic Encephalopathy Study Group, and is available to authorised users.
Keywords: Brain, Diabetes mellitus type 2, Image analysis, Computer-assisted, Leukoaraiosis, Magnetic resonance imaging, White matter lesion
Introduction
Diabetes mellitus type 2 is associated with accelerated cognitive impairment and an increased incidence of dementia [1]. Recently, we have demonstrated that cognitive impairments in patients with type 2 diabetes are accompanied by brain atrophy and ischaemic white matter lesions (WMLs) [2]. Other neuroimaging studies have also demonstrated that type 2 diabetes is associated with a moderate degree of cerebral atrophy [3–5] and with an increased occurrence of cerebral infarcts [6]. These studies have used either semiquantitative rating scales [3, 4] or cerebrospinal fluid to brain ratios [2, 4] to assess atrophy. Quantitative assessment of volumes of grey matter, white matter, lateral ventricle, and cerebrospinal fluid in patients with type 2 diabetes has not been performed.
The association between WMLs and type 2 diabetes is debated. Although several studies found an association between type 2 diabetes and WML severity or progression [2, 7–13], others did not [4, 5, 14–18]. These inconsistencies are probably due to the use of different, mostly semiquantitative, WML grading methods, and differences in study design and population selection. Furthermore, even within the population of healthy elderly the variance in WML severity is large [19].
The present study aimed to determine quantitatively the effects of type 2 diabetes on cerebral tissue volumes and WML severity by using an accurate magnetic resonance (MR) imaging-based automated segmentation algorithm [20] in a large, representative, cross-sectional, population-based sample of patients with type 2 diabetes and control participants. A second aim was to study the association of several diabetes-related variables and cognition with cerebral tissue volumes and WML severity.
Subjects and methods
Participants Participants were recruited between September 2002 and November 2004 as part of the Utrecht Diabetic Encephalopathy Study (UDES), a cross-sectional, population-based study on determinants of impaired cognition in type 2 diabetes [2]. The UDES study aimed to identify potential risk factors for cognitive impairment in type 2 diabetes. Therefore, patients were not selected for the presence or absence of diabetic complications, comorbid conditions (e.g. hypertension) or exposure to other risk factors (e.g. smoking). For inclusion in the present study, participants had to be 55–80 years of age, functionally independent, and Dutch-speaking. Type 2 diabetes patients (n = 122; 56–80 years of age) were recruited through their general practitioner and had a diabetes duration of at least 1 year. Controls (n = 57, 55–78 years of age) were recruited among the spouses and acquaintances of the patients. Exclusion criteria for all participants were a psychiatric or neurological disorder unrelated to diabetes that could influence cognitive functioning, a history of alcohol or substance abuse, and dementia. Controls with a fasting blood glucose ≥7.0 mol/l were also excluded. Twice as many patients as controls were included to increase the statistical power of within-group analyses in the type 2 diabetes group. The study was approved by the medical ethics committee of the University Medical Center Utrecht and each participant signed an informed consent form.In a standardised interview, participants were questioned about diabetes duration, height and weight, history of hypertension and smoking, level of education (seven categories, corresponding to years of education: <6, 6–7, 8, 9, 10–11, 12–18 and >18, respectively [21]), medication use and history of vascular disease. Furthermore, all participants measured their blood pressure at home at nine different time points during the day. These measurements were used to calculate the mean arterial pressure. Hypertension was defined as an average systolic blood pressure ≥160 mmHg and/or diastolic blood pressure ≥95 mmHg and/or self-reported use of blood pressure-lowering drugs. BMI, fasting glucose and HbA1c were also determined. Hypercholesterolaemia was defined as a cholesterol:HDL-cholesterol ratio greater than 5 [22] or the use of cholesterol-lowering drugs. All subjects underwent a neuropsychological evaluation, including 11 different tests addressing the cognitive domains of visuo-construction, attention and executive function, information processing speed, memory and abstract reasoning [2]. For further analysis, the raw scores of the different tests were standardised into z-scores per domain. For the present study, these z-scores were averaged into one composite cognitive z-score.Brain MR images were acquired as part of the study. In 23 participants with type 2 diabetes and 11 control participants no MR images were available for automated analysis: in 14 cases (five controls, nine diabetic patients) an MR image had not been performed because of MR contraindications and in 20 cases (six controls, 14 diabetic patients) the scan could not be analysed automatically because of technical problems, such as failure to retrieve the digital MR images or incompleteness of the series of images, or because image quality did not allow automated processing. Data for 99 patients with type 2 diabetes and 46 controls were analysed. Age, sex and duration of diabetes for the excluded subjects were similar to those for the included subjects (control subjects, average age 64.6 years, five men and six women; diabetic subjects, average age 66.5 years, 13 men, ten women, average diabetes duration 8.7 years).
MR imaging Brain MR images were acquired on a Philips Gyroscan ACS-NT 15 whole-body system operating at 1.5 T (Philips Medical Systems, Best, The Netherlands) with a standardised MR protocol (slice thickness 4 mm, 38 contiguous slices, 230 × 230 mm field of view, 256 × 256 scan matrix). Axial T1, inversion recovery (IR), T2, proton density (PD) and fluid attenuated inversion recovery (FLAIR) scans were made: T1, 234/2 ms (repetition/echo time); IR, 2919/410/22 ms (repetition/inversion/echo time); T2, 2200/100 ms (repetition/echo time); PD, 2200/11 ms (repetition/echo time); FLAIR, 6000/2000/100 ms (repetition/inversion/echo time).
Image processing Preprocessing consisted of intrasubject registration of the five MR sequences and extraction of a brain mask. Registration was performed using an affine nine-parameter mutual information-based algorithm [23] with the FLAIR image as reference.Brain masks were constructed to exclude the skull, skin and background during classification. The masks were extracted by k-means clustering of the T1, IR, T2, PD and FLAIR images using eight clusters. The clusters containing cerebrospinal fluid and brain were combined. Holes in the mask were filled and appending structures, such as eyes, were removed using morphological operators. Dilation of the brain mask by three voxels ensured the inclusion of all cerebrospinal fluid. One mask had to be edited manually because appending structures were included. The final brain masks contained the whole brain including the cerebellum and brainstem.Segmentation of the MR IR and FLAIR images into white matter, cortical and subcortical grey matter, lateral ventricles, cerebrospinal fluid not including the lateral ventricles (CSF) and WML was executed fully automatically by means of a probabilistic k-nearest neighbour (KNN)-based classification algorithm [20]. The algorithm was trained on expert manual segmentations of ten subjects who had varying degrees of WML, who were similar in age to the participants of this study and scanned using the same protocol, but who did not participate in this study. Manual segmentation of grey matter and white matter was performed on MR IR images, because these provide optimal tissue contrast for the assessment of the grey matter–white matter boundary, and manual segmentation of lateral ventricles, CSF and WML was performed on MR FLAIR images. All MR images were available to the expert for reference. Performance of the classification algorithm was validated previously using a leave-one-out procedure and resulted in similarity indexes of at least 0.808, indicating excellent agreement [20]. For each participant, classification produces five separate images of white matter, grey matter, lateral ventricles, CSF and WML probability per voxel. As an example, the result of the classification of the MR FLAIR and inversion recovery images of a diabetes patient is shown in Fig. 1. White matter, grey matter, CSF and lateral ventricle volumes were calculated by summing over the probability image and multiplying with the voxel dimensions. WML volume calculation deviated slightly. A threshold of 0.5 was applied on the WML probability image and all unconnected voxels were removed. Then, WML volume was calculated by summation over the image and multiplication with the voxel dimensions. The intracranial volume was calculated as the sum of white matter, grey matter, lateral ventricles, CSF and WML volumes; total brain as white matter plus grey matter volume; and total CSF as CSF plus lateral ventricle volume. Volumes of automatically segmented tissues for the male control participants of the present study did not differ from the tissue volumes found for the manually segmented men (manually segmented men, n = 8; women, n = 2 [not compared with female controls]). Furthermore, all segmentations were carefully reviewed by one of the authors (C. Jongen). During this process, the author was blinded to the diabetes mellitus status of the participants. Twelve WML segmentations were manually edited to be sure that infarcted tissue was excluded and ten were edited because of artefacts in the FLAIR image.
Fig. 1.
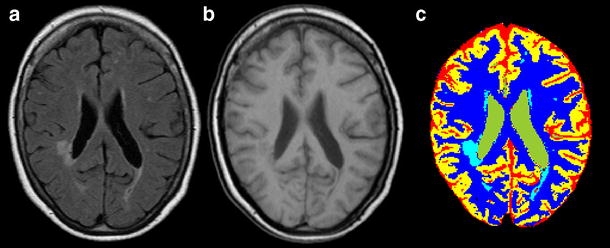
MR FLAIR (a) and inversion recovery image (b) of a diabetes patient with relatively severe WMLs. On the MR FLAIR image, the WMLs are clearly visible as white areas, whereas on the inversion recovery image the boundary between grey and white matter is much better defined. (c) The result of segmentation using the automated KNN-based algorithm. The colours indicate the different tissue classes: grey matter (yellow), white matter (dark blue), lateral ventricles (green), CSF (red) and WML (light blue)
Statistical analysis Differences in demographic data and risk factors between control participants and those with type 2 diabetes were analysed using a univariate general linear model or logistic regression adjusting for age and sex. A univariate general linear model was used to analyse differences in tissue volume between type 2 diabetes and control participants adjusting for age, sex, intracranial volume and level of education. Additionally, separate analyses for men and women were performed, because cerebral tissue volumes are different among men and women. Kolmogorov–Smirnov tests showed that WML volume was not normally distributed. Therefore, we used a natural log transformation of WML volumes in the analyses. Lateral ventricle volume distribution was slightly non-normal. Using natural log-transformed volumes gave similar results to using untransformed volumes. For ease of interpretation, results for untransformed volumes are reported. Additionally, the associations of age with tissue volumes were analysed. Furthermore, associations between the tissue volumes with the composite cognitive performance were analysed for type 2 diabetes and control participants separately, adjusting for age, sex, intracranial volume and level of education. Within the group of type 2 diabetes patients associations between MR volume measures and diabetes duration, HbA1c, hypertension, mean arterial pressure, history of macrovascular disease, and hypercholesterolaemia were determined, adjusting for age, sex, intracranial volume and level of education. All data were analysed using SPSS 12.0.1 (SPSS Inc., Chicago, IL, USA).
Results
Patient characteristics are shown in Table 1. Table 2 shows the brain tissue and WML volumes unadjusted for differences in age or intracranial volume. Table 3 shows the results of the analysis of the tissue volume differences between controls and patients with type 2 diabetes. Diabetes patients had significantly smaller grey matter volume (estimated volume difference −21.8 ml; 95% CI −34.2, −9.4; p = 0.001; F = 12.091) and significantly larger lateral ventricle volume than controls (estimated volume difference 7.1 ml; 95% CI 2.3, 12.0; p = 0.004; F = 8.441). Total CSF volume was also larger in diabetes patients, but not significantly so (estimated volume difference 9.5 ml, 95% CI −0.4, 19.5; p = 0.060; F = 3.594). White matter volume was unaffected (estimated volume difference 2.8 ml, 95% CI −3.2, 8.8; NS; F = 0.844). WML volume was significantly larger in type 2 diabetes patients (56.5%; 95% CI 4.0, 135.8; p = 0.032; F = 4.684). The cumulative distribution of WML volume is shown in Fig. 2. All participants had at least some WML. However, in type 2 diabetes patients a smaller proportion of the subjects had very small lesion volumes (<0.5 ml) (Pearson χ2 with continuity correction, p = 0.014). Such very small volumes mostly reflect pencil-thin lining and capping, which is often considered to be a normal finding in this age group [19]. The regression analyses were repeated for men and women separately (Table 3). Although the direction of the effect of type 2 diabetes was similar in the two sexes, significant associations of type 2 diabetes with tissue volume were only found in women.
Table 1.
Demographics of participants and risk factors
| Control participants | Type 2 diabetes patients | Mean difference (95% CI)a | Odds ratio (95% CI)a | |
|---|---|---|---|---|
| Men/women | 20/26 | 49/50 | – | 1.3 (0.6, 2.6) |
| Age (years) | ||||
| Men | 66.4 (6.3) | 65.9 (6.0) | −0.5 (−2.8, 3.7) | – |
| Women | 63.8 (5.0) | 65.9 (5.2) | 2.1 (−0.4, 4.5) | – |
| Level of educationb | 4 (3–5) | 4 (3–5) | – | – |
| Diabetes duration (years) | – | 8.7 (6.1) | – | – |
| HbA1c (%) | 5.5 (0.3) | 6.8 (1.2) | 1.4 (1.0, 1.7)*** | – |
| Use of insulin (%) | – | 29.3 | – | – |
| Hypertension (%)c | 28.3 | 70.7 | 6.2 (2.8, 13.5)*** | |
| Mean arterial pressure (mmHg) | 97.5 (10.6) | 102.6 (11.5) | 4.8 (0.9, 8.8)* | – |
| History of macrovascular disease (%) | 4.3 | 27.3 | – | 8.3 (1.8, 37.0)** |
| Hypercholesterolaemia (%) | 42.2 | 69.4 | – | 3.7 (1.7, 8.1)** |
| Smoking ever (%) | 47.8 | 66.3 | – | 2.2 (1.0, 4.7)* |
| BMI (kg/m2) | 27.2 (4.4) | 28.0 (4.4) | 0.8 (−0.8, 2.4) | – |
| Cognition (composite z-score) | 0.13 (0.45) | −0.10 (0.63) | −0.22 (−0.40, −0.05)*d | – |
Data in first two columns are mean (SD) except for level of education, which is given as median (interquartile range)
*p < 0.05; **p < 0.01; ***p < 0.001
aAdjusted for age and sex
bSeven categories, corresponding to years of education: <6, 6–7, 8, 9, 10–11, 12–18 and >18, respectively
cAll controls with hypertension and 96% of diabetic patients with hypertension used antihypertensive drugs
dAdjusted for age, sex and level of education
Table 2.
Volumes of cerebral compartments (ml) unadjusted for age or intracranial volume
| Control participants | Type 2 diabetes patients | |||
|---|---|---|---|---|
| Men | Women | Men | Women | |
| White matter | 688.0 (49.3) | 621.8 (46.9) | 687.2 (56.5) | 601.0 (56.5) |
| Grey matter | 401.7 (47.8) | 404.4 (40.8) | 388.3 (48.8) | 360.1 (35.6) |
| Total brain | 1,090 (81.0) | 1,026 (72.9) | 1,076 (91.0) | 961.1 (71.0) |
| Lateral ventricle | 33.9 (18.7) | 22.1 (8.66) | 36.9 (17.4) | 29.8 (13.9) |
| Lateral ventriclea | 30.1 (23.9–36.6) | 20.3 (16.6–28.0) | 33.8 (24.9–42.6) | 26.7 (20.6–35.3) |
| CSF excluding lateral ventricles | 273.3 (27.1) | 222.1 (25.1) | 279.7 (37.8) | 229.4 (35.9) |
| Total CSF | 307.2 (32.3) | 244.2 (26.3) | 316.5 (42.4) | 259.2 (41.2) |
| WML | 3.89 (5.76) | 2.98 (4.70) | 3.66 (5.37) | 6.19 (14.2) |
| WMLa | 1.81 (0.47–3.48) | 1.00 (0.48–3.20) | 2.16 (0.91–3.86) | 2.56 (0.86–4.46) |
| Intracranial volume | 1,403 (90.7) | 1,275 (82.2) | 1,398 (104.2) | 1,228 (93.7) |
aLateral ventricle and WML volumes are median (interquartile range); other data are mean (SD)
Between-group comparisons and statistical analyses are presented in Table 3
Table 3.
Adjusted tissue volume differences between participants with type 2 diabetes and control participants
| Estimated volume difference (ml) | F value | |
|---|---|---|
| All | ||
| White matter | 2.8 (−3.2, 8.8) | 0.844 |
| Grey matter | −21.8 (−34.2, −9.4)** | 12.091 |
| Total brain | −19.0 (−29.9, −8.1)** | 11.863 |
| Lateral ventricles | 7.1 (2.3, 12.0)** | 8.441 |
| CSF not including lateral ventricles | 9.5 (−0.4, 19.5) | 3.594 |
| Total CSF | 16.7 (6.8, 26.5)** | 11.247 |
| LN WML | 0.45 (0.04, 0.86)a* | 4.684 |
| Men | ||
| White matter | 1.8 (−7.4, 11.0) | 0.157 |
| Grey matter | −14.5 (−33.6, 4.6) | 2.315 |
| Total brain | −12.7 (−30.6, 5.2) | 2.026 |
| Lateral ventricles | 4.9 (−3.7, 13.5) | 1.283 |
| CSF not including lateral ventricles | 6.9 (−10.2, 24.0) | 0.650 |
| Total CSF | 11.8 (−4.9, 28.5) | 1.993 |
| LN WML | 0.37 (−0.19, 0.93)b | 1.781 |
| Women | ||
| White matter | 7.0 (−1.5, 15.6) | 2.696 |
| Grey matter | −37.1 (−54.1, −20.1)*** | 19.062 |
| Total brain | −30.1 (−44.9, 15.4)*** | 16.695 |
| Lateral ventricles | 9.0 (3.2, 14.8)** | 9.563 |
| CSF not including lateral ventricles | 17.2 (4.9, 29.4)** | 7.802 |
| Total CSF | 26.1 (13.6, 38.7)*** | 17.215 |
| LN WML | 0.54 (−0.11, 1.20)c | 2.745 |
LN WML Natural log of WML volume
Data are mean (95% CI) adjusted for age, sex, intracranial volume and level of education (data missing for one woman with type 2 diabetes)
*p < 0.05; **p < 0.01; ***p < 0.001
a56.5% (95% CI 4.0, 135.8)
b44.9% (95% CI −17.0, 154.7)
c72.4% (95% CI −10.6, 232.4)
Fig. 2.
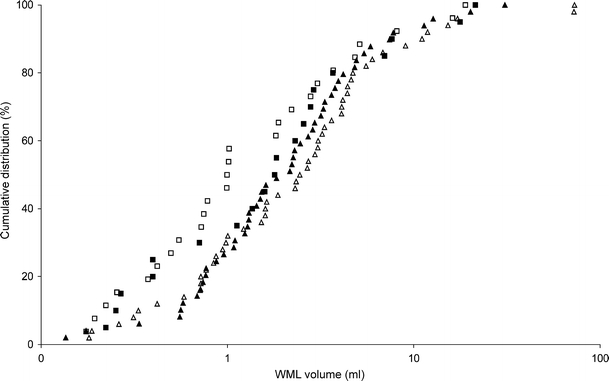
Cumulative distribution of WML volume (control men, closed squares; men with type 2 diabetes, closed triangles; control women, open squares; women with type 2 diabetes, open triangles). Very small lesion volumes (<0.5 ml) were significantly more frequent among controls (p = 0.014) than participants with type 2 diabetes
Within the patients with type 2 diabetes, no significant associations between MR volumes and diabetes duration, hypertension, mean arterial pressure or hypercholesterolaemia were found. Higher HbA1c levels were associated with larger grey matter volume (6.479 ml per unit HbA1c (%); 95% CI 0.2, 12.8; p = 0.043; F = 4.203), but not with any other volume abnormalities. A history of macrovascular disease was associated with a larger total CSF volume (12.4 ml; 95% CI 2.6, 28.7; p = 0.020; F = 5.659) and a smaller total brain volume (−15.0 ml; 95% CI −29.8, −0.2; p = 0.047; F = 4.057). In the diabetic participants lower composite cognitive performance was associated with significantly smaller total brain volume (−15.4 ml per unit of the composite cognitive z-score; 95% CI −27.6, −3.1; p = 0.015; F = 6.199), larger WML volume (57.4%; 95% CI 2.2, 142.4; p = 0.040; F = 4.370) and non-significantly larger total CSF volume (11.0 ml; 95% CI −0.6, 22.1; p = 0.051; F = 3.911).
In the control group exploratory analyses showed an association between higher BMI and larger total CSF volume (2.0 ml; 95% CI 0.34, 3.6; p = 0.017; F = 6.287). No other significant associations were found within the control group.
Across the whole population, age was significantly associated with reduced grey matter and total brain volumes and larger lateral ventricle, CSF, total CSF and WML volumes (p < 0.001; F > 20.424; adjusted for diabetic status, sex, intracranial volume and level of education). Age was the most powerful predictor of WML and lateral ventricle volumes and it came second after intracranial volume for predicting grey matter, CSF, total brain and total CSF volumes. No significant interactions between age and type 2 diabetes were found (all p > 0.14). The interaction between age and sex showed a trend towards significance, men having more grey matter decrease (−1.8 ml/year; 95% CI −3.9, 0.3; p = 0.092; F = 2.888) and women having more white matter decrease (−0.9 ml/year; 95% CI −1.9, 0.1; p = 0.079; F = 3.134) with age (other volumes p > 0.26).
Discussion
Our MR image-based segmentation paradigm showed that type 2 diabetes was significantly associated with smaller grey matter volumes and larger lateral ventricle and WML volumes, whereas white matter volume was not affected. A smaller grey matter volume suggests cortical atrophy, whereas a larger lateral ventricle volume may indicate subcortical atrophy. Separate analysis for men and women showed significantly smaller grey matter and total brain volumes and significantly larger lateral ventricle, CSF and total CSF volumes in female but not in male diabetic patients.
The apparent differential effects of diabetes on brain volumes in men and women were an unexpected finding. Previous studies on cognitive functioning or dementia in patients with diabetes have provided no clear indications that the effects of diabetes on the brain might be sex-specific [24], although it should be noted that the role of sex has not yet been studied systematically. In the general population, intracranial volume and relative and absolute grey matter and white matter volumes are known to differ between men and women [25]. Sex also influences the effects of ageing [26–28], men being more severely affected by age-related grey matter decrease than women [29, 30], which was also found in this study. WML volumes among male and female controls were similar, but in female type 2 diabetes patients we found significantly larger WML volumes than in male type 2 diabetes patients. In conditions other than diabetes, more severe WMLs in women than in men have been reported [15, 31–33], but similar WML severity in both sexes has also been reported [19]. Diabetic women had non-significantly smaller age-adjusted total intracranial volumes than control women. However, the expected effects of these intracranial volume differences on brain tissue volumes were smaller than the observed differences in effects on grey matter, CSF and lateral ventricle volumes. Age is a very important predictor of brain tissue and WML volumes and age effects may have confounded the effects of type 2 diabetes in men and women in this study. Hence, the implications of the effect of sex observed in the present study remain to be determined.
No statistically significant associations between MR image measures and hypertension or mean arterial pressure within the group of type 2 diabetes patients were found. Similar results were obtained with manual measurements of atrophy and with WML grading in the same study population [2], and in a study that assessed the relation between type 2 diabetes, blood pressure and temporal lobe atrophy [5]. In contrast, another study reported that hypertension was an important determinant of cortical atrophy in patients with type 2 diabetes [4]. We found an association between glycosylated haemoglobin and a slight increase in grey matter volume in type 2 diabetes patients. This counterintuitive finding may be due to chance. Other studies in subjects without diabetes have linked increased glycosylated haemoglobin with cerebral atrophy [34] and WMLs [35]. Cognitive impairment was associated with smaller total brain volume and larger WML volumes in type 2 diabetes patients. This is in line with observations from another recent study that reported an association between WMLs and subcortical brain atrophy and cognitive performance, in particular the speed of information processing [36]. This suggests that atrophy as well as WMLs have a negative impact on cognition.
Previous studies that analysed WML volume or progression in type 2 diabetes patients have reported inconsistent results [4, 5, 7–18]. Several methodological factors may have contributed to these inconsistencies. First, techniques to measure WML severity have varied widely, from noting lesion presence or absence [12] to volumetric measurements [13, 18]. The majority of studies applied semiquantitative ordinal grading scales. It has been shown that these scales can give variable results [37] and some scales are relatively insensitive to mild to moderate WMLs. Second, the examined populations and the study design varied considerably [38]. Only a small proportion of the studies had a true population-based setting, whereas the majority of studies were hospital-based, involving cohorts of patients with stroke, hypertension or other forms of cardiovascular disease. Furthermore, several studies involved fewer than 20 type 2 diabetes patients [8, 11–13, 18]. These small sample sizes may have reduced statistical power. The present study used volumetric measurements in a large population-based sample.
The combination of increased atrophy and increased WML volume indicates that type 2 diabetes is associated with mixed pathology in the brain. The association with vascular lesions, such as WML, is not surprising because diabetes is a well-known risk factor for cerebrovascular disease [39]. Indeed, previous imaging studies [38], as well as autopsy studies [40], have reported an increased occurrence of vascular lesions, in particular infarcts, in diabetic patients relative to controls. The mechanisms underlying accelerated brain atrophy in diabetic patients are less clear. Several processes related to glucose toxicity, abnormalities in cerebral insulin homeostasis, and microvascular abnormalities have been implicated [41], but their exact contributions to abnormalities in cerebral function and structure in diabetes still need to be elucidated.
A limitation of our quantitative automated volumetric segmentation algorithm is slight overestimation of the CSF and slight underestimation of the lateral ventricle volume in subjects with markedly enlarged occipital horns. Some misclassification of interhemispheric CSF as lateral ventricle might also occur. However, the misclassified volumes are small compared with ventricle (about 2% and 6%) and CSF (about 0.3% and 0.4%) volumes and total CSF volumes are not affected. The artefacts were proportionally distributed across men and women and between type 2 diabetes patients and controls. Therefore, it is unlikely that these inaccuracies affected the analyses. Furthermore, all segmentations were inspected visually, so results will not have been affected by other segmentation errors.
Our algorithm did not classify WMLs into deep and periventricular lesions. Such automated subclassification may provide valuable information; however, it is hard to achieve. WMLs tend to extend smoothly from the ventricular wall [42] and periventricular WMLs are often connected to deep WMLs on MR images. Therefore, defining meaningful boundary criteria that can be consistently and reproducibly applied automatically is difficult.
Other published methods have used T1 and T2 [25], PD and T2 [26], T1 only [27], or T1, PD and T2 [30] MR images for segmentation. However, in a previous study it was shown that the use of IR and FLAIR images is highly preferable in brain tissue segmentation and that optimal performance of the automated KNN classification algorithm is achieved with this combination of images [20]. Furthermore, the learning data were segmented manually on the basis of IR and FLAIR images with the T1, T2 and PD images available to the expert for reference. Thus, our KNN classifier retrieves its learning data from expert segmentations based on all available information and segments using the optimal image combination for tissue classification.
Our automated segmentation method offers major advantages over manual methods by enabling precise, objective and reproducible volumetric measurements of cerebral tissues in large numbers of patients. In future studies, this method might be used to quantify the progression of abnormalities on MR images in patients with type 2 diabetes, as well as in patients with other conditions. Such studies using quantitative MR data should focus not only on the differences between groups of patients and controls, but also on differences within a patient group to identify determinants of structural brain changes.
Electronic supplementary material
Below is the link to the electronic supplementary material.
Acknowledgements
This research was financially supported by the Dutch Diabetes Research Foundation (grant 2001.00.023). The authors would like to thank P. Anbeek for kindly supplying the software for segmentation.
Conflict of interest statement The authors have no conflicts of interest to report.
Abbreviations
- CSF
cerebrospinal fluid not including the lateral ventricles
- FLAIR
fluid attenuated inversion recovery
- IR
inversion recovery
- KNN
k-nearest neighbour
- MR
magnetic resonance
- PD
proton density
- WML
white matter lesion
Footnotes
Electronic supplementary material
The online version of this article (doi:10.1007/s00125-007-0688-y) contains a list of members of the Utrecht Diabetic Encephalopathy Study Group, and is available to authorised users.
References
- 1.Allen KV, Frier BM, Strachan MWJ (2004) The relationship between type 2 diabetes and cognitive dysfunction: longitudinal studies and their methodological limitations. Eur J Pharmacol 490:169–175 [DOI] [PubMed]
- 2.Manschot SM, Brands AMA, van der Grond J et al (2006) Brain magnetic resonance imaging correlates of impaired cognition in patients with type 2 diabetes. Diabetes 55:1106–1113 [DOI] [PubMed]
- 3.Araki Y, Nomura M, Tanaka H et al (1994) MRI of the brain in diabetes mellitus. Neuroradiology 36:101–103 [DOI] [PubMed]
- 4.Schmidt R, Launer LJ, Nilsson LG et al (2004) Magnetic resonance imaging of the brain in diabetes: the Cardiovascular Determinants of Dementia (CASCADE) Study. Diabetes 53:687–692 [DOI] [PubMed]
- 5.den Heijer T, Vermeer SE, van Dijk EJ et al (2003) Type 2 diabetes and atrophy of medial temporal lobe structures on brain MRI. Diabetologia 46:1604–1610 [DOI] [PubMed]
- 6.Vermeer SE, den Heijer T, Koudstaal PJ, Oudkerk M, Hofman A, Breteler MMB (2003) Incidence and risk factors of silent brain infarcts in the population-based Rotterdam Scan Study. Stroke 34:392–396 [DOI] [PubMed]
- 7.Streifler JY, Eliasziw M, Benavente OR et al (2003) Development and progression of leukoaraiosis in patients with brain ischemia and carotid artery disease. Stroke 34:1913–1917 [DOI] [PubMed]
- 8.Ylikoski A, Erkinjuntti T, Raininko R, Sarna S, Sulkava R, Tilvis R (1995) White matter hyperintensities on MRI in the neurologically nondiseased elderly. Analysis of cohorts of consecutive subjects aged 55 to 85 years living at home. Stroke 26:1171–1177 [DOI] [PubMed]
- 9.Kertesz A, Black SE, Tokar G, Benke T, Carr T, Nicholson L (1988) Periventricular and subcortical hyperintensities on magnetic resonance imaging. ‘Rims, caps, and unidentified bright objects’. Arch Neurol 45:404–408 [DOI] [PubMed]
- 10.Schmidt R, Fazekas F, Kleinert G et al (1992) Magnetic resonance imaging signal hyperintensities in the deep and subcortical white matter. A comparative study between stroke patients and normal volunteers. Arch Neurol 49:825–827 [DOI] [PubMed]
- 11.Erkinjuntti T, Gao F, Lee DH, Eliasziw M, Merskey H, Hachinski VC (1994) Lack of difference in brain hyperintensities between patients with early Alzheimer’s disease and control subjects. Arch Neurol 51:260–268 [DOI] [PubMed]
- 12.Fazekas F, Niederkorn K, Schmidt R et al (1988) White matter signal abnormalities in normal individuals: correlation with carotid ultrasonography, cerebral blood flow measurements, and cerebrovascular risk factors. Stroke 19:1285–1288 [DOI] [PubMed]
- 13.Taylor WD, MacFall JR, Provenzale JM et al (2003) Serial MR imaging of volumes of hyperintense white matter lesions in elderly patients: correlation with vascular risk factors. Am J Roentgenol 181:571–576 [DOI] [PubMed]
- 14.Jeerakathil T, Wolf PA, Beiser A et al (2004) Stroke risk profile predicts white matter hyperintensity volume: the Framingham Study. Stroke 35:1857–1861 [DOI] [PubMed]
- 15.Longstreth WT, Manolio TA, Arnold A et al (1996) Clinical correlates of white matter findings on cranial magnetic resonance imaging of 3,301 elderly people. The Cardiovascular Health Study. Stroke 27:1274–1282 [DOI] [PubMed]
- 16.Fukuda H, Kitani M (1995) Differences between treated and untreated hypertensive subjects in the extent of periventricular hyperintensities observed on brain MRI. Stroke 26:1593–1597 [DOI] [PubMed]
- 17.Manolio TA, Kronmal RA, Burke GL et al (1994) Magnetic resonance abnormalities and cardiovascular disease in older adults. The Cardiovascular Health Study. Stroke 25:318–327 [DOI] [PubMed]
- 18.Schmidt R, Enzinger C, Ropele S, Schmidt H, Fazekas F (2003) Progression of cerebral white matter lesions: 6-year results of the Austrian Stroke Prevention Study. Lancet 361:2046–2048 [DOI] [PubMed]
- 19.Wen W, Sachdev P (2004) The topography of white matter hyperintensities on brain MRI in healthy 60- to 64-year-old individuals. Neuroimage 22:144–154 [DOI] [PubMed]
- 20.Anbeek P, Vincken KL, van Bochove GS, van Osch MJP, van der Grond J (2005) Probabilistic segmentation of brain tissue in MR imaging. Neuroimage 27:795–804 [DOI] [PubMed]
- 21.Hochstenbach J, Mulder T, van Limbeek J, Donders R, Schoonderwaldt H (1998) Cognitive decline following stroke: a comprehensive study of cognitive decline following stroke. J Clin Exp Neuropsychol 20:503–517 [DOI] [PubMed]
- 22.Wilson PW, Garrison RJ, Castelli WP, Feinleib M, McNamara PM, Kannel WB (1980) Prevalence of coronary heart disease in the Framingham Offspring Study: the role of lipoprotein cholesterols. Am J Cardiol 46:649–654 [DOI] [PubMed]
- 23.Maes F, Collignon A, Vandermeulen D, Marchal G, Suetens P (1997) Multimodality image registration by maximization of mutual information. IEEE Trans Med Imag 16:187–198 [DOI] [PubMed]
- 24.Biessels GJ, Staekenborg S, Brunner E, Brayne C, Scheltens P (2006) Risk of dementia in diabetes mellitus: a systematic review. Lancet Neurol 5:64–74 [DOI] [PubMed]
- 25.Lemaitre H, Crivello F, Grassiot B, Alperovitch A, Tzourio C, Mazoyer B (2005) Age-and sex-related effects on the neuroanatomy of healthy elderly. Neuroimage 26:900–911 [DOI] [PubMed]
- 26.Blatter DD, Bigler ED, Gale SD et al (1995) Quantitative volumetric analysis of brain MR: normative database spanning 5 decades of life. Am J Neuroradiol 16:241–251 [PMC free article] [PubMed]
- 27.Good CD, Johnsrude IS, Ashburner J, Henson RNA, Friston KJ, Frackowiak RSJ (2001) A voxel-based morphometric study of ageing in 465 normal adult human brains. Neuroimage 14:21–36 [DOI] [PubMed]
- 28.Xu J, Kobayashi S, Yamaguchi S, Iijima Ki, Okada K, Yamashita K (2000) Gender effects on age-related changes in brain structure. Am J Neuroradiol 21:112–118 [PMC free article] [PubMed]
- 29.Allen JS, Damasio H, Grabowski TJ (2002) Normal neuroanatomical variation in the human brain: an MRI-volumetric study. Am J Phys Anthropol 118:341–358 [DOI] [PubMed]
- 30.Taki Y, Goto R, Evans A et al (2004) Voxel-based morphometry of human brain with age and cerebrovascular risk factors. Neurobiol Aging 25:455–463 [DOI] [PubMed]
- 31.de Leeuw FE, de Groot JC, Achten E et al (2001) Prevalence of cerebral white matter lesions in elderly people: a population based magnetic resonance imaging study. The Rotterdam Scan Study. J Neurol Neurosurg Psychiatry 70:9–14 [DOI] [PMC free article] [PubMed]
- 32.van den Heuvel DMJ, Admiraal-Behloul F, ten Dam VH et al (2004) Different progression rates for deep white matter hyperintensities in elderly men and women. Neurology 63:1699–1701 [DOI] [PubMed]
- 33.Sawada H, Udaka F, Izumi Y et al (2000) Cerebral white matter lesions are not associated with apoE genotype but with age and female sex in Alzheimer’s disease. J Neurol Neurosurg Psychiatry 68:653–656 [DOI] [PMC free article] [PubMed]
- 34.Enzinger C, Fazekas F, Matthews PM et al (2005) Risk factors for progression of brain atrophy in aging: six-year follow-up of normal subjects. Neurology 64:1704–1711 [DOI] [PubMed]
- 35.Murray AD, Staff RT, Shenkin SD, Deary IJ, Starr JM, Whalley LJ (2005) Brain white matter hyperintensities: relative importance of vascular risk factors in nondemented elderly people. Radiology 237:251–257 [DOI] [PubMed]
- 36.Akisaki T, Sakurai T, Takata T et al (2006) Cognitive dysfunction associates with white matter hyperintensities and subcortical atrophy on magnetic resonance imaging of the elderly diabetes mellitus Japanese elderly diabetes intervention trial (J-EDIT). Diabetes Metab Res Rev 22:376–384 [DOI] [PubMed]
- 37.Mantyla R, Erkinjuntti T, Salonen O et al (1997) Variable agreement between visual rating scales for white matter hyperintensities on MRI. Comparison of 13 rating scales in a poststroke cohort. Stroke 28:1614–1623 [DOI] [PubMed]
- 38.van Harten B, de Leeuw FE, Weinstein HC, Scheltens P, Biessels GJ (2006) Brain imaging in patients with diabetes: a systematic review. Diabetes Care 29:2539–2548 [DOI] [PubMed]
- 39.Mankovsky BN, Ziegler D (2004) Stroke in patients with diabetes mellitus. Diabetes Metab Res Rev 20:268–287 [DOI] [PubMed]
- 40.Peress NS, Kane WC, Aronson SM (1973) Central nervous system findings in a tenth decade autopsy population. Prog Brain Res 40:473–483 [DOI] [PubMed]
- 41.Biessels GJ, Staekenborg S, Brunner E, Brayne C, Scheltens P (2006) Risk of dementia in diabetes mellitus: a systematic review. Lancet Neurol 5:64–74 [DOI] [PubMed]
- 42.DeCarli CM, Fletcher EP, Ramey V, Harvey DP, Jagust WJM (2005) Anatomical mapping of white matter hyperintensities (WMH): exploring the relationships between periventricular WMH, deep WMH, and total WMH burden. Stroke 36:50–55 [DOI] [PMC free article] [PubMed]
Associated Data
This section collects any data citations, data availability statements, or supplementary materials included in this article.
Supplementary Materials
Below is the link to the electronic supplementary material.