

Abstract
Host genetics determines the course of Bordetella pertussis infection in mice. Previously, we found four loci, Tlr4 and three novel loci, designated Bps 1–3, that are involved in the control of B. pertussis infection. The purpose of the present study was to identify candidate genes that could explain genetic differences in the course of B. pertussis infection, assuming that such genes are differentially regulated upon infection. We, therefore, studied the course of mRNA expression in the lungs after B. pertussis infection. Of the 22,000 genes investigated, 1,841 were significantly differentially expressed with 1,182 genes upregulated and 659 genes downregulated. Upregulated genes were involved in immune-related processes, such as the acute-phase response, antigen presentation, cytokine production, inflammation, and apoptosis, while downregulated genes were mainly involved in nonimmune processes, such as development and muscle contraction. Pathway analysis revealed the involvement of granulocyte function, toll-like receptor signaling pathway, and apoptosis. Nine of the differentially expressed genes were located in Bps-1, 13 were located in Bps-2, and 62 were located in Bps-3. We conclude that B. pertussis infection induces a wide and complex response, which appears to be partly specific for B. pertussis and partly nonspecific. We envisage that these data will be helpful in identifying polymorphic genes that affect the susceptibility and course of B. pertussis infection in humans.
Electronic supplementary material
The online version of this article (doi:10.1007/s00251-007-0227-5) contains supplementary material, which is available to authorized users. Raw and normalized data of the experiment can be accessed at the online database ArrayExpress http://www.ebi.ac.uk/arrayexpress/
Keywords: Bordetella pertussis, Expression profiles, Gene expression, Immunity, Pathway analysis
Introduction
The airway pathogen Bordetella pertussis can cause the disease known as whooping cough. Despite high vaccination coverage, pertussis is still an endemic disease with peaks in incidence every 2–3 years during the last decade (Crowcroft and Pebody 2006; de Greeff et al. 2003, 2005). Susceptibility to and severity of B. pertussis infection in infants and children vary widely (Kimman 2001). The spectrum of clinical symptoms ranges from subclinical infection to mild disease, severe whooping cough, and death. In previous studies, we examined genetic susceptibility of mice to B. pertussis and identified loci in the mouse genome that are involved in restriction of colonization and/or clearance of B. pertussis. We and others have provided indications for the role of several polymorphic host genes in the course of B. pertussis infection, including the interferon gamma receptor (Mahon et al. 1997), toll-like receptor 4 (Tlr4; Higgins et al. 2003; Mann et al. 2004, 2005), and three putative disease loci, B. pertussis susceptibility locus 1, 2, and 3 (Bps-1, 2, and 3; Banus et al. 2005). Tlr4 is a major host factor involved in the course of B. pertussis infection. C3H/HeJ mice, which carry a nonfunctional Tlr4 gene, exhibit an aberrant course of infection. Functional Tlr4 is essential for an efficient IL1-β, TNF-α, and IFN-γ response, efficient clearance of bacteria from the lung, and therewith reduced lung pathology (Banus et al. 2006). The Bps-1 locus is located on chromosome 12, spanning a region of 185 genes and has a dominant positive effect on the clearance of B. pertussis from the lung. The function of most genes in this locus is unknown. Two other loci, Bps-2 and Bps-3, showed genetic interaction and are located on chromosomes 5 and 11, respectively (Banus et al. 2005).
The highest linkage between the number of colony-forming units (CFU) and the Bps-1 locus that we observed showed a logarithm of the odds (LOD) score of 4.6. This LOD score and the corresponding P value (P = 0.000025) are statistically significant also after correction for multiple comparisons (P = 0.0019). We interpreted these data as suggestive for linkage warranting further investigation (Banus et al. 2005). In the present study, we aimed to enhance the insight in the host response and pathogenesis of B. pertussis infection by identifying genes that are differentially expressed upon infection. In particular, we were interested in identifying candidate genes that could explain genetic differences in the course of B. pertussis infection, assuming that such genes are differentially regulated upon infection. For this purpose, we infected mice and analyzed gene-expression profiles in the lungs on days 1, 3, and 5 after inoculation using microarrays. We were especially interested if genes, located in the Bps-1, 2, and 3 loci, were differentially expressed after B. pertussis infection or that the susceptibility of these loci was regulated alternately.
Materials and methods
Experimental design
Female C3H/DISnA mice (eight mice per group, total of 48) were intranasally inoculated with 2 × 10⁷ CFU of the streptomycin-resistant Tohama strain of B. pertussis (B213) in 40 μl of Verwey medium (The Netherlands Vaccine institute, Bilthoven, The Netherlands) or as a control with Verwey Medium only. One, 3, and 5 days after inoculation, mice were euthanized. To remove blood cells from the lungs, mice were perfused with phosphate-buffered saline, and the lungs and trachea were collected (King et al. 2001; Willems et al. 1998). For the extraction of RNA, the right lung was collected in the RNA stabilization reagent (RNAlater, Qiagen, Venlo, The Netherlands). The left lung was fixed intratracheally using 4% formalin for histological examination.
The number of viable B. pertussis bacteria was determined in the trachea to confirm a proper infection (Verwey et al. 1949). Therefore, approximately 1 cm of the trachea was collected in 500 μl of Verwey medium. Bacterial suspensions were diluted in Verwey medium, and the number of CFU was determined by plating on Bordet Gengou agar supplemented with 15% sheep blood and 30 μg/ml streptomycin (Tritium Microbiology, Veldhoven, The Netherlands). Plates were incubated for 4 days at 35°C before counting the number of CFUs using a ProtoCOL Colony counter (Synbiosis, Cambridge, UK).
Animals
Female C3H/DISnA mice were kindly supplied by Dr. Peter Demant (Department of Molecular and Cellular Biology, Roswell Park Cancer Institute, Buffalo, NY). Mice were bred to the appropriate numbers at our animal testing facility in Bilthoven, The Netherlands. Mice were acclimatized for at least 1 week before the start of the experiments. Mice received standard laboratory food (SRM-A, Hope Farms, Woerden, The Netherlands) and tap water ad libitum. All animal experiments were approved by the Institute’s Animal Ethics Committee and were performed according to the National Institutes of Health (1996) guidelines.
Clinical and pathological examinations
Mice were weighed before inoculation and subsequently every day after inoculation to determine the relative change in weight. Lung weights were determined postmortem as a parameter for lung inflammation. Formalin-fixed lungs were embedded in paraplast (Monoject, St Louis, MO). Sections (5 μm) were stained with hematoxylin eosin. Lung lesions were examined for infiltration of inflammatory cells in the peribronchiolar space (peribronchiolitis), infiltration of inflammatory cells in the alveoli (alveolitis), infiltration of inflammatory cells in the perivascular space (perivasculitis), hypertrophy of mucus-producing glands, free protein (exudate), and eosinophilia. Lung lesions were scored semiquantitatively as absent, minimal, slight, moderate, marked, or strong as previously described (Barends et al. 2004).
Transcription profiling
Lungs were incubated in RNAlater (Qiagen) at 4°C for 1 day, after which, the tissues were transferred to a fresh tube and stored at −80°C. RNA was extracted by using the midi-RNA isolation kit (Qiagen). RNA concentrations were measured using a NanoDrop Spectrophotometer (NanoDrop Technologies, Wilmington, DE). RNA quality was determined using the 2100 Bioanalyzer (Agilent Technologies, Santa Clara, CA) and was expressed as the RNA Integrity Number (RIN) as defined by the manufacturer. Only samples with a RIN score of at least eight (on a 1–10 scale) were used for expression profiling.
Microarray slides were spotted at the Microarray Department of the University of Amsterdam. The slides contain 21,997 65-mer oligo nucleotides from the Sigma-Compugen Mouse oligonucleotide library, 192 additional 65-mer oligo nucleotides of genes, of which 185 were located in the Bps-1 region spotted in duplicate (Isogen Life science, IJsselstein, The Netherlands), as well as appropriate controls and blank spots.
Based on RNA quality and yield, RNA isolated from six mice per group was selected for amplification and labeling. RNA amplification and labeling were carried out using the Amino Allyl MessageAmp II aRNA kit (Ambion, Austin, TX) using 1 μg of total RNA as starting material. RNA samples from individual mice were labeled with Cy3. A common reference containing a RNA pool of all samples isolated was labeled with Cy5. After hybridization and washing, the arrays were scanned using a ScanArray 4000XL microarray scanner (Perkin-Elmer, Wellesley, MA).
Median Cy3 and Cy5 spot signals were determined using ArrayVision (Imaging Research, St. Catharines, ON, Canada). Quality control was performed by means of visual inspection of the scanned images, raw data scatter, and MA plots (M is a mnemonic for the log-ratios of expression, A is a mnemonic for the log-intensity of each spot; Smyth and Speed 2003), as well as a normal probability plot to assess signal distribution (Pennings and Heisterkamp 2004). If more than 10% of the spots were flagged as missing data, slides were excluded from data analysis. At least five slides per group were used for further analysis.
Raw microarray signal data were normalized in the R statistical software environment (R Development Core Team 2005) using a four-step approach of (1) natural log transformation, (2) quantile normalization of all scans, (3) correcting for differences in the reference signal, and (4) averaging replicate spot data.
Significance of differences in gene expression between the experimental groups was calculated in R with analysis of variance. The false discovery rate (FDR) was calculated according to Benjamini and Hochberg (1995). The FDR is the expected proportion of false positives among the genes considered significantly differentially expressed (Benjamini et al. 2001; Benjamini and Hochberg 1995). Gene-expression data were visualized by hierarchical clustering (using Euclidian distance and Ward linkage) using GeneMaths (Applied Maths, St-Martens-Latem, Belgium). For this purpose, gene-expression values were corrected for the overall average to allow a neutral comparison between all B. pertussis- and mock-inoculated groups. Gene categories were defined by Gene Ontology (GO, http://www.geneontology.org). Classification and enrichment according to GO categories were determined using DAVID/EASE (Dennis et al. 2003; Hosack et al. 2003), using EASE scores as P values for enrichment. Additional pathway analysis was performed using MetaCore™ (GeneGo, http://www.genego.com).
Results
Bacteriologic and pathologic findings
All B. pertussis-inoculated mice had between 102 and 105 CFUs in the trachea during the first 5 days after inoculation thereby confirming a proper infection. A statistically significant decrease in the number of bacteria in the trachea was observed over time during the first 5 days postinoculation (P = 0.022, linear regression, SPSS, data not shown).
Infected mice lost up to 4% of their body weight during the first 5 days postinoculation, while all mock-inoculated mice gained weight up to 4% during these 5 days. This difference in relative gain of weight between mock- and B. pertussis-inoculated mice is significant from day 1 to 5 postinoculation (Supplementary data Figure 2).
We determined lung weights in relation to body weight as a marker for inflammation. All mock-inoculated mice had relative lung weights of approximately 1% during the first 5 days after inoculation, while B. pertussis-infected mice had relative lung weights of up to 3% of their total body weight. This difference in relative lung weights between mock- and B. pertussis-inoculated mice is significant from day 1 to 5 postinoculation (Supplementary data Figure 3).
A summary of histopathological findings is presented in Table 1. Intranasal inoculation of B. pertussis causes an acute inflammatory response that is characterized by influx of polymorphonuclear leukocytes (PMNs) and macrophages starting in perivascular and peribronchiolar areas on day 1 and extending to alveolar walls and lumina on days 3 and 5.
Table 1.
Histological evaluation of lung changes after B. pertussis inoculation
| Parameter and grade | No. of animalsa | ||||||
|---|---|---|---|---|---|---|---|
| Mock | B. pertussis | ||||||
| Day 1 | Day 3 | Day 5 | Day 1 | Day 3 | Day 5 | ||
| Peribrochiolitisb | Minimal | 2 | 3 | 4 | 2 | 2 | |
| Slight | 1 | 2 | 5 | ||||
| Moderate | 3 | ||||||
| Totalc | (25%) | (0%) | (38%) | (63%) | (88%) | (88%) | |
| Perivasculitis | Minimal | 2 | 2 | 2 | 2 | 1 | |
| Slight | 4 | 3 | 3 | ||||
| Moderate | 3 | 5 | |||||
| Marked | 1 | ||||||
| Total | (25%) | (25%) | (25%) | (75%) | (100%) | (100%) | |
| Hypertrophy | Minimal | 1 | 1 | 1 | 2 | ||
| Slight | 1 | ||||||
| Moderate | 3 | 1 | |||||
| Marked | 2 | 4 | |||||
| Strong | 1 | ||||||
| Total | (13%) | (0%) | (13%) | (13%) | (88%) | (88%) | |
| Alveolitis | Minimal | 2 | 1 | ||||
| Slight | 4 | 2 | |||||
| Moderate | 3 | 1 | |||||
| Marked | 1 | 3 | |||||
| Strong | 3 | 1 | |||||
| Total | (0%) | (0%) | (0%) | (75%) | (100%) | (88%) | |
| Exudate | Minimal | 2 | 2 | ||||
| Slight | 2 | 2 | |||||
| Moderate | 1 | 1 | |||||
| Marked | 1 | ||||||
| Strong | 1 | ||||||
| Total | (0%) | (0%) | (0%) | (0%) | (100%) | (63%) | |
aEight mice per group were inoculated with medium (mock) or B. pertussis.
bHematoxylin/eosin-stained slides were examined for peribronchiolitis, alveolitis, perivasculitis, hypertrophy of mucus-producing glands, and free protein (exudate). Lung lesions were scored semiquantitatively as absent (not included in table), minimal, slight, moderate, marked, or strong.
cTotal percentage of animals with at least minimal scoring in the specified category
Expression profiling
Gene-expression profiles were determined in at least five animals per group. The three mock-inoculated groups, euthanized at days 1, 3, and 5, were statistically indistinguishable (i.e., there were no genes with FDR < 0.6). Of the approximately 22,000 genes tested, 1,841 genes were significantly differentially expressed in B. pertussis-inoculated lungs (FDR < 0.05, corresponding to P < 0.0042). Expression levels of all 1,841 genes as well as comparisons to other studies are presented in the supplementary data Table 5.
Hierarchical clustering showed time-dependent changes in gene expression with 1,182 upregulated genes and 659 downregulated genes. Of these genes, 439 were more than twofold upregulated, and 134 were more than twofold repressed. All genes followed a similar trend in time. One day postinoculation differential gene expression was already observed, but the effect was larger on days 3 and 5 postinoculation (Fig. 1). There was no identifiable subset of genes that displayed a different kinetic trend in gene expression.
Fig. 1.
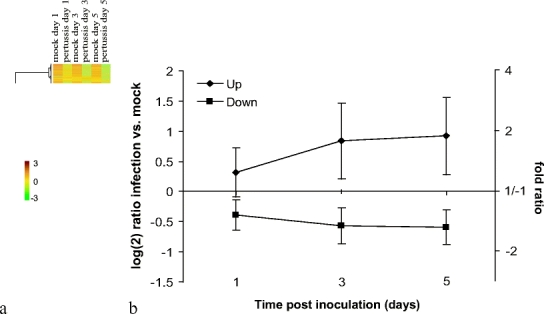
Presentation of microarray data from mock- and B. pertussis-inoculated mice. Analysis was performed on 1,841 genes whose expression was found to be significant at an FDR < 0.05. a Hierarchical clustering shows the segmentation of the genes clustered by gene expression. Relatively increased gene expression is presented in red, while relatively decreased gene expression is presented in green. The color scale shows log(2) ratios of gene expression levels compared to the global average. b Course of B. pertussis-regulated gene expression; diamonds represent the average of 1,182 upregulated genes, and squares represent the average of 659 downregulated genes. Error bars show the standard deviation (SD) of the average gene expression
To assign functions to differentially expressed genes, we classified them according to GO categories. In addition, we determined enrichment for GO categories to identify pathophysiological processes involved in response to B. pertussis. The most important GO categories, i.e., with the highest percentage differentially expressed genes, are summarized in Table 2. Most upregulated genes are involved in immune response-related processes, such as the acute phase response, antigen presentation, cytokine activity, inflammation, and apoptosis; whereas downregulated genes are involved in nonimmune processes, such as development, muscle contraction, cytoskeleton, and general processes like metabolism.
Table 2.
Classification of genes induced upon B. pertussis infectiona
| Up | Downb | Total on array P valuec | ||||
|---|---|---|---|---|---|---|
| Acute-phase responsed | 12 | (55%) | 0 | (0%) | 22 | 2.4 × 10⁻⁷ (up) |
| Antigen presentation | 21 | (66%) | 0 | (0%) | 32 | 7.7 × 10⁻¹⁵ (up) |
| Apoptosis | 47 | (15%) | 6 | (2%) | 324 | 8.0 × 10⁻⁵ (up) |
| Cell cycle | 43 | (8%) | 22 | (4%) | 510 | 4.3 × 10⁻¹ (up) |
| Chemokine activity | 21 | (58%) | 0 | (0%) | 36 | 1.2 × 10⁻¹³ (up) |
| Complement activation | 8 | (26%) | 1 | (3%) | 31 | 9.7 × 10⁻³ (up) |
| Cytokine activity | 48 | (25%) | 6 | (3%) | 192 | 7.8 × 10⁻¹³ (up) |
| Cytoskeleton | 31 | (6%) | 40 | (8%) | 531 | 2.0 × 10⁻³ (down) |
| Development | 96 | (7%) | 94 | (7%) | 1,433 | 9.8 × 10⁻¹ (down) |
| Immune response | 162 | (40%) | 3 | (1%) | 408 | 6.3 × 10−75 (up) |
| Inflammatory response | 46 | (38%) | 2 | (2%) | 121 | 1.1 × 10⁻¹⁹ (up) |
| Metabolism | 353 | (7%) | 220 | (5%) | 4,771 | 1.8 × 10⁻¹ (down) |
| Muscle contraction | 0 | (0%) | 12 | (24%) | 49 | 6.7 × 10⁻⁶ (down) |
| Listed in any of the above | 576 | (9%) | 318 | (5%) | 6,574 | |
| Other | 328 | (6%) | 204 | (4%) | 5,639 | |
| Unannotated | 278 | (3%) | 137 | (1%) | 9,744 | |
| Total | 1,182 | (5%) | 659 | (3%) | 21,957 | |
aClassification according to gene-ontology (GO) categories
bAnalysis was performed on 1,841 regulated genes.
cEase score for GO category enrichment in the specified set of genes
dSome genes are classified into multiple categories.
To reveal intergene relationships, we performed MetaCore™ analysis on the 1,841 regulated genes in addition to the GO-based analysis presented above. The most significant pathways are presented in Table 3. This analysis revealed the significance of several pathways, such as regulation of granulocyte function, the toll-like receptor (TLR) signaling pathway, the classic complement pathway, and apoptosis.
Table 3.
Pathway analysis of genes induced upon B. pertussis infection
| Name of Pathway involveda | Main process | P value | No. of genes in pathway | ||
|---|---|---|---|---|---|
| Expressed | Total | ||||
| Transcription regulation of granulocyte development | Immune response | 0.000001925 | 17 | (38%) | 45 |
| TLR ligands and common TLR signalling pathway | Immune response | 0.00001814 | 16 | (34%) | 47 |
| ECM remodeling | Metabolism | 0.00003906 | 18 | (30%) | 60 |
| Role of IAP proteins in apoptosis | Apoptosis | 0.00005458 | 13 | (36%) | 36 |
| HETE and HPETE diosynthesis and metabolism | Metabolism | 0.0003249 | 13 | (31%) | 42 |
| TPO signaling via JAK-STAT pathway | Cell cycle | 0.0003893 | 9 | (39%) | 23 |
| Leukotriene 4 biosynthesis and metabolism | Metabolism | 0.0004655 | 16 | (27%) | 60 |
| RhoA regulation pathway (extension, GEFs/GAPs) | Immune response | 0.002412 | 10 | (29%) | 34 |
| MIF in innate immunity response | Immune response | 0.002435 | 14 | (25%) | 57 |
| Retinol metabolism | Metabolism | 0.002842 | 12 | (26%) | 46 |
| Classic complement pathway | Complement activation | 0.002842 | 12 | (26%) | 46 |
| Putative erythropoietin signaling pathway (part 1) | Immune response | 0.002905 | 13 | (25%) | 52 |
| MAPK cascade | Cell cycle | 0.004975 | 12 | (24%) | 49 |
| Ceramide-dependent NO antiapoptotic action | Apoptosis | 0.006738 | 13 | (23%) | 57 |
| IL9 signaling pathway | Cytokine activity | 0.006809 | 9 | (27%) | 33 |
| Ephrins signaling | Other | 0.007847 | 13 | (22%) | 58 |
| Polyamine metabolism | Metabolism | 0.008731 | 7 | (30%) | 23 |
| Integrin outside-in signaling | Cell cycle | 0.009444 | 16 | (20%) | 79 |
| Chemokines and adhesion | Chemokine activity | 0.009657 | 34 | (16%) | 209 |
Analysis was performed on 1,841 genes whose expression was found to be significant at an FDR < 0.05. The list is presented by descending P values. P values represent the probability of particular mapping arising by chance given the numbers of genes in all Metacore pathways, genes involved in the specified pathway, and genes regulated upon B. pertussis inoculation.
ECM Extracellular matrix, GAP GTPase-accelerating protein, GEF guanine nucleotide exchange factor, HPETE hydroperoxyeicosatetraenoic acid, HETE hydroxyeicosatetraenoic acid, IAP inhibitor of apoptosis, IL9 interleukin 9, JAK Janus tyrosine kinase, MIF macrophage migration inhibitory factor, MAPK mitogen-activated protein kinase, NO nitric oxide, RhoA ras homolog gene family member A, STAT signal transducers and activators of transcription
aClassification according to main gene-ontology (GO) categories
Genes located in Bps-1 that were differentially regulated upon B. pertussis inoculation and their function according to the GO database are presented in Table 4. Bps-1 contains 185 genes, of which nine were differentially expressed. The strongest upregulated genes in this locus were tryptophanyl-tRNA synthetase (Wars, fourfold) and tumor necrosis factor alpha-induced protein 2 (Tnfaip2, 5.4-fold). Zinc finger FYVE domain containing 21 (Zfyve21, 1.5-fold) and kinesin family member 26A (Kif26a, 1.7-fold) were the strongest downregulated genes.
Table 4.
Genes located in Bps-1 that are differentially regulated upon B. pertussis inoculation
| GenBank accession | Gene symbol | Locationa | Fold ratio change | P value | Description | Pathwayb | ||
|---|---|---|---|---|---|---|---|---|
| Day 1 | Day 3 | Day 5 | ||||||
| NM_011705 | Vrk1 | 106 | 1.29 | 1.52 | 1.41 | 0.00003 | Vaccinia-related kinase 1 | Protein kinase activity |
| NM_011710 | Wars | 109 | 1.95 | 3.58 | 4.01 | 0.00000 | Tryptophanyl-tRNA synthetase | Aminoacyl-tRNA ligase activity |
| NM_010480 | Hspca | 111 | −1.14 | 1.40 | 1.27 | 0.00064 | Heat shock protein 1, alpha | Protein folding |
| NM_009396 | Tnfaip2 | 112 | 1.43 | 4.48 | 5.40 | 0.00000 | Tumor necrosis factor, alpha-induced protein 2 | Angiogenesis |
| XM_138272 | Gm266 | 112 | −1.08 | −1.25 | −1.35 | 0.00110 | Gene model 266, (NCBI) | G-protein coupled receptor activity |
| NM_026752 | Zfyve21 | 112 | −1.33 | −1.41 | −1.50 | 0.00001 | Zinc finger, FYVE domain containing 21 | Zinc ion binding |
| XM_138275 | Kif26a | 113 | −1.32 | −1.68 | −1.73 | 0.00030 | Kinesin family member 26A | Microtubule motor activity |
| NM_178911 | Pld4 | 113 | 1.21 | 1.82 | 2.52 | 0.00000 | Phospholipase D family, member 4 | Catalytic activity |
| XM_619046 | LOC434166 | 113 | 1.13 | 1.42 | 1.42 | 0.00141 | Similar to hypothetical protein MGC37588 | Unknown |
aBps-1 is located on chromosome 12; location is presented as distance from centromere (Mb).
bClassification according to gene-ontology (GO) categories
Genes located in Bps-2 and -3 that were differentially regulated upon B. pertussis inoculation are presented in Supplementary data Table 6. Bps-2 is located on chromosome 5 and contains 262 genes, of which 13 were differentially expressed. Interleukin-6 (IL-6) was the strongest upregulated gene (4.7-fold) in this locus, and general transcription factor IIIC, polypeptide 2, beta was the strongest downregulated gene (twofold) in this locus. Bps-3 is located on chromosome 11 and contains 922 genes, of which 62 were differentially expressed. Chemokine (C–C motif) ligand 8 was the strongest upregulated gene (15.3-fold) in this locus, and RIKEN cDNA 9530033F24 gene was the strongest downregulated gene (2.3-fold) in this locus.
Discussion
We have recently shown that genetic differences of the host play an important role in the restriction of colonization and/or clearance of B. pertussis from the lungs of mice (Banus et al. 2005, 2006). In the present study, we wanted to extend the understanding of the host response to B. pertussis and identify genes and pathways that play a role in the pathophysiological response to B. pertussis infection. In particular, we were interested in identifying candidate genes that could explain genetic differences in the course of B. pertussis infection, assuming that such genes are differentially regulated upon infection. For these purposes, we studied the time course of mRNA-expression in the lungs of mice after a B. pertussis infection by microarray analysis. We were especially interested if genes, located in the Bps-1, 2, and 3 loci, were differentially expressed after B. pertussis infection or that the susceptibility conferred by these loci was regulated alternately.
Of the approximately 22,000 genes investigated, we found 1,841 (8.4%) genes to be significantly differentially expressed. Differential gene expression was already observed on day 1 postinoculation, but the maximum effect was observed on day 3 postinoculation. This effect remained constant till at least day 5 postinoculation. The observed course in gene expression after B. pertussis inoculation was similar to that induced by another gram-negative lung pathogen, Francisella tularensis (Andersson et al. 2006).In a study of expression profiles in the lungs of F. tularensis-infected C57BL/6 mice, 424 (2.3%) genes out of the 18,500 genes investigated were upregulated. Genes involved in immune responses were activated strongly on day 4 postinoculation but hardly or not at all on days 1 and 2 (Andersson et al. 2006).
As expected, most upregulated genes are involved in immune and inflammation-related processes, such as antigen presentation, complement, cytokine, and chemokine activity. Other processes involved include the acute phase response and metabolism. Most downregulated genes are involved in nonimmune processes, such as metabolism, development, cell cycle, or muscle contraction. We speculate that by downregulating these genes, the energy balance is shifted in favor of the immune response. Evidently, cellular influx in the lungs is likely to influence the gene-expression profile.
Our data provide more detailed information on the central role of PMNs in the pathogenesis of B. pertussis infection. Pathogenesis of B. pertussis infection is characterized by colonization and proliferation of the ciliated mucosal cells resulting in damage of the respiratory epithelium and an acute increase in the levels of inflammatory cytokines resulting in cellular infiltrate in the alveolar spaces (Mattoo and Cherry 2005; Mills 2001; Preston 2005). Circulating PMNs are rapidly recruited to the lungs to bind and ingest B. pertussis, subsequently killing the bacteria by a combination of reactive oxygen and granule components. Finally, the PMNs undergo apoptosis (Kobayashi et al. 2005a). TLR ligands such as lipopolysaccharides (LPS) are critical components for the recruitment and priming of PMNs. Serum antibody-mediated clearance of B. pertussis also requires a TLR-induced early recruitment of PMNs. However, pertussis toxin limits this rapid serum antibody-mediated clearance by inhibiting PMN recruitment (Kirimanjeswara et al. 2005). As determined by pathway analysis in this study, the most significant pathways involved in the response to B. pertussis infection are regulation of PMN function, TLR signaling pathway, extracellular matrix remodeling, and apoptosis. It has been described that apoptosis of PMNs, in which TLR2 plays an important role (Jablonska et al. 2006), is accelerated after phagocytosis of bacteria (Kobayashi et al. 2005a, b). Therefore, the involvement of three out of four pathways may, at least partly, be explained by the influx of PMNs. Our data thus further illustrate the central role of PMNs in the course of B. pertussis infection and the involved mechanisms in PMN function.
We found the response to B. pertussis to be wide and complex. Some remarkable findings were the involvement of mucin genes, intracellular pathogen resistance gene, and the excessive upregulation of serum amyloid A (SAA) genes. We found the mucin (Muc) genes Muc4 and Muc5b to be significantly upregulated. Expression of mucin in the respiratory tract is one important innate host defense mechanism that respiratory pathogens must overcome (Belcher et al. 2000). Muc4, which encodes a respiratory tract mucin glycoprotein, was expressed 3.3-fold at day 5 upon B. pertussis inoculation. Muc5b, which encodes mucin 5, subtype B protein, in tracheobronchial epithelial cells, was expressed 1.8-fold 3 days upon inoculation. Belcher et al. (2000) described that B. pertussis induces mucin gene transcription by BEAS-2B cells. Evidently, gene expression studies do not allow to define the functional role of regulated genes. Further studies should define whether the mucin response is favorable to the host, the pathogen, or both.
In our study, we found a threefold upregulation of the intracellular pathogen resistance gene 1 (Ipr1). Ipr1 mediates innate immunity to mycobacterium tuberculosis (Pan et al. 2005). Pan et al. (2005) speculated that the Ipr1 gene product might function in integrating signals generated by intracellular pathogens with mechanisms controlling innate immunity, cell death, and pathogenesis. Our data therefore suggest that Ipr1 may be involved in intracellular presence of B. pertussis. Interestingly, B. pertussis was shown to survive intracellularly in macrophages, PMNs and bronchoalveolar lavage (BAL) cells of mice (Hellwig et al. 1999; Mills 2001).
Among the upregulated genes upon B. pertussis inoculation, SAA genes were upregulated to a remarkably high extent. SAA is an acute phase protein whose expression is markedly upregulated during inflammation and infection (Uhlar and Whitehead 1999). Among other functions, this protein plays an important role in high density lipoprotein cholesterol metabolism by promoting cellular cholesterol efflux through a number of different efflux pathways (van der Westhuyzen et al. 2005). In our study, SAA1, 2, and 3 were induced 14-, 54-, and 44-fold, respectively, after B. pertussis infection, again underlining the important role for the acute phase response after B. pertussis infection. Although strongly upregulated, it is clear that the acute-phase response is not specific for B. pertussis infection.
In a previous study, we observed a 1.5-fold upregulation of the membrane-receptor Tlr4 and a fivefold upregulation of the downstream cytokine gene Tnf-α 3 days post-B. pertussis inoculation by means of quantitative real-time polymerase chain reaction (PCR). Thus, a slight upregulation (1.5-fold) of this receptor induces a more pronounced (fivefold) induction of this downstream proinflammatory cytokine (Banus et al. 2006). In the present study, we obtained similar results by using microarray analysis. Tlr4 expression was increased 1.6-fold, while the expression of Tnfaip was increased 4.5-fold 3 days postinoculation. The results of the present study hereby confirm our previous observations. In a recent study, a high correlation between gene-expression values determined by quantitative real-time PCR and microarray was observed (Canales et al. 2006). Given these results and our observations, we conclude that the results, at least for the two given genes, are similar for both techniques.
It is very likely that the expression profile to B. pertussis is partly unique to B. pertussis and partly nonspecific. To examine the specificity of B. pertussis-regulated gene expression, we compared our data to other studies. In a recent review by Jenner and Young (2005), a comparison was made between published transcriptional profiling data from 32 studies that involved 77 different host–pathogen interactions. A set of 417 genes that comprise a common host transcriptional response was defined. We found that 122 genes affected by B. pertussis infection were listed in this common host–pathogen response, further illustrating that many genes regulated by B. pertussis are indeed not specific for B. pertussis infection but are involved in a common response to pathogens. One explanation for the broad response in expression profiles is the complexity of the bacterium. It is, for instance, known that LPS is a very potent immune stimulus, which induces a strong inflammatory response (Kawai et al. 2001; Qin et al. 2005; Wells et al. 2003). Transcriptional profiling of LPS-induced acute lung injury in mice resulted in 71 immune-related upregulated genes (Jeyaseelan et al. 2004). Of these 71 genes, 43 were also regulated upon B. pertussis inoculation in this study.
Previously, we have demonstrated that the Bps-1 locus has a dominant positive effect on the clearance of B. pertussis from the lung. Of the 185 genes in this locus, nine were differentially expressed. Some of these genes could explain the linkage of this locus with susceptibility to B. pertussis infection. Tumor necrosis factor, alpha-induced protein 2 (Tnfaip2), has been described as a tumor necrosis factor-alpha-inducible primary response gene in endothelial cells (Sarma et al. 1992). Aminoacyl-tRNA synthetases catalyze the aminoacylation of tRNA with their cognate amino acid. Tryptophanyl-tRNA synthetase (Wars) catalyzes the aminoacylation of tRNA(trp) with tryptophan and is induced by interferon (Ibba and Soll 2000).The role of the nine genes in the B. pertussis infection process is unknown and will be investigated in future experiments. Thus, by using a microarray approach, we selected nine possible candidate genes from the 185 present in Bps-1. However, by this approach, we focused on transcriptionally regulated genes, and the possibility remains that susceptibility to B. pertussis is regulated in a different way, such as phosphorylation or protein binding.
In comparison to the Bps-1 region, the Bps-2 and -3 regions contain considerably more genes, namely, 262 and 922 genes, respectively, of which 13 and 62 were differentially expressed post-B. pertussis inoculation. Among these differentially expressed genes are several interesting candidate genes that may explain the linkage of these loci with susceptibility to B. pertussis infection. IL-6 was the most strongly induced gene in the Bps-2 region (4.7-fold). IL-6 is a proinflammatory cytokine that can be secreted by macrophages after Tlr4 activation (Akira and Takeda 2004). Among the genes differentially expressed in the Bps-3 region was a large group of chemokines, of which Chemokine (C–C motif) ligand 8 was the strongest upregulated gene (15.3-fold). Upon B. pertussis infection, this large group of chemokines is induced to promote immune cells to migrate to the site of infection. The role of the other B. pertussis-induced genes in these loci is still unknown and will be investigated in future experiments.
In conclusion, we found 1,841 genes in the lungs of mice that are differentially expressed after B. pertussis inoculation. Most upregulated genes are involved in immune and inflammation-related processes or in nonspecific processes. Most downregulated genes are involved in nonimmune processes. A substantial number of genes and pathways provide more detailed information on the central role of PMNs in the pathogenesis of B. pertussis. In particular, the transcriptional profiles indicate the significance of genes involved in TLR activation, the recruitment and activation of PMNs, and apoptosis.
Electronic supplementary material
Raw data as well as the detailed description of the experiment will be uploaded to the freely accessible online database ArrayExpress (
http://www.ebi.ac.uk/arrayexpress/
) upon acceptance of the manuscript. Expression levels of all 1,841 genes as well as comparisons to other studies are presented in the supplementary data Table
5
.
Gain of body weight after infection. Relative gain of body weight at different days postinoculation with medium (mock) or B. pertussis. Boxes represent the mean of the relative weights of B. pertussis infected mice; diamonds represent the mean of the relative weights of mock inoculated mice (GIF 10 kb).
Lung weight after infection. Relative lung weight of mice after infection with B. pertussis at several days postinoculation. Solid bars represent the mean relative weight of B. pertussis infected mice; grey bars represent the mean relative lung weight of mock inoculated mice (GIF 13 kb).
High resolution image file (EPS 680 kb).
All B. pertussis induced genes and overlapped with other studies. a1,841 genes induced upon B. pertussis inoculation whose expression was found to be significant at an FDR < 0.05, of which 1,395 had an FR higher then 1.5; bJenner and Young (2005); cPalmer et al. (2006) BMC Genomics; dB cells and following columns are subsets described by Palmer et al. (2006) (XLS 665 kb)
Genes located in Bps-1, -2, and -3 that are differentially regulated upon B. pertussis inoculation (XLS 25 kb)
Acknowledgment
The authors thank Eric Gremmer for help and technical assistance. We are grateful for the histotechnical assistance of Mrs. de Vlugt-van den Koedijk. Furthermore, we would like to thank all biotechnicians from our animal facility for facilitating and performing the animal experiment.
Footnotes
Electronic supplementary material
The online version of this article (doi:10.1007/s00251-007-0227-5) contains supplementary material, which is available to authorized users. Raw and normalized data of the experiment can be accessed at the online database ArrayExpress http://www.ebi.ac.uk/arrayexpress/
References
- Akira S, Takeda K (2004) Toll-like receptor signalling. Nat Rev Immunol 4:499–511 [DOI] [PubMed]
- Andersson H, Hartmanova B, Kuolee R, Ryden P, Conlan W, Chen W, Sjostedt A (2006) Transcriptional profiling of host responses in mouse lungs following aerosol infection with type A Francisella tularensis. J Med Microbiol 55:263–271 [DOI] [PubMed]
- Banus HA, van Kranen HJ, Mooi FR, Hoebee B, Nagelkerke NJ, Demant P, Kimman TG (2005) Genetic control of Bordetella pertussis infection: identification of susceptibility loci using recombinant congenic strains of mice. Infect Immun 73:741–747 [DOI] [PMC free article] [PubMed]
- Banus HA, Vandebriel RJ, de Ruiter H, Dormans JA, Nagelkerke NJ, Mooi FR, Hoebee B, van Kranen HJ, Kimman TG (2006) Host genetics of Bordetella pertussis infection in mice: significance of toll-like receptor 4 in genetic susceptibility and pathobiology. Infect Immun 74:2596–2605 [DOI] [PMC free article] [PubMed]
- Barends M, van Oosten M, De Rond CG, Dormans JA, Osterhaus AD, Neijens HJ, Kimman TG (2004) Timing of infection and prior immunization with respiratory syncytial virus (RSV) in RSV-enhanced allergic inflammation. J Infect Dis 189:1866–1872 [DOI] [PubMed]
- Belcher CE, Drenkow J, Kehoe B, Gingeras TR, McNamara N, Lemjabbar H, Basbaum C, Relman DA (2000) The transcriptional responses of respiratory epithelial cells to Bordetella pertussis reveal host defensive and pathogen counter-defensive strategies. Proc Natl Acad Sci USA 97:13847–13852 [DOI] [PMC free article] [PubMed]
- Benjamini Y, Hochberg Y (1995) Controlling the false discovery rate: a practical and powerful approach to multiple testing. J R Stat Soc B 57:288–300
- Benjamini Y, Drai D, Elmer G, Kafkafi N, Golani I (2001) Controlling the false discovery rate in behavior genetics research. Behav Brain Res 125:279–284 [DOI] [PubMed]
- Canales RD, Luo Y, Willey JC, Austermiller B, Barbacioru CC, Boysen C, Hunkapiller K, Jensen RV, Knight CR, Lee KY, Ma Y, Maqsodi B, Papallo A, Peters EH, Poulter K, Ruppel PL, Samaha RR, Shi L, Yang W, Zhang L, Goodsaid FM (2006) Evaluation of DNA microarray results with quantitative gene-expression platforms. Nat Biotechnol 24:1115–1122 [DOI] [PubMed]
- Crowcroft NS, Pebody RG (2006) Recent developments in pertussis. Lancet 367:1926–1936 [DOI] [PubMed]
- de Greeff SC, Schellekens JF, Mooi FR, de Melker HE (2003) Pertussis in The Netherlands, 2001–2002. RIVM Reports 2003:1–59
- de Greeff SC, Schellekens JF, Mooi FR, de Melker HE (2005) Effect of vaccination against pertussis on the incidence of pertussis in The Netherlands, 1996–2003. Ned Tijdschr Geneeskd 149:937–943 [PubMed]
- Dennis G Jr, Sherman BT, Hosack DA, Yang J, Gao W, Lane HC, Lempicki RA (2003) DAVID: database for annotation, visualization, and integrated discovery. Genome Biol 4:3 [DOI] [PubMed]
- Hellwig SM, Hazenbos WL, van de Winkel JG, Mooi FR (1999) Evidence for an intracellular niche for Bordetella pertussis in broncho-alveolar lavage cells of mice. FEMS Immunol Med Microbiol 26:203–207 [DOI] [PubMed]
- Higgins SC, Lavelle EC, McCann C, Keogh B, McNeela E, Byrne P, O’Gorman B, Jarnicki A, McGuirk P, Mills KH (2003) Toll-like receptor 4-mediated innate IL-10 activates antigen-specific regulatory T cells and confers resistance to Bordetella pertussis by inhibiting inflammatory pathology. J Immunol 171:3119–3127 [DOI] [PubMed]
- Hosack DA, Dennis G Jr, Sherman BT, Lane HC, Lempicki RA (2003) Identifying biological themes within lists of genes with EASE. Genome Biol 4:R70 [DOI] [PMC free article] [PubMed]
- Ibba M, Soll D (2000) Aminoacyl-tRNA synthesis. Annu Rev Biochem 69:617–650 [DOI] [PubMed]
- Jablonska E, Marcinczyk M, Jablonski J (2006) Toll-like receptors types 2 and 6 and the apoptotic process in human neutrophils. Arch Immunol Ther Exp (Warsz) [DOI] [PubMed]
- Jenner RG, Young RA (2005) Insights into host responses against pathogens from transcriptional profiling. Nat Rev Microbiol 3:281–294 [DOI] [PubMed]
- Jeyaseelan S, Chu HW, Young SK, Worthen GS (2004) Transcriptional profiling of lipopolysaccharide-induced acute lung injury. Infect Immun 72:7247–7256 [DOI] [PMC free article] [PubMed]
- Kawai T, Takeuchi O, Fujita T, Inoue J, Muhlradt PF, Sato S, Hoshino K, Akira S (2001) Lipopolysaccharide stimulates the MyD88-independent pathway and results in activation of IFN-regulatory factor 3 and the expression of a subset of lipopolysaccharide-inducible genes. J Immunol 167:5887–5894 [DOI] [PubMed]
- Kimman T (2001) Genetics of infectious disease susceptibility. Kluwer, Dordrecht, The Netherlands (ISBN:0-7923-7155-0)
- King AJ, Berbers G, van Oirschot HF, Hoogerhout P, Knipping K, Mooi FR (2001) Role of the polymorphic region 1 of the Bordetella pertussis protein pertactin in immunity. Microbiology 147:2885–2895 [DOI] [PubMed]
- Kirimanjeswara GS, Agosto LM, Kennett MJ, Bjornstad ON, Harvill ET (2005) Pertussis toxin inhibits neutrophil recruitment to delay antibody-mediated clearance of Bordetella pertussis. J Clin Invest 115:3594–3601 [DOI] [PMC free article] [PubMed]
- Kobayashi SD, Voyich JM, Burlak C, DeLeo FR (2005a) Neutrophils in the innate immune response. Arch Immunol Ther Exp (Warsz) 53:505–517 [PubMed]
- Kobayashi SD, Voyich JM, Whitney AR, DeLeo FR (2005b) Spontaneous neutrophil apoptosis and regulation of cell survival by granulocyte macrophage-colony stimulating factor. J Leukoc Biol 78:1408–1418 [DOI] [PubMed]
- Mahon BP, Sheahan BJ, Griffin F, Murphy G, Mills KH (1997) Atypical disease after Bordetella pertussis respiratory infection of mice with targeted disruptions of interferon-gamma receptor or immunoglobulin mu chain genes. J Exp Med 186:1843–1851 [DOI] [PMC free article] [PubMed]
- Mann PB, Kennett MJ, Harvill ET (2004) Toll-like receptor 4 is critical to innate host defense in a murine model of Bordetellosis. J Infect Dis 189:833–836 [DOI] [PubMed]
- Mann PB, Wolfe D, Latz E, Golenbock D, Preston A, Harvill ET (2005) Comparative toll-like receptor 4-mediated innate host defense to Bordetella infection. Infect Immun 73:8144–8152 [DOI] [PMC free article] [PubMed]
- Mattoo S, Cherry JD (2005) Molecular pathogenesis, epidemiology, and clinical manifestations of respiratory infections due to Bordetella pertussis and other Bordetella subspecies. Clin Microbiol Rev 18:326–382 [DOI] [PMC free article] [PubMed]
- Mills KH (2001) Immunity to Bordetella pertussis. Microbes Infect 3:655–677 [DOI] [PubMed]
- National Institutes of Health (1996) Revised guide for the care and use of laboratory animals. NIH GUIDE 25. National Academy, Washington DC
- Pan H, Yan BS, Rojas M, Shebzukhov YV, Zhou H, Kobzik L, Higgins DE, Daly MJ, Bloom BR, Kramnik I (2005) Ipr1 gene mediates innate immunity to tuberculosis. Nature 434:767–772 [DOI] [PMC free article] [PubMed]
- Pennings JLA, Heisterkamp SH (2004) Normal probability plots for microarray experiments. In: Proceedings of the 12th International Conference on Intelligent Systems for Molecular Biology and the 3rd European Conference on Computational Biology 143, Abstract
- Preston A (2005) Bordetella pertussis: the intersection of genomics and pathobiology. CMAJ 173:55–62 [DOI] [PMC free article] [PubMed]
- Qin H, Wilson CA, Lee SJ, Zhao X, Benveniste EN (2005) LPS induces CD40 gene expression through the activation of NF-{kappa}B and STAT-1{alpha} in macrophages and microglia. Blood 106: 3114–3122 [DOI] [PMC free article] [PubMed]
- R Development Core Team (2005) R: a language and environment for statistical computing. R Foundation for Statistical Computing, Vienna, Austria (ISBN 3-900051-07-0)
- Sarma V, Wolf FW, Marks RM, Shows TB, Dixit VM (1992) Cloning of a novel tumor necrosis factor-alpha-inducible primary response gene that is differentially expressed in development and capillary tube-like formation in vitro. J Immunol 148:3302–3312 [PubMed]
- Smyth GK, Speed T (2003) Normalization of cDNA microarray data. Methods 31:265–273 [DOI] [PubMed]
- Uhlar CM, Whitehead AS (1999) Serum amyloid A, the major vertebrate acute-phase reactant. Eur J Biochem 265:501–523 [DOI] [PubMed]
- van der Westhuyzen DR, Cai L, de Beer MC, de Beer FC (2005) Serum amyloid A promotes cholesterol efflux mediated by scavenger receptor B-I. J Biol Chem 280:35890–35895 [DOI] [PubMed]
- Verwey WF, Thiele EH, Sage DN, Suchardt LT (1949) A simplified liquid culture medium for the growth of Haemophilus pertussis. J Bacteriol 58:127–134 [PMC free article] [PubMed]
- Wells CA, Ravasi T, Faulkner GJ, Carninci P, Okazaki Y, Hayashizaki Y, Sweet M, Wainwright BJ, Hume DA (2003) Genetic control of the innate immune response. BMC Immunol 4:5 [DOI] [PMC free article] [PubMed]
- Willems RJ, Kamerbeek J, Geuijen CA, Top J, Gielen H, Gaastra W, Mooi FR (1998) The efficacy of a whole cell pertussis vaccine and fimbriae against Bordetella pertussis and Bordetella parapertussis infections in a respiratory mouse model. Vaccine 16:410–416 [DOI] [PubMed]
Associated Data
This section collects any data citations, data availability statements, or supplementary materials included in this article.
Supplementary Materials
Raw data as well as the detailed description of the experiment will be uploaded to the freely accessible online database ArrayExpress (
http://www.ebi.ac.uk/arrayexpress/
) upon acceptance of the manuscript. Expression levels of all 1,841 genes as well as comparisons to other studies are presented in the supplementary data Table
5
.
Gain of body weight after infection. Relative gain of body weight at different days postinoculation with medium (mock) or B. pertussis. Boxes represent the mean of the relative weights of B. pertussis infected mice; diamonds represent the mean of the relative weights of mock inoculated mice (GIF 10 kb).
Lung weight after infection. Relative lung weight of mice after infection with B. pertussis at several days postinoculation. Solid bars represent the mean relative weight of B. pertussis infected mice; grey bars represent the mean relative lung weight of mock inoculated mice (GIF 13 kb).
High resolution image file (EPS 680 kb).
All B. pertussis induced genes and overlapped with other studies. a1,841 genes induced upon B. pertussis inoculation whose expression was found to be significant at an FDR < 0.05, of which 1,395 had an FR higher then 1.5; bJenner and Young (2005); cPalmer et al. (2006) BMC Genomics; dB cells and following columns are subsets described by Palmer et al. (2006) (XLS 665 kb)
Genes located in Bps-1, -2, and -3 that are differentially regulated upon B. pertussis inoculation (XLS 25 kb)