Abstract
We investigated the effect of the number of oxyethylene groups (polymer molecular weight) and the interchain binding and/or entanglements of methoxy-terminated-poly(ethylene glycol) (m-PEG) brushes on their ability to adsorb to living malignant melanoma B16F10 cells. We used the atomic force microscope colloid probe method to determine the adhering ability of the m-PEG brushes to the cells, as the magnitude of the adhesion force between the m-PEG modified particles and the living cells in a physiological buffer was related to the binding strength of the m-PEGs to the cells. We saw that m-PEG brushes (average molecular weights 330, 1900, and 5000 g/mol), which were chemically attached to silica particles, may bind to living B16F10 cells. The binding of m-PEGs to living B16F10 cells increased as the oxyethylene chain length of the m-PEGs increased, if the m-PEGs had a low degree of entanglements or little inter-m-PEG chain binding. A high degree of entanglements or interchain binding decreased the ability of an m-PEG chain to bind to a living cell. The effect of m-PEG (molecular weight 1900 g/mol) being present at cell surfaces for 24 h was also seen not to induce the death of the cells or affect their growth.
INTRODUCTION
Poly(ethylene glycol) (PEG) is widely used in the drug delivery system (DDS) to improve the delivery of the DDS nanoparticles to the required cells. PEGs are used for many reasons, with one being their low toxicity to cells (1). Another reason is that PEGs bind relatively little with proteins (2), thereby enabling the long chain of the PEGs to protect the proteins and peptides in the DDS that are used to target the cells from reacting with other sites in the body (3). PEGs may also increase the chances of the DDS carriers to reach the desired cells (3), as the large molecular weight of the PEGs have been reported to increase the circulation time of the DDS carriers in the bloodstream (1,4). The way a PEG molecule interacts with a cell and the effects of the chemical and physical properties of a PEG chain itself are, however, still not well understood. Studies have shown that the ability of a particle modified with a protein bound PEG molecule to adhere to a cell surface depends on many parameters, such as the PEG chain-length (or alternatively molecular weight) (5–8), the density of adsorbed PEG chains (6), and the temperature of the system (7). If the PEG molecules themselves are able to bind to the cells, then the adhesion of the DDS carriers to the cells may also be increased by the PEG chains in the DDS carrier. The binding of such a PEG chain may then affect the cell growth and cause the PEGs to exhibit toxicity. The effect of the physical and chemical properties of the PEGs on their affinity to the cells and their toxicity therefore need to be investigated, to design an efficient and functioning DDS.
The chemical state of a PEG molecule, e.g., the number of oxyethylene (OE) groups in the PEG chain and the end-group of the bound PEG (e.g., OH or OCH3), may affect the binding of a PEG to a cell. Previous studies showed that the silanol surface groups of a silica particle bind to living B16F10 cells (9), where the van der Waals force or hydrogen binding was thought to be the main binding mechanism. Therefore, increasing the number of groups on the particle surface that may participate in hydrogen binding events, e.g., OE, should also increase the binding ability of the particle to a living B16F10 cell. PEGs that are often used in DDS usually have either a terminal hydroxy or methoxy group. The OH end group of a hydroxy-terminated PEG chain has been reported (10) to chemically react with proteins, whereas the OCH3 group of a methoxy-terminated PEG (m-PEG) does not appear to undergo a chemical reaction with proteins. As an OH-protein chemical reaction can be thought to be stronger than the force due to a van der Waals interaction and/or a single hydrogen bonding event (11), the effect of increasing the number of hydrogen-bonding groups in a PEG chain, i.e., OE, on the binding ability of the PEG to a cell can presumably be easiest seen using a OCH3 terminated PEG (m-PEG). Comparing the m-PEGs of various chain lengths with a particle modified with a methoxypropyl group will show the effect of the number of hydrogen-bonding OE groups on the binding ability of m-PEG to a living cell. This is because the methoxypropyl group is not a polymer, contains only one hydrogen-bonding group, and has the same terminal OCH3 group as the m-PEGs.
The physical state of the PEG molecules in a DDS particle, e.g., the overall degree of viscosity/flexibility or elasticity/stiffness of the PEG chains, may also affect the binding ability of the PEGs to a cell. The physical state of the PEGs has been reported to depend on their molecular weight, where higher molecular weight PEGs have been shown to give rise to more solid polymeric materials, due to the entanglements of the PEG chains (12), and the inter-PEG chain bonding formed by hydrogen bonding (13). However, it is still not clear how the physical states of the PEG chains affect the binding of PEGs to a cell. The OE groups of a rigid PEG brush would presumably be less accessible to the hydrogen-bonding forming groups of another surface, such as a cell, than those in a flexible PEG brush. In the case of a flexible brush, the PEG chains can be imagined to flex/bend as the modified particle is brought to hard (maximum) contact with the other surface, causing the number of OE groups of the PEG chains touching the cell surface to increase as the particle is brought to hard contact. In the case of a rigid PEG brush, presumably little if no OE groups would be able to contact the cell surface, because the OE groups of the PEG chains in a rigid brush would not be positioned on the surface or the interface of the PEG brush. The geometry of a chain in a stiff brush would also not change as the particle is brought to hard contact with the cell. The binding ability of a PEG chain in a flexible brush to a living cell can therefore be expected to be higher than that of a PEG chain in stiff brush. The effect of the entanglements/physical bonds between the m-PEG chains can be determined by using pure m-PEG monolayer modified particles and particles modified with a mixed monolayer of a short and a long-chained m-PEG. This is because the presence of short m-PEG chains between the long m-PEG chains would prevent/reduce the entanglements / physical bonds between the long m-PEG chains.
PEGs have generally been reported to be nontoxic to cells (1). However, this nontoxicity may be related to the fact that the PEGs used up to now have been reported not to bind to the proteins of cells (2). If the PEGs are shown to bind to living cells, then there is also a chance that the PEGs may also influence the growth of the cells. It is for this reason that we should also investigate how the growth of the cells is affected by the presence of PEGs that show a high affinity to the cells. This can be done by including m-PEG in the complete media solution of the cells needed to culture the cells, and then comparing the growth of the cells in the presence and absence of m-PEG.
In this study we used m-PEG silane coupling agents of three molecular weights (number average molecular weights of m-PEG: 330, 1900, and 5000 g/mol, giving surfaces later referred to as PEG6, PEG43, and PEG113, respectively) to chemically modify silica particles, giving pure and mixed m-PEG brushes. As a standard to determine the effect of the OE chain length of the m-PEGs on the m-PEG binding to a cell, we used a non-PEG surface that possessed surface methoxypropyl groups (surface referred to as PEG0), obtained using 3-methoxypropyltrimethoxysilane. We could then use the atomic force microscope (AFM) to directly measure the forces between the modified particles and the living B16F10 cells in a physiological buffer solution as a function of their separation distance. This allowed us to investigate the effect of the chain-length (number of OE groups) in an m-PEG brush, i.e., the chemical state of the m-PEGs, and additionally the effect of the stiffness of the m-PEG chains, i.e., the physical state of the m-PEGs, on the adsorbing abilities of the m-PEG brushes to living cells. In this experiment, we chose to use melanoma cells (mouse skin melanoma cells, B16F10 cells), as the melanoma cancer metastasizes widely and is therefore one of the most dangerous cancers (14). Using the results of this study, we could then propose the joint effect of the chemical and physical properties of the m-PEG chains to the binding abilities of m-PEGs to living melanoma cells. The effect of the m-PEG chains that could bind to a cell on the growth of the B16F10 cells was subsequently investigated by light microscopy.
EXPERIMENTAL
Materials
The non-m-PEG modified surface with a terminal OCH3 group (PEG0) was achieved using 3-methoxypropyltrimethoxysilane (Gelest, Morrisville, PA). Three m-PEG silane coupling agents of different molecular weights were also used in this experiment. The m-PEG silane-coupling agent with the lowest molecular weight was 2-(methoxy(polyethyleneoxy)propyl)trimethoxysilane (90%) (number average weight 330 g/mol), and was purchased from Gelest. The higher molecular weight m-PEG silane coupling agents were synthesized by the method reported earlier (15), using poly(ethylene glycol methyl ether) (m-PEG, average molecular weight 1900 and 5000 g/mol, reagent grade, Aldrich, Milwaukee, WI), dibutylin dilaurate (reagent grade, Tokyo Kasei, Tokyo, Japan), 3-isocyanatepropyltriethoxysilane(reagent grade, Tokyo Kasei), and Anhydrous THF (reagent grade, Wako Pure Chemicals, Osaka, Japan). These m-PEG silane-coupling agents enabled us to obtain surfaces with m-PEGs with 6–9, 43, and 113 OE groups, which we later refer to as PEG6, PEG43, and PEG113. The water used this experiment was distilled and deionized to give a conductance of 18.2 MΩ cm−1 and a total organic content of 5 ppm.
Preparation of probes
The modification of the silica particles with the above silane coupling agents and their surface characterization was reported in another study (16). Briefly, the silica particles (mass median diameter = 6.84 μm, Bangs Laboratories, Fishers, IN) were modified with the above silane coupling agents to give PEG0, and pure and mixed m-PEG monolayers by using the method of Ohno et al. (17). In the case of pure PEG0 and m-PEG monolayers, 20 μL of the silica particles in water dispersion was added to 3 mL of an ethanol (99.5% EtOH, highest purity) and ammonium mixture (12.6% EtOH, highest purity; 1 NH3; 28 wt %; Kishida Chemicals, Osaka, Japan) and was stirred for 2 h at 40°C. A solution consisting of 0.2 g of the silane coupling agent and 1 mL EtOH was then added dropwise, and allowed to stir for a minimum of 18 h at 40°C. The particles were then washed a minimum of three times in solvent by centrifugation and decantation. The final particles were subsequently dispersed in ethanol, and stored in a clean vessel. In the case of modifying silica particles with a mixed monolayer of 35 wt % PEG113 and 65 wt % PEG6, the same method as above was used, but methanol was used as the solvent instead of ethanol. This is because the lower solubility of PEG113 in ethanol compared to that of PEG6 caused a dominate adsorbance of PEG113 to silica, even when only 5 wt % of PEG113 was used. The use of methanol as the solvent appeared to give PEG6 and PEG113 similar solubilities.
The colloid probes of the above particles were prepared by evaporating the solvent from a small volume of the particles, and then attaching a single particle to a gold-plated Si-Ni4 cantilever (spring constant = 0.06 Nm−1, NP-S, Veeco NanoProbe Tips, Nihon Veeco KK, Osaka, Japan), which were cleaned by ethanol and water, by using an XYZ micromanipulator and an epoxy resin (rapid araldite, Vantico, Showa Polymer, Tokyo, Japan).
Cell cultivation and cell sample preparation for AFM measurements
The malignant cell line B16F10 (mouse skin cancer cells, kindly obtained from the laboratory of Prof. Fukumori of Kobe Gakuin University) was cultured in MEM medium (Eagle's MEM medium with kanamycin, without sodium bicarbonate, L-glutamine, Nissui Pharmaceutical, Tokyo, Japan), supplemented with L-glutamine (Nacalai Tesque, Kyoto, Japan) and fetal bovine serum (FBS, JRH Biosciences, Lenexa, KS). The medium was sterile filtered and the pH adjusted to 7.4 using sodium hydrogen carbonate (Nacalai Tesque). The subculture of these anchorage-dependent cells required the growth of the cells on a rigid surface and their stationary incubation. The cells needed to seed a new 75 cm2 culture flask (No. 3110-075×, Iwaki, Tokyo, Japan) were obtained by firstly washing the flask to subculture with a buffer solution (Dulbecco's phosphate-buffered saline—i.e., PBS—without calcium chloride or magnesium chloride; Gibco, Invitrogen, Tokyo, Japan). The cells were then removed from the substrate with Trypsin (Trypsin from Hog pancreas, Nacalai Tesque). A complete media solution (MEM solution containing FBS) was subsequently added to the cells plus Trypsin solution, giving a cell concentration of 5 × 10⁵ cell ml−1. This cell suspension was filled 2 mm high in either a cell culture flask or a cell culture dish (40-mm diameter, No. 3000-035×, Iwaki); the flask was used when the purpose was successive subculture and the dish for the AFM experiment samples. The samples were stored in an incubator, which maintained an atmosphere of 5.0% CO2 and a temperature of 37.0°C. This ensured the pH of the complete media solution was 7.4; this is the physiological pH.
The AFM culture dishes were kept in the incubator for 1 day, allowing a monolayer of cells to grow. The pH of the solution in the culture dish was maintained at 7.4 in the outside environment for several hours, i.e., the same pH as was obtained within the incubator, by removing the subculture complete media solution, washing with PBS, and then adding 1 mL L-15 (Leibovitz's L-15 Medium with L-glutamine, L-15, Gibco, Invitrogen). No FBS was contained in the L-15, eliminating the effect of those polymers on the experimental results.
Culture of cells on glass slides
Glass slides (Micro Slide Glass, Matsunami, Osaka, Japan) were cut as 1.5 × 1.5 cm2 squares and functionalized as in Preparation of Probes. The cells were then cultured on these slides as described above, with the difference that the substrates were placed inside the cell culture flasks and the cell solution subsequently added.
The adhesion ability of the dead cells on the modified substrates was investigated by killing the cells that were cultured in the way described above. Briefly, the glass substrates were washed with a buffer solution, dried for ∼15 min, washed with PBS, and then covered again with the complete media solution. Testing with Trypan blue (Nacalai Tesque), which causes dead cells to be stained blue, showed that the cells were indeed killed using this method.
Growth of B16F10 cells in the presence of PEG
A monolayer of B16F10 cells on a culture dish was grown in a complete media (CM) solution for 1 day, in the method described above. The CM solution was then removed, the cells washed with PBS, and a new culture medium containing PEG43 (20 mL regular culture medium plus 0.102 g 1900 g/mol poly(ethylene glycol methyl ether)) added to the cells. After allowing the cells to grow for a further 24 h, the CM with PEG43 solution was removed, the cells washed with PBS, and the CM without PEG43 was added.
Instrumental: atomic force microscope
An AFM (MFP-3D, Asylum Research, Santa Barbara, CA) was used to measure the surface forces between a cell and colloid probe in the L-15 solution as a function of their separation distance. The transparent, 40 mm cell culture dish was placed on the AFM stage (the x-y piezo). The cells, which were grown on the inside bottom of the culture dish, could be viewed by a light microscope, which was positioned below the AFM stage. The cantilever with the probe was fixed on the AFM head (the z-scanner), positioned to face the cells.
A method based on the technique of Ducker et al. (18) was used for the force measurements. Briefly, we measured the change in the deflection of the cantilever (Δx) as a function of the piezo displacement, using the differential intensity of the reflection of the laser beam off the cantilever onto a split photodiode. The force (F) was calculated using Hooke's law, F = kΔx, where k is the spring constant of the cantilever.
The force measurements were made by bringing the colloid probe cantilever in contact with the cell of interest at a scan rate of 0.4 μm s−1 (corresponding to a frequency of 0.05 Hz) and the minimum loading force needed to reach the cell surface and to give a compliance region. A comparison in the force curves obtained using higher scan rates showed that this frequency was low enough not to cause viscoelastic effects in the force curves. During this time, the compression force data was collected. Once in contact, the probe was left on the cell surface for 5 min. As shown earlier, this time was chosen so that the adhesions between a cell and a particle may increase with the time of contact between the probe and the cell (19). A shorter residence time, e.g., 1 min, resulted in quite small adhesion forces, whereas a residence time of 5 min allowed us to obtain larger adhesion forces. Although the magnitude of the adhesion forces changed with time, the relative intensities of the adhesion forces of the different particle surfaces did not change with the residence time. Therefore, this larger adhesion force allowed us to compare the adhesion differences between probe types more easily. Additionally, the approach of the colloid probe to the viscoelastic cell may have induced movement in the cell. Therefore, this residence time also ensured the cell surface was stationary before measuring the decompression force curves, thereby reducing or eliminating the risk of viscoelastic effects in the decompression force curves. After the residence time, the probe was moved away from the cell surface, and the data for the decompression force curve collected. However, the cell and probe did not always separate completely after the experiment, due to the strong adhesions between the probe and the cell. Additionally, the long contact time of the particle at the cell surface before measurement of the decompression force meant that the z-piezo may have experienced some drift. Thus, after the measurement of a decompression force curve, the probe was moved to another place and then immediately returned to its original position, to break any remaining bonds between the probe and cell. Another compression force curve was then measured, the baseline of which was used to define the zero force position for the decompression force curve.
The constant compliance region in the force curves was taken in the region just after the probe was in contact with the surface of a cell, where there was a linear relation between the measured separation distance and deflection distance (Δx) (20). In doing this, we presumed that the deflection of the cantilever was only due to the elastic deformation of the cell (21–23). Zero separation was subsequently characterized from the position of the onset of the linear compliance region in the force profile.
Throughout the AFM experiment, the cells were monitored with a light microscope. We could be sure that the forces between living cells were being measured, as we measured the forces of only the cells that adsorbed flat on the culture dish. We saw in a previous article that dead B16F10 cells did not adsorb on a substrate (9). The forces corresponding to each functionalized probe type were measured at the nucleus of at least 100 different cells (force data from a minimum of 10 different colloid probe cantilevers and 100 different cells). The forces were measured at the nucleus of the cell, as it was the highest position on the cell. Thus, the possibility of higher areas in the cell causing steric or other forces was then eliminated. The forces of only living cells were measured in this study, as the B16F10 cells lost their adhering ability to the substrate, when they died. A force study between a particle and a cell in a liquid medium, however, required that the cells adhered to the substrate.
RESULTS AND DISCUSSION
AFM adhesion force studies between living B16F10 cells and modified particles
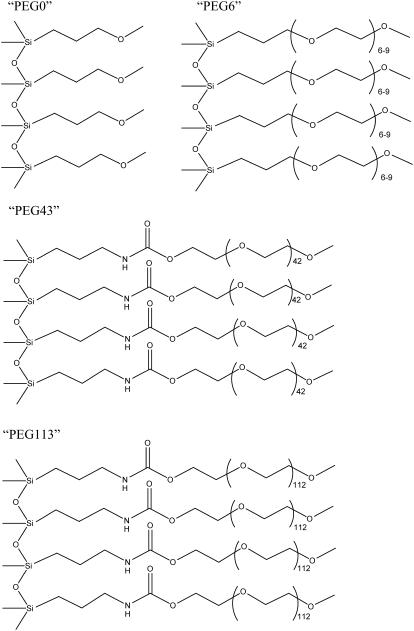
The effect of increasing the m-PEG chain length, i.e., the number of hydrogen-bonding groups, on the adhesion of m-PEG to a living B16F10 cell was investigated by firstly modifying silica particles with three m-PEG silane coupling agents of different chain-length, and comparing these results to a particle modified with a methoxypropyl group, i.e., a group that was not a polymer but had the same end group as the m-PEGs used here. Fig. 1 shows the structures of the resulting surfaces, when the methoxypropyl group was used and when m-PEGs with 6–9, 43, and 113 OE groups were used. Here, we chose to refer to these surfaces as PEG0, PEG6, PEG43, and PEG113, respectively. Although the PEG43 and PEG113 surfaces contained an amide coupling group in their m-PEG chains, the influence of this group on the binding to the cells was thought to be minimal or negligible. This is because the OE portion of the chains were much longer than the amide coupling group portion of the chain, making the position of the amide coupling group presumably too deep within the m-PEG brush to be able to contact the B16F10 cell and to make any significant affect on the adhesion to a B16F10 cell. The number of PEG6, PEG43, and PEG113 chains per nm2 of silica surface was approximated in a previous study to be 4.0 × 10⁻², 3.6 × 10⁻², and 3.3 × 10⁻², respectively (16), corresponding to a polymer brush (24). The silica particles were also verified to be modified with PEG0, PEG6, PEG43, and PEG113 by their uncharged surfaces, which were seen by the absence of an electrostatic force, when the AFM was used to measure the force between the modified particles and a silica wafer or mica substrate in water (figures not shown here). This is because the force between two unmodified silica surfaces or an unmodified silica surface and a mica surface in water (pH ∼5.6) is reported to be a strong, long-range force (25), due to the nonnegligible charge on the silica and mica surfaces under these conditions.
FIGURE 1.
Structure of the m-PEG modified silica surfaces.
A value of the adhesion between the modified particles and the living B16F10 cells could be obtained by measuring the forces between a modified particle and a living B16F10 cell in an L-15 buffer solution. As this physiological buffer solution had a high ionic strength (19), we did not see the electrostatic forces between the cell and the probes. Instead, we normally detected only steric and adhesion forces between the probe and cell. The value of the maximum adhesion force (Fadmax) in the decompression force curves gave a value for the adhesion between the particle and the cell, where a larger value indicated a larger adhesion. However, as the cells were living, each cell may have been in a different cycle and may have had a different numbers of receptors, etc., on its surface that may have affected the adhesion maximum. It was therefore necessary to measure the forces between a minimum of 100 different living cells for each particle type. Fitting a Lorentzian curve to the Fadmax data histogram gave the peak center (〈Fadmax〉), which indicated the average Fadmax.
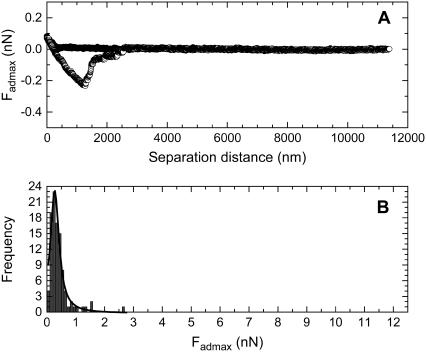
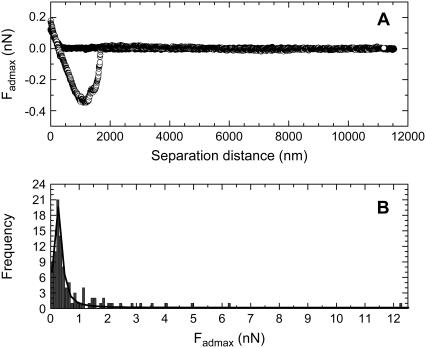
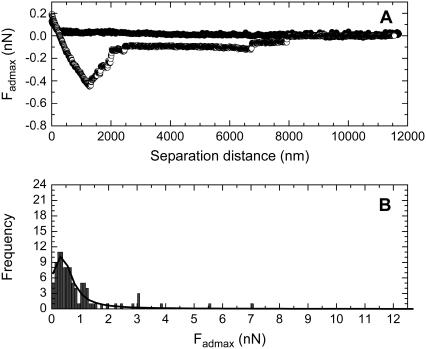
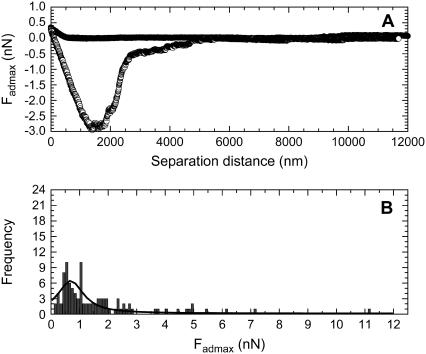
The force data measured between living B16F10 cells and silica particles modified with PEG0, PEG6, PEG43, and PEG113 are given in Figs. 2–5, respectively. Figs. 2 A, 3 A, 4 A, and 5 A show an example of a typical compression and decompression force for each respective particle type. In each case, the compression force curve (solid circles) showed no attraction or repulsion until the probe reached the cell surface. Further compression of the probe resulted in a repulsive force. This was presumably a steric/viscoelastic force resulting from the compression of the living cell, which is reported to be elastic (26). A long-ranged repulsive force would have suggested the particle did not reach the cell surface and an attraction would have suggested the particle entered the cell. During the residence time, the force between the cell and the particle did not appear to change, and the particle was not seen to enter the cell. These facts suggested that endocytosis of the particle was not occurring during this residence time. The decompression force curve (open circles) showed an adhesion force for each particle type, indicating that the each particle type could bind to living B16F10 cells. The main adhesion peak suggested that the adhesions were due to bonds between the cell and particle that were probably in parallel (27). It was thought that most of the contact points between the cell and silica probe were broken at this point. However, several smaller adhesions were also observed for each surface type at larger particle-cell separations. These may be the result of stronger bonds being broken, as a stronger bond would require a larger energy or a larger separation distance to be broken (27). Another possibility is that the smaller peaks may be tether points, due to the breaking of ligand-receptor or nonspecific bonds. These bonds may have reformed after being broken at Fadmax, as the cell and particle had not completely separated at this separation distance. Such a behavior has been noted by Leckband and Israelachvili (27). Alternatively, as the complete breaking of the bonds between the cells and particles required several thousand nm, there may have been considerable compliance of the cell during retraction, suggesting the progressive detachment of the adhesive contacts. The adhesions here were probably due to nonspecific bonds, resulting from a van der Waals and/or hydrogen-bonding force.
FIGURE 2.
The force curves measured between a PEG0 modified particle and living B16F10 cells, where (A) is a typical force curve and (B) is the histogram showing the frequency versus Fadmax data that was determined from the 100 force curves measured between PEG0 modified silica particles and 100 living cells.
FIGURE 5.
The force curves measured between a PEG113 modified particle and living B16F10 cells, where (A) is a typical force curve and (B) is the histogram showing the frequency versus Fadmax data that was determined from the 100 force curves measured between PEG113 modified silica particles and 100 living cells.
FIGURE 3.
The force curves measured between a PEG6 modified particle and living B16F10 cells, where (A) is a typical force curve and (B) is the histogram showing the frequency versus Fadmax data that was determined from the 100 force curves measured between PEG6 modified silica particles and 100 living cells.
FIGURE 4.
The force curves measured between a PEG43 modified particle and living B16F10 cells, where (A) is a typical force curve and (B) is the histogram showing the frequency versus Fadmax data that was determined from the 100 force curves measured between PEG43 modified silica particles and 100 living cells.
Figs. 2 B, 3 B, 4 B, and 5 B shows the histograms of the Fadmax values measured for the PEG0 modified, the PEG6 modified, the PEG43 modified, and the PEG113 modified particles, respectively, when the forces were measured with 100 different living B16F10 cells. The curve drawn as a solid line in the figures is the Lorentzian fitting to the Fadmax data. The center of the peak resulting from the fit is included in Table 1.
TABLE 1.
Molecular weights of PEG0 and the m-PEGs
| Surface of particle | Molecular weight of surface group (g/mol) | 〈Fadmax〉 (nN) |
|---|---|---|
| PEG0 | 73 | 0.27 ± 0.01 |
| PEG6 | 330 | 0.35 ± 0.02 |
| PEG43 | 1900 | 0.69 ± 0.04 |
| PEG113 | 5000 | 0.26 ± 0.01 |
| MixPEG | 330 and 5000 | 0.48 ± 0.05 |
The analyzed data is from the frequency versus Fadmax histograms of a pure PEG0 modified silica particle, a pure PEG6 modified silica particle, a pure PEG43 modified silica particle, a pure PEG113 modified silica particle, and a silica particle modified with a mixed monolayer of 65% PEG6 and 35% PEG113 (MixPEG). One-hundred force curves were measured using 100 different living B16F10 cells for each probe type. Here, 〈Fadmax〉 indicates the center of the Fadmax peak, obtained by fitting the histogram with a Lorentzian curve.
The effect of increasing the number of hydrogen-bondable groups, i.e., the effect of increasing the chain length of the m-PEGs, of the particle surface on their adhering ability to living B16F10 cells can be seen by looking at the 〈Fadmax〉 data for PEG0, PEG6, PEG43, and PEG113 in Table 1. We can see that the 〈Fadmax〉 increased with the m-PEG chain-length in the order of PEG0 < PEG6 < PEG43. This result was expected, as the number of OE groups and therefore hydrogen-bondable groups on the particle also increased in the order of PEG0 < PEG6 < PEG43. The deviation in the 〈Fadmax〉 was presumably due to the different number of mutant functional groups (e.g., oncogenes or tumor suppressor genes) in a cell that may bind with the particle, which may depend on the cell cycle or the development of the cancer (28) (stage of the cancer between benign and fully developed malignancy). Dori et al. (8) measured the adhesion and spreading of cells on substrates modified with bilayer membranes of PEG lipids. They noted that cells adhered and spread on the substrates with the PEG chains containing 2 and 17 OE groups. The cells adhered but did not spread for PEG chain-lengths with 45 OE groups, and the cells did not adhere for PEG chain-lengths of 113 OE groups. The authors suggested the adhesion to the PEG-lipid bilayers was via the lipids, as the chain-lengths of low molecular PEGs were shorter than the length of the lipid molecules. However, as our results show that 〈Fadmax〉 increased in the order of PEG0 < PEG6 < PEG43, the cell must also be capable of adsorbing to the m-PEG chains, and not only to the underlying silica surface of the probe. As previous studies (2) reported that PEGs do not bind to proteins, our m-PEGs may be binding to the negatively charged mucus network or glycocalyx on the cell surface (29) or other groups on the cell surface.
The effect of increasing the chain-length of m-PEG from PEG43 to PEG113 was seen from Table 1 to give the unexpected result that PEG113 bound significantly less to a living B16F10 cell than PEG43. PEG113 also surprisingly gave the same 〈Fadmax〉 value as the PEG0 modified particle, when the standard deviation was taken into account. This suggested that the same number of groups on the PEG113 modified surface were binding to a cell as those on a PEG0 modified surface. Previous studies have reported that the physical properties of PEGs change significantly, as the PEG chain length increases. Waggoner et al. (30) measured the self-diffusion coefficients (Do) of PEGs of several molecular weights in D2O at 25°C, from which we could determine that the Do of PEGs with 6–9, 43, and 113 repeat units decrease from 3.16 × 10⁻¹⁰, 1.26 × 10⁻¹⁰, and 5.31 × 10⁻¹¹ m2 s−1, respectively. This decrease in Do with the chain-length of PEG may be due to the presence of entanglements for the high molecular weight PEG and/or a physical binding between the PEG chains, which increases with the PEG chain-lengths. The onset of entanglement behavior for PEG melts has been reported (12) to occur at a critical polymer molecular weight of between 3200 and 4400 g/mol−1. This suggests the strong possibility that entanglements existed in the PEG113 modified probe, but not in the other probe types, i.e., PEG0, PEG6, or PEG43. The physical binding between the m-PEG chains are thought to result from the water intercalates that form hydrogen bonds between neighboring PEG chains (13). This causes harder polymer gels for PEGs with longer OE chains, as longer chains are capable of greater interchain hydrogen bonding. The lower adhering ability of the PEG113 modified particle compared to that of the PEG6 and PEG43 modified particle may therefore be due to the increased number of entanglements or physical bonds between the m-PEG molecules for the PEG113 modified particle. The presence of entanglements would decrease the number of free OE groups that may participate in hydrogen-bonding or other binding events with the molecules on the cell surface. Similarly, the presence of many interchain physical bonds would make the m-PEG chains stiff, and less likely to deform. Therefore, the end-terminated OCH3 group would be more likely to contact the cell surface, instead of the OE groups of the m-PEG chains. The fact that PEG113 and PEG0 gave the same 〈Fadmax〉 values strongly suggests that indeed only the end-terminated OCH3 group of PEG113 was able to bind with the cell, as the only hydrogen-bonding group that the PEG0 surface contained was a terminal OCH3 group.
We may test to see if the presence of entanglements or interchain bonding affects the adhesion force between an m-PEG modified particle and a living B16F10 cell by modifying a silica particle with a PEG113 monolayer of a lower graft density. Two ways of achieving this are 1), to use a much lower concentration of PEG113 in the silanization reaction; and 2), to make a mixed monolayer of PEG6 and PEG113. The former method varies both the graft density and the surface functional groups, i.e., the silanol groups from the nonmodified silica surface and the methoxy group from the chemically adsorbed PEG113. A low density of PEG113 would give more silanol groups than methoxy groups, while a high density of PEG113 would give more methoxy groups. The latter method varies the graft density, while allowing the surface functional group to be unchanged, i.e., methoxy. As the silanol group has been shown to bind to a cell (9) and as we wanted to determine the effect of only the graft density, i.e., the effect of entanglements or interchain physical bonds, we decided to use a mixed monolayer of PEG6 and PEG113.
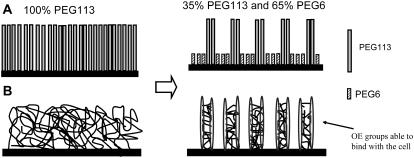
In a previous study (16), we saw that if we modified a silica surface with a mixed monolayer of PEG113 and PEG6, islands of chemically adsorbed PEG113 appeared between the chemically adsorbed PEG6 areas. As the concentration of PEG113 decreased, the size of these PEG113 islands decreased. The number of entanglements/physical interchain m-PEG bonds were also thought to decrease as the size of the PEG113 islands decreased; see Fig. 6 for a schematic diagram depicting this idea. We therefore chose to modify the silica particles with 35% PEG113 and 65% PEG6 (MixPEG). This was the lowest PEG113 concentration we found (16) to still give islands of PEG113 between PEG6. This concentration also gave force curves corresponding to surfaces that appeared to be more flexible than the higher PEG113 concentrated films.
FIGURE 6.
A schematic diagram depicting the effect of introducing PEG6 into a monolayer of PEG113 to give the mixed m-PEG monolayer of MixPEG, where (A) shows a molecular description of the monolayers, and (B) shows the imagined effect of the PEG6 molecules on the entanglements or PEG113 interchain adhesions.
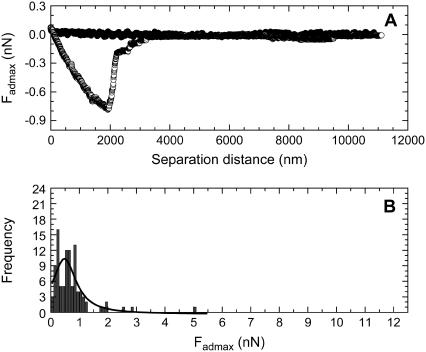
Fig. 7 A shows a typical compression and decompression force obtained between a silica particle modified with a MixPEG monolayer and living B16F10 cells. This compression force curve (solid circles) also showed no attraction or repulsion until the probe reached the cell surface. Further compression of the probe resulted in a repulsive steric/viscoelastic force, characteristic of the compression of a living cell that is elastic (26). The decompression force curve (open circles) showed an adhesion force with one major peak, suggesting the rupture of an adhesive junction containing many links in parallel (27). These adhesions may have been due to nonspecific bonds, resulting from a van der Waals or hydrogen-bonding force. Most of the contact points between the cell and silica probe appeared to break at the position of Fadmax. Fig. 7 B shows the histograms of the Fadmax values measured for the mixed m-PEG modified particles, when the forces were measured with 100 different living B16F10 cells. The curve drawn as a solid line in the figures is the Lorentzian fitting to the Fadmax data. The center and width of the peak resulting from the fit can also be found in Table 1.
FIGURE 7.
The force curves measured between particles, which were modified with MixPEG, and living B16F10 cells, where (A) is a typical force curve and (B) is the histogram showing the frequency versus Fadmax data that was determined from the 100 force curves measured between 100 living cells and silica particles modified with a mixed monolayer of 35% PEG113 and 65% PEG6.
If we compare the 〈Fadmax〉 in Table 1 obtained for the silica particles modified with a MixPEG monolayer to that obtained for particles modified with a pure (100%) PEG113 monolayer, we see that the value of 〈Fadmax〉 increased for the mixed monolayer case. The 〈Fadmax〉 value for the mixed monolayer case was also greater than that obtained for the pure (100%) PEG6 modified silica particle case. This showed that the increased 〈Fadmax〉 was due to the binding of the PEG113 chains to the cells and not due to the binding of the PEG6 chains. This increased 〈Fadmax〉 for the mixed monolayer indicated that a decrease in the number of inter-m-PEG chain bonds or entanglements increased the adhering ability of the PEG113 to the living B16F10 cells.
When a mixed monolayer of PEG6 and PEG113 was used, the PEG6 molecules may have acted as spacers between the PEG113 molecules. In this way, the OE groups of the outer PEG113 chains of the PEG113 islands may be oriented such that they may interact with the cell surface, either by penetration of the cell surface or by the bending/flexing of the PEG113 chains. A decrease in the number of PEG chains grouped together may make the PEG113 chains more flexible. This is because a decrease in the packing between the PEG chains from a close to a more sparse packing has been shown (31) to change the PEG rheology from an elastic gel forming material to a fluidlike material. The m-PEG chains of a more fluidlike material would be more flexible, and therefore may bend/deform when brought to another surface. This flexibility or penetration of the PEG113 chains may enable the OE groups to be positioned close enough to the cell surface and oriented in favorable geometries to allow hydrogen-bonding or attractive van der Waals forces to occur between the particle and the living B16F10 cell.
The above force data was obtained using a residence time of 5 min for the particle at the living cell surface. A shorter residence time of 1 min resulted in much smaller adhesion forces. Although the magnitude of the adhesion forces changed with time, the relative intensities of the adhesion forces of the different particle surfaces did not appear to change with the residence time.
Light microscopy study of the adhesion of living and dead B16F10 cells at PEG0 and m-PEG modified surfaces
Light microscopy may be used to verify the results seen in the AFM study. It may also be used to give information on the binding abilities of dead B16F10 cells to the modified surfaces. This information could not be obtained using the AFM, because the B16F10 cells lost their adhering abilities to the culture dishes used in the AFM experiments when they died. An AFM experiment that measures the forces between a particle and a cell in a liquid medium, however, requires the strong adhesion of the cells to the substrate.
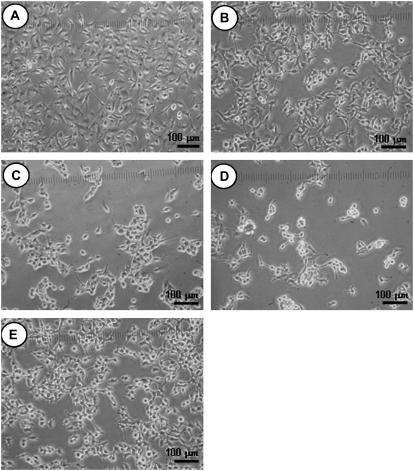
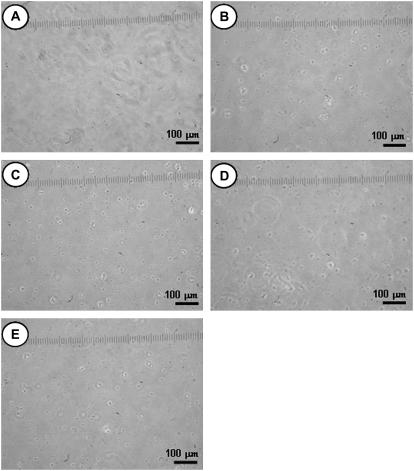
Glass substrates were functionalized using the silane coupling agents, giving PEG0, PEG6, PEG43, PEG113, and MixPEG surfaces. B16F10 cells were subsequently grown on these surfaces. The light microscope images of the PEG0, PEG6, PEG43, PEG113, and MixPEG surfaces in the presence of CM after 24 h of cell growth and after being washed with PBS are shown in Fig. 8, A–E, respectively. Cell growth could be seen on each surface, verifying our AFM results that adhesion to the living B16F10 cell was possible for each surface type. However, it was difficult to determine by light microscopy which surface showed the best affinity to the living B16F10 cell.
FIGURE 8.
Living B16F10 cells adsorbed on glass substrate modified to give (A) a PEG0 surface; (B) a PEG6 surface; (C) a PEG43 surface; (D) a PEG113 surface; and (E) a MixPEG surface. Here, the surfaces with the cells were washed with PBS and then covered with CM before the images were taken.
To see the adsorption ability of the dead B16F10 cells on the various modified surfaces, the surfaces in Fig. 8 with the B16F10 cells were dried, washed with PBS, and then covered with CM. This process caused the B16F10 cells to die. The light microscope images of the resulting PEG0, PEG6, PEG43, PEG113, and MixPEG surfaces are shown in Fig. 9, A–E, respectively. In each case, no cells were seen on each surface type. This result indicates that only living cells may adhere to m-PEG modified surfaces. Thus, the adhesions of the m-PEG modified surfaces to the B16F10 cells measured in the AFM section above must have been a property of the living cells.
FIGURE 9.
Dead B16F10 cells adsorbed on a glass substrate modified to give (A) a PEG0 surface; (B) a PEG6 surface; (C) a PEG43 surface; (D) a PEG113 surface; and (E) a MixPEG surface. Here, the surfaces with the living cells were washed with PBS, dried, washed with PBS, and then covered with CM, before the images were taken.
Effect of m-PEG on the B16F10 cell growth
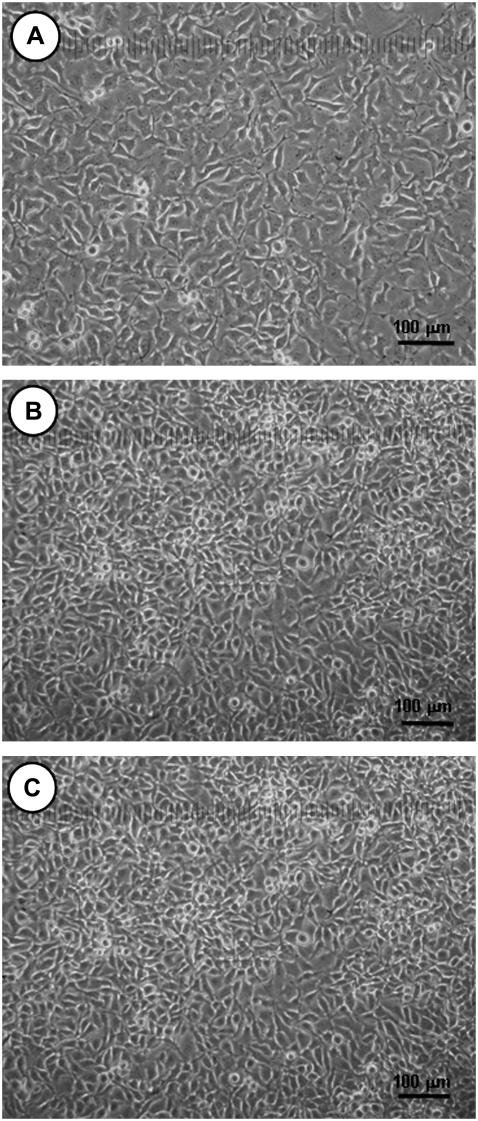
The AFM adhesion studies from above showed that PEG43 bound the strongest to living B16F10 cells. PEG43 may therefore also affect the B16F10 cells, causing them to die. The effect of the PEG43 molecules on the growth of the B16F10 cells was investigated by firstly growing a layer of living B16F10 cells on culture dishes; Fig. 10 A shows a light microscope image of one such dish. Fig. 10, B and C, show the B16F10 cells after growing for a further 24 h in normal CM, and the B16F10 cells after growing in a CM containing PEG 43, respectively. The cells shown in Fig. 10, B and C, were subsequently both washed with PBS, after which normal CM was added. If we compare Fig. 10 A to Fig. 10, B and C, we can see that the cells continued to grow to give multilayers of cells, regardless of the presence or absence of m-PEG. Additionally, if we compare the features of the cells in the absence and presence of m-PEG, we see that the cells have similar shapes and sizes in both cases. Unfortunately, we could not compare the effect of PEG43 on dead B16F10 cells, as the B16F10 cells lost their adhering ability to the culture dishes when the cells died. However, results from previous work (32) suggest that cells with less adhering abilities, e.g., B16F10 cells beginning to die, appear round in shape, while cells with high adhering abilities, e.g., live B16F10 cells, appear flat and elongated. Therefore, a decrease in the size of the cells or a rounder shape of the cells would have suggested the death of the cells. As we did not see a decrease in the cell size or a rounding of the cell shape when we added PEG43 in the CM for 24 h, we could conclude that PEG43 did not appear to affect the growth of the cells and did not induce their death, when judged by the light microscope.
FIGURE 10.
Light microscope images of (A) B16F10 cells grown in normal CM on a culture dish; (B) the B16F10 cells with PEG43 after growing a further 24 h. Here, the B16F10 cells were allowed to grow for 24 h in a CM with PEG43, and washed with PBS. Normal CM without PEG43 was then added and the photo taken. (C) The B16F10 cells without PEG43 after growing a further 24 h. Here, the B16F10 cells were allowed to grow for 24 h in normal CM, and washed with PBS. Normal CM without PEG43 was then added and the photo taken.
CONCLUSIONS
We have shown here that m-PEG brushes chemically adsorbed on a silica particle may bind to the surface of a living B16F10 cell. The binding of m-PEGs to living B16F10 cells increased with the OE chain length for m-PEGs with a low degree of entanglements or little inter-PEG chain binding. A high degree of entanglements or inter-PEG chain binding decreased the binding ability of an m-PEG to a living cell. Therefore, both the PEG chain length and degree of entanglements or inter-PEG chain binding should be considered when designing DDS carriers. The presence of PEG43 at cell surfaces for 24 h was also seen not to induce the death of the cells or effect their growth.
Acknowledgments
The authors thank Prof. Fukumori (Kobe Gakuin University) for kindly supplying the B16F10 cells necessary for the B16F10 cell-line and for invaluable discussions about the cells, Prof. Ichikawa (Kobe Gakuin University) for invaluable discussions about the cells, Dr. Yoichi Kanda (Kyoto University) for useful discussions about the force measurements of cells, and Mr. Junpei Tsujimura (Kyoto University) for preliminary force measurements of the cells with the m-PEG modified particles.
Cathy McNamee thanks the Japanese Government for the financial support provided through the Japan Society for the Promotion of Science Postdoctoral Fellowship For Foreign Researchers.
Editor: Stuart M. Lindsay.
References
- 1.Kaul, G., and M. Amiji. 2002. Long-circulating poly(ethylene glycol)-modified gelatin nanoparticles for intracellular delivery. Pharm. Res. 7:1061–1067. [DOI] [PubMed] [Google Scholar]
- 2.Lee, J. H., H. B. Lee, and J. D. Andrade. 1995. Blood compatibility of polyethylene oxide surfaces. Prog. Polym. Sci. 20:1043–1079. [Google Scholar]
- 3.Roberts, M. J., M. D. Bentley, and J. M. Harris. 2002. Chemistry for peptide and protein PEGylation. Adv. Drug Deliv. Rev. 54:459–476. [DOI] [PubMed] [Google Scholar]
- 4.Caliceti, P., and F. M. Veronese. 2003. Pharmacokinetic and biodistribution properties of poly(ethylene glycol)-protein conjugates. Adv. Drug Deliv. Rev. 55:1261–1277. [DOI] [PubMed] [Google Scholar]
- 5.Zhu, B., T. Eurell, R. Gunawan, and D. Leckband. 2001. Chain-length dependence of the protein and cell resistance of oligo(ethylene glycol)-terminated self assembled monolayers on gold. J. Biomed. Mater. Res. A. 3:406–416. [DOI] [PubMed] [Google Scholar]
- 6.Han, D. K., and J. A. Hubbell. 1997. Synthesis of polymer network scaffolds from L-lactide and poly(ethylene glycol) and their interaction with cells. Macromolecules. 30:6077–6083. [Google Scholar]
- 7.Efremova, N. V., S. R. Sheth, and D. E. Leckband. 2001. Protein-induced changes in poly(ethylene glycol) brushes: molecular weight and temperature dependence. Langmuir. 17:7628–7636. [Google Scholar]
- 8.Dori, Y., H. Bianco-Peled, S. K. Satija, G. B. Fields, J. B. McCarthy, and M. Tirrell. 2000. Ligand accessibility as means to control cell response to bioactive bilayer membranes. J. Biomed. Mater. Res. A. 1:75–81. [DOI] [PubMed] [Google Scholar]
- 9.McNamee, C. E., N. Pyo, and K. Higashitani. 2006. Atomic force microscopy study of the specific adhesion between a colloid particle and a living melanoma cell: effect of the charge and the hydrophobicity of the particle surface. Biophys. J. 91:1960–1969. [DOI] [PMC free article] [PubMed] [Google Scholar]
- 10.Davies, F. F. 2002. The origin of pegnology. Adv. Drug Deliv. Rev. 54:457–458. [DOI] [PubMed] [Google Scholar]
- 11.Israelachvili, J. 1994. Intermolecular and Surface Forces. Academic Press, London, UK.
- 12.Walkenhorst, R., J. C. Selser, and G. Piet. 1998. Long-ranged relaxations in poly(ethylene oxide) melts: evidence for network behavior. J. Chem. Phys. 109:11043–11050. [Google Scholar]
- 13.Coffman, J. P., and C. A. Naumann. 2002. Molecular weight dependence of viscoelastic properties in two-dimensional physical polymer networks: amphiphilic lipopolymer monolayers at the air-water interface. Macromolecules. 35:1835–1839. [Google Scholar]
- 14.Alberts, A., A. Johnson, J. Lewis, M. Raff, K. Roberts, and P. Walter. 2002. Molecular Biology of The Cell. Garland Science, New York.
- 15.Jo, S., and K. Park. 2000. Surface modification using silanated poly(ethylene glycol)s. Biomaterials. 21:605–616. [DOI] [PubMed] [Google Scholar]
- 16.McNamee, C. E., S. Yamamoto, and K. Higashitani. 2007. Preparation and characterization of pure and mixed monolayers of poly(ethylene-glycol) brushes chemically adsorbed to silica surfaces. Langmuir. In press. [DOI] [PubMed]
- 17.Ohno, K., T. Morinaga, K. Koh, Y. Tsujii, and T. Fukuda. 2005. Synthesis of monodisperse silica particles coated with well-defined, high-density polymer brushes by surface-initiated atom transfer radical polymerization. Macromolecules. 38:2137–2142. [Google Scholar]
- 18.Ducker, W. A., T. J. Senden, and R. M. Pashley. 1991. Direct measurement of colloidal forces using an atomic force microscope. Nature. 353:239–241. [Google Scholar]
- 19.McNamee, C. E., N. Pyo, S. Tanaka, I. U. Vakarelski, Y. Kanda, and K. Higashitani. 2006. Parameters affecting the adhesion strength between a living cell and a colloid probe when measured by the atomic force microscope. Colloid Surf. B. 48:176–182. [DOI] [PubMed] [Google Scholar]
- 20.Velegol, S. B., and B. E. Logan. 2002. Contributions of bacterial surface polymers, electrostatics, and cell elasticity to the shape of AFM force curves. Langmuir. 18:5256–5262. [Google Scholar]
- 21.Razatos, A., Y. L. Ong, M. M. Sharma, and G. Georgiou. 1998. Molecular determinants of bacterial adhesion monitored by atomic force microscopy. Proc. Natl. Acad. Sci. USA. 95:11059–11064. [DOI] [PMC free article] [PubMed] [Google Scholar]
- 22.Camesano, T. A., and B. E. Logan. 2000. Probing bacterial electrosteric interactions using atomic force microscopy. Environ. Sci. Technol. 34:3354–3362. [Google Scholar]
- 23.Ong, Y. L., A. Razatos, G. Georgiou, and M. M. Sharma. 1999. Adhesion forces between E. coli bacteria and biomaterial surfaces. Langmuir. 15:2719–2725. [Google Scholar]
- 24.Tsujii, Y., K. Ohno, S. Yamamoto, K. Goto, and T. Fukuda. 2006. Structure and properties of high-density polymer brushes prepared by surface-initiated living radical polymerization. Adv. Polym. Sci. 197:1–45. [Google Scholar]
- 25.Hartley, P. G., I. Larson, and P. J. Scales. 1997. Electrokinetic and direct force measurements between silica and mica surfaces in dilute electrolyte solutions. Langmuir. 13:2207–2214. [Google Scholar]
- 26.Radmacher, M. 2002. Measuring the elastic properties of living cells by the atomic force microscope. In Methods in Cell Biology. B. P. Jena and J. K. H. Hörber, editors. Academic Press, Amsterdam, The Netherlands. [DOI] [PubMed]
- 27.Leckband, D., and J. Israelachvili. 2001. Intermolecular forces in biology. Q. Rev. Biophys. 32:105–267. [DOI] [PubMed] [Google Scholar]
- 28.Vogt, P. K. 1993. Cancer genes. West. J. Med. 158:273–278. [PMC free article] [PubMed] [Google Scholar]
- 29.Leung, S. H. S., and J. R. Robinson, Jr. 1991. Bioadhesive drug delivery. ACS Symp. Ser. 467:350–366. [Google Scholar]
- 30.Waggoner, R. A., F. D. Blum, and J. C. Lang. 1995. Diffusion in aqueous solutions of poly(ethylene glycol) at low concentrations. Macromolecules. 28:2658–2664. [Google Scholar]
- 31.Naumann, C. A., C. F. Brooks, G. G. Fuller, W. Knoll, and C. W. Frank. 1999. Viscoelastic properties of lipopolymers at the air-water interface: a combined interfacial stress rheometer and film balance study. Langmuir. 15:7752–7761. [Google Scholar]
- 32.Pyo, N., C. E. McNamee, S. Tanaka, I. U. Vakarelski, Y. Kanda, and K. Higashitani. 2006. Effect of the cell type and cell density on the binding of living cells to a silica particle: an atomic force microscope study. Colloid Surf. B. 53:278–287. [DOI] [PubMed] [Google Scholar]


