

Abstract
This study reports the influence of halogens on fluorescence properties of the Aequorea victoria Green Fluorescent Protein variant S65T/T203Y (E2GFP). Halide binding forms a specific nonfluorescent complex generating a substantial drop of the fluorescence via static quenching. Spectroscopic analysis under different solution conditions reveals high halogen affinity, which is strongly dependent on the pH. This evidences the presence in E2GFP of interacting binding sites for halide ions and for protons. Thermodynamic link and cooperative interaction are assessed demonstrating that binding of one halide ion is associated with the binding of one proton in a cooperative fashion with the formation, in the pH range 4.5–10, of a single fully protonated E2GFP·halogen complex. To resolve the structural determinants of E2GFP sensitivity to halogens, high-resolution crystallographic structures were obtained for the halide-free and I−, Br−, and Cl− bound E2GFP. Remarkably the first high-resolution (1.4 Å) crystallographic structure of a chloride-bound GFP is reported. The chloride ion occupies a specific and unique binding pocket in direct contact (3.4 Å) with the chromophore imidazolidinone aromatic ring. Unanticipated flexibility, strongly modulated by halide ion interactions, is observed in the region surrounding the chromophore. Furthermore molecular dynamics simulations identified E222 residue (along with the chromophore Y66 residue) being in the protonated state when E2GFP·halogen complex is formed. The impact of these results on high-sensitivity biosensor design will be discussed.
INTRODUCTION
The green fluorescent protein (GFP) of the Aequorea victoria jellyfish has emerged as a unique fluorescent molecule with a vast impact on biological studies thanks to its genetically encoded fluorescence. The chromophore is located at the center of a cylinder-shaped three-dimensional structure and consists of the Y66 phenol-type ring and a five-membered heterocyclic ring, which is formed by the cyclization of the internal tri-peptide S65-Y66-G67 and the subsequent 1,2-dehydrogenation of Y66. As disclosed by x-ray structural data (1,2), polar and aromatic groups together with a few water molecules enclosing the chromophore establish a characteristic hydrogen-bond network that strongly influences the GFP photophysical properties. In recent years, it has been widely demonstrated that fluorescent proteins with new spectroscopic properties can be generated by mutating amino acids in either the chromophore or in its surroundings (3–6). Improvements in biological aspects such as faster expression, better folding efficiency, or altered pKa (7–9) were obtained by single-site mutations in GFP. For a rational design of mutants with specific properties, a detailed understanding of the chromophore interaction with its surrounding is necessary (10).
One of the most widely used GFP-derived fluorescent labels is enhanced green fluorescent protein (EGFP-GenBank Accession No. U76561). Referring to the UniProtKB/Swiss-Prot (11) entry P42212 as wild-type GFP, it is mainly characterized by the single-site F64L and S65T mutations along with the commonly unstated V2 insertion and H231L substitution.
In the present work, we consider the single-site mutation T203Y in EGFP leading to E2GFP. E2GFP and other T203Y mutants were originally investigated for their photoswitching properties (12–15) but exhibit other interesting properties such as a strong dependence of their fluorescence properties on pH and halides (16–18) that motivated us to further investigate the impact of this substitution in GFP. The T203Y mutation is a landmark of all the Yellow GFP mutants (YFP) that also carry the S65G, V68L, and S72A mutations. Several YFP variants were developed to monitor chloride or iodide ions concentration in living cells (19,20). Conversely, in fluorescence resonance energy transfer (FRET) imaging and biological-labeling applications efforts were made to reduce YFP environmental sensitivity (21).
In the present work, we focus on the halide-dependence of E2GFP photophysics. We shall demonstrate through x-ray and spectroscopic analysis that E2GFP holds a specific halide-binding site that leads to a static quenching of the fluorescence. Furthermore, our absorption- and fluorescence-spectroscopy study reveals a strong pH-dependence of halide-binding affinity.
This study provides useful guidelines for the design of improved Cl− sensitive GFP-based indicators thanks to the better understanding of the structural relationship with respect to halide sensitivity. Interestingly, contrary to the vast majority of halide-sensitive probes based on dynamic fluorescence quenching (22,23), the present approach would lead to a static-quenching based sensing. Furthermore, the E2GFP chromophore pKa value, peaked around physiological pH, represents a stimulating hallmark in developing combined halide/pH sensors for monitoring in living specimens.
MATERIALS AND METHODS
Expression and purification of recombinant GFP mutants
Site-directed mutagenesis on E2GFP (S65T/T203Y) (24) and EGFP (S56T/−) genes was carried out in pPR-IBA2 (IBA, Goettingen, Germany) to obtain E1GFP (−/T203Y) and E0GFP (−/−), respectively. To this end we used overlap extension polymerase chain reaction with two mutant oligonucleotides [upstream: 5′-ACC ACC CTG TCC TAC GGC GTG-3′; downstream: 5′-CAC GCC GTA GGA CAG GGT GGT-3′] and two flanking primers [BsaI (upstream): 5′-ATG GTA GGT CTC AGC GCC GTG AGC AAG GGC GAG GAG CTG-3′; BsaI (downstream): 5′-ATG GTA GGT CTC ATA TCA CTT GTA CAG CTC GTC CAT GCC G-3′].
For crystallography, E2GFP was subcloned into a pET151/D-TOPO (Invitrogen, Pero, Italy) vector, containing a TEV protease cleavage site.
Recombinant GFP mutants were expressed in E. coli BL21 (DE3) strain (Invitrogen). The maximum yield was obtained harvesting 20 h after induction with isopropyl-β-D-galactoside at 30°C, as determined by sodium dodecyl sulfate-polyacrylamide gel electrophoresis (SDS-PAGE) on the total lysate. Proteins that carried the biotin mimic peptide MASWSHPQFEKGA were purified to homogeneity by affinity chromatography (strepTactin, IBA) following manufacturer instructions.
E2GFP samples for x-ray analysis, carrying a polyhistidine tag, immediately after lysis were applied to a HiTrap Chelating HP cartridge (GE Healthcare, Milan, Italy) loaded with NiSO4 and subsequently, equilibrated in buffer A (50 mM Tris-HCl pH 8.0, 150 mM NaCl) and eluted with a linear gradient going from 0 to 500 mM imidazole in 20 column volume. The eluted peak was exchanged in buffer A2 (50 mM diethanolamine, DEA, pH 8.5, 100 mM NaCl) and then digested overnight at 21°C with AcTEV (Invitrogen) and addition of 1 mM dithiothreitol, 0.5 mM EDTA. Although SDS-PAGE analysis indicated a complete cleavage of the polyhistidine tag, the digested sample was applied once more to the nickel cartridge (equilibrated with buffer A2) to remove any residual undigested fraction.
For all protein samples, a final purification step was carried out by anion exchange (ResourceQ, GE Healthcare) using a linear gradient with 10 column-volumes duration from 0 to 250 mM Na2SO4 in 20 mM DEA pH 8.5. The whole purification procedure was carried out at 4°C in a fast protein liquid chromatography system (AKTA Basic10, GE Healthcare) with continuous monitoring of optical densities at 280 nm and 410 nm.
GFP mutants were thus obtained at high concentration (∼15 mg/ml) in the halogen-free buffer P (20 mM DEA pH 8.5, 70 mM Na2SO4). Purity was >95% as judged by silver-stained SDS-PAGE gels and mass spectrometry analysis (data not shown). Concentration was determined by UV absorption measurements assuming the native protein extinction coefficient at 278 nm equal to: 27,180 M−1 cm−1 for E2GFP and E1GFP, and 26,000 M−1 cm−1 for E0GFP and EGFP (18,25).
Steady-state spectroscopic measurements
Fluorescence experiment was performed with a Cary Eclipse fluorometer (Varian, Palo Alto, CA). Fluorescence intensities were collected at a 90° angle in an L-format. Typically, 1.92 ml samples were used in a 4 ml quartz cuvette (10 × 10 × 45 mm; Hellma, Milan, Italy). The temperature of the cell compartment was controlled, usually at 20.0 ± 0.1°C, by a built-in Peltier cooler (Varian). The sample within the cuvette was stirred continuously using a cylindrical Teflon-coated stir-bar (Hellma). Excitation and emission band-pass of 5 nm was employed. Sample contribution to the absorbance over the entire spectral range was <0.05 OD, allowing us to safely neglect inner-filter effects. Integration time rate was typically 0.4 s/nm.
Absorption data were recorded at room temperature in a JASCO V550 spectrophotometer (JASCO Europe, Cremello, Italy) using 1 nm band-pass, 1 nm resolution, and 0.25 s integration time.
The pH was varied by using the following buffers: 50 mM acetic acid at pH 4.8–5.2; 5 mM citric acid, 50 mM K2HPO4 at pH 5.0–8.0; 20 mM DEA at pH 8.0–8.8 and 20 mM ethanolamine at pH 9.0–9.6.
Binding isotherm measurement and fit
Binding of GFP variants with halide ions or protons was investigated by means of variations in fluorescence or absorption spectra. All binding isotherms were collected at constant protein concentration, of ∼0.7 μM and 1.4 μM for fluorescence and absorption measurements respectively, titrating a halogen-free solution with a protein solution containing halogens (NaCl, KCl, MgCl2, KBr, KF, KI) at a concentration that ranged from 100 mM to 1 M and exceptionally to 4 M as indicated in the text. The ionic strength was kept constant at 1 M (exceptionally at 4 M) by the addition of Na2SO4.
It is worth noting that equilibrium is reached within few seconds as checked by repeated acquisition at delayed times in all binding reactions herein reported; and 2–3 spectra were collected and averaged for each point of the binding isotherms.
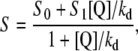
Difference spectra were produced taking the spectrum collected at 0 mM halide as reference. To use the information contained in the whole spectra singular value decomposition (SVD) analysis was performed on the fluorescence and absorbance difference spectra using Scilab 4.0 (26). This analysis always produced one significant singular value, which strongly suggests the presence of a simple 1:1 Langmuir binding model (see Results). Indeed all binding-isotherms (i.e., S versus [Q]) were nicely fitted with a simple 1:1 binding equation,
 |
(1) |
where kd is the dissociation constant, [Q] is the halogen concentration, and S0 and S1 are the binding-isotherm signal at zero and infinite halogen concentration, respectively. The signal (S) could be any of: the coefficient of the first basis vector derived by SVD, the fluorescence intensity, or absorbance value at a given wavelength. The free ligand concentration ([Q]) was always approximated with the total halide concentration since the protein concentration has always been kept much smaller than the dissociation constant values ([P] ≪ kd).
Curve fitting was performed using Origin 7.0 (OriginLab, Northampton, MA).
Fluorescence lifetime
A titanium-sapphire femtosecond laser beam (Mira 900F, Coherent, Milan, Italy), λexc = 475 ± 10 nm and 76 MHz, after passing through a frequency doubler (SHG 9300, Coherent, Italy) was directed to an additional light-inlet port of the scanning head of the SP2 AOBS confocal microscope (Leica Microsystems, Milan, Italy). Fluorescence decay was measured with a water immersion 63× (1.20 NA) objective (HCX PL APO CS, Leica Microsystems) at the external (X1) port with fast photon counting heads (H7422P-40, Hamamatsu, Milan, Italy) and time-correlated single photon counting electronics (SPC-830, Becker & Hickl, Berlin, Germany). The instrument response, measured from the Rayleigh scattering generated in colloidal silica solution (LUDOX CL, Sigma-Aldrich, Milan, Italy), was found to be at ∼140 ps FWHM and used for data analysis by iterative reconvolution and minimization algorithms. Data were collected at 500–540 nm by means of a band-pass filter (510AF23, Omega Optical, Brattleboro, VT) in the detection channel with protein concentration in the range 0.1–0.5 μM. Laser power was adjusted to give photon-counting rates of ∼104–105 cps.
X-ray crystallography
E2GFP crystals were grown at 20°C from 3 to 6 days, mixing 2 μl of protein solution (at 15 mg/ml concentration) with 2 μl well solution containing 10–14% (w/v) PEG3350, 100 mM NH4 acetate pH 5.0, and 0.2 M NH4F. At the ESRF beamline, ID14 EH1 crystals diffracted to 1.4 Å at 100 K with 20% (v/v) glycerol added for cryoprotection. E2GFP·Cl and E2GFP·Br complex crystals were obtained using PEG3350 as precipitant agent, 100 mM NH4 acetate pH 5.0, and 0.2 M NH4Cl or NH4Br. Before data collection, crystals were transferred to a drop of cryoprotectant solution (reservoir added with 20% v/v glycerol) containing 1 M NH4Cl or NH4Br. Crystals of E2GFP·Cl and E2GFP·Br complexes diffracted to 1.4 Å (ESFR beamline ID14 EH1), and 1.8 Å (ESFR beamline BM30A), respectively, at 100 K. Single-wavelength anomalous dispersion data were collected from the E2GFP·Br complex crystal, exploiting the fluorescence of the bounded Br− at the K absorption edge (13.478 keV). To obtain the E2GFP·I complex E2GFP crystals were washed in drop of reservoir solution without NH4F for removing the excess of fluorine, and transferred to a drop of cryoprotectant solution (reservoir added with 20% v/v glycerol) containing 1 M NH4I. The soaking time was <1 min. E2GFP·I complex x-ray data were collected in-house using a Nonius FR591 rotating anode x-ray generator (Bruker, Madison, WI) coupled to a Marresearch (Norderstedt, Germany) Imagine plate detector.
Data were processed using CCP4 programs (27). Molecular replacement was performed using MOLREP (27), with the structure of YFP (PDB code: 1YFP) as a model. Structures were refined using COOT (28) and REFMAC (27). Conformational torsion angle restraints and charged assignments for the chromophore were obtained using CCP4i Libcheck (27).
Halogen atoms were modeled, made anisotropic, and refined after most of the protein and solvent atoms were built and refined using isotropic thermal parameters. Considering chloride atoms anisotropic resulted in a drop of the R and Rfree factors, from 17.9% and 19.4%, to 17.7% and 18.3%, respectively. The inclusion of the anisotropic displacement parameters for bromide and iodine atoms did not lead to a significant gain in the R values, which were essentially unchanged. However, treating them anisotropically resulted in a significant improvement of the residual map. Position of chloride atoms were supported by conformational changes in proximity of the chromophore, environmental interactions, temperature factors, omit maps, and by position of bromide and iodine ions, which were unambiguously assigned using the anomalous signal of these anions at 0.918 Å (f″ = 5.8 e−) and 1.542 Å (f″ = 6.9 e−), respectively. Data collection and refined statistics are shown in Table 1.
TABLE 1.
Crystallographic data collection and refinement statistics
| Dataset | E2GFP | E2GFP·Cl | E2GFP·Br | E2GFP·I |
|---|---|---|---|---|
| Crystallization buffer pH | 5.0 | 5.0 | 5.0 | 5.0 |
| Data collection statistics | ||||
| Temperature (K) | 100 | 100 | 100 | 100 |
| Wavelength (Å) | 0.93100 | 0.93400 | 0.92020 | 1.54179 |
| Resolution (Å)* | 46.60–1.47 | 28.63–1.40 | 15.15–1.80 | 21.63–1.94 |
| (1.50–1.47) | (1.48–1.40) | (1.90–1.80) | (2.04–1.94) | |
| Total observations | 353,369 | 305,365 | 107,100 | 87,857 |
| Unique observations | 38,294 | 43,101 | 20,664 | 16,805 |
| Unit cell (Å)† | 51.1 62.9 69.6 | 51.0 63.0 69.4 | 51.1 62.9 69.2 | 51.1 62.9 69.1 |
| Completeness (%)* | 97.6 (97.6) | 96.8 (95.3) | 97.7 (95.2) | 98.1 (90.1) |
| Multiplicity* | 7.0 (4.5) | 7.1 (6.7) | 5.2 (5.0) | 5.2 (4.5) |
| Rmerge (%)*‡ | 7.0 (15.6) | 7.2 (39.0) | 8.5 (34.1) | 11.2 (39.1) |
| 〈I/σ(I)〉* | 15.6 (4.1) | 17.9 (3.9) | 16.4 (3.3) | 13.7 (3.1) |
| Refinement statistics | ||||
| Rfactor/Rfree (%)¶§ | 15.7/18.3 | 17.1/18.3 | 17.7/20.4 | 17.9/23.0 |
| RMS deviations | ||||
| Bond lengths (Å) | 0.009 | 0.010 | 0.015 | 0.017 |
| Bond angles (°) | 1.58 | 1.51 | 1.74 | 1.83 |
| Number of atoms | ||||
| Protein | 1886 | 1913 | 1877 | 1880 |
| Halide | — | 3 | 4 | 8 |
| Solvent | 237 | 212 | 160 | 156 |
| Average B-factor (Å2) | 11.31 | 15.51 | 17.67 | 22.79 |
Number in parentheses are for the highest resolution shell.
Space group P212121.
Rmerge = ∑khl ∑i|Ii − 〈I〉|/∑khl ∑i Ii.
Rfact = ∑khl|Fo (hkl) – Fc (hkl)|/∑khl|Fo (hkl)|.
Rfree was calculated based on 5% of the total data omitted during structure refinement.
MD simulations and modeling
We performed molecular dynamics simulations starting from the x-ray structure of the Cl-bound E2GFP. We used the AMBER94 force field (29) and the additional parameters for the GFP chromophore calculated previously (10). For other details of the simulations, we refer to the already published methodology (10). The volume of the halogen-binding cavity was calculated using VOIDOO software (30). Figures were obtained using PyMOL program (31).
Protein Data Bank accession numbers
Coordinates and structure factors have been deposited with the Protein Data Bank (32) using accession codes: 2H6V (E2GFP pH 5.0,100 K), 2O24 (E2GFP·Cl−), 2O29 (E2GFP·Br−), and 2O2B (E2GFP·I−).
RESULTS
Absorption spectra halide dependence and SVD analysis
EGFP is one of the most established GFP-based fluorescence labels for its brightness and strong stability to different environmental conditions. Interestingly, the introduction of the single T203Y substitution determines significant halogen sensitivity. Fig. 1 reports absorbance spectra in the absence and in the presence of 1 M NaCl for E2GFP and EGFP at nearly neutral pH. Upon chloride addition EGFP spectrum remains unaltered while E2GFP exhibits the almost complete depletion of the anionic-chromophore (R−) absorption band at 515 nm and a sizable 15 nm blue shift in the neutral (RH) absorption band whose full width at half-maximum shrinks from ∼76 to ∼71 nm. A similar blue shift was previously reported for the YFP-H148Q variant (20). The blue shift can be explained with the destabilization of the excited state dipole resulting from a decrease in the polarity of the chromophore environment. This decrease was linked to the presence of a chloride ion in the chromophore vicinity and was described as evidence of Cl− binding to the ground state. We further investigated the E2GFP absorbance changes induced by the presence of halogens at nine different pH values from 5.05 up to 9.15. Striking pH dependence was observed. Fig. 2, A and B, report E2GFP spectra at different chloride titration levels (0–1 M) for three representative pH values: 5.05, 7.05, and 8.9 (from left to right panels). Upon chloride addition, the neutral band is blue-shifted and the anionic band markedly depleted, when present. It is also worth noting that high chloride concentration spectra tend to have the same shape at all pH values. For comparison in Fig. 2 A, the E2GFP·Cl− complex spectrum obtained at pH 5.05 under chloride-saturating concentration (∼400 mM) is overlaid (gray dash-dot line) in the graph for all other pH values. Singular value decomposition (SVD) analysis (33) on the difference spectra (Fig. 2 B) produces only one significant singular value (at ∼10) for all nine pH values analyzed. The coefficients for the second most significant basis absorption difference spectra are scattered, confirming that the second basis vector is not significant above the noise (34), and the ratio between the second and the first singular values is <4% at all pH values. Absorbance changes are linked to the equilibrium between the two species (chloride-bound and free protein) and can be used to derive ligand-binding density. The derived binding isotherms are then well described by a simple 1:1 binding mechanism at all pH values as illustrated in Fig. 2 C (see Materials and Methods). SVD analysis was also applied to the complete representative data set (pH values: 5.05, 7.05, and 8.9). The first three singular values are 7.7, 4.9, and 0.4, and the corresponding basis vectors, weighted by their singular value, are plotted in Fig. 2 D. The third value is below the presumed data noise level and we consider only the first two to be significant, suggesting the presence of only three spectrally distinguishable species.
FIGURE 1.

Room-temperature (20°C) absorption spectra (normalized at 278 nm) of E2GFP (dark) and EGFP (shaded) in the absence (dashed line, open symbols) and in the presence (solid line, solid symbols) of 1 M NaCl at pH = 6.8.
FIGURE 2.

(A) E2GFP absorption spectra (normalized at 278 nm) at the three pH values: 5.05, 7.05, and 8.9 (from left to right) and increasing NaCl concentration (up to 1 M). Spectra at intermediate chloride concentration were omitted for graphical clarity. The spectrum collected at pH 5.05 and ∼400 mM NaCl is highlighted (shaded dash-dot line) in the left panel and overlaid (shaded dash-dot line) on the other two right panels. (B) Difference spectra corresponding to data of panel A. (C) Binding density derived from SVD analysis of the spectra reported in panel B. The solid lines show the fitting to the 1:1 binding model (Eq. 1) with fit parameter kd = 13.4 ± 0.2, 18.6 ± 0.8, and 478 ± 13 mM for pH = 5.05, 7.05, and 8.9, respectively. (D) First three basis difference spectra obtained by SVD analysis applied over all datasets reported in panel B. The first (solid), second (dash-dot), and third (shaded dash) basis vectors are weighted by the corresponding singular values: 7.7, 4.9, and 0.4.
Interestingly, in E2GFP affinity for Cl− at the physiological pH 7.5 is higher than in any other GFP/YFP variants carrying the T203Y substitution. Dissociation constant values are compiled in Table 2.
TABLE 2.
Dissociation constants measured at pH 7.5


Static chromophore-fluorescence quenching and halogen-binding isotherms
GFP and most of its mutants fluoresce in the same energy range when excited in either their neutral or anionic forms. Indeed phenols become more acidic upon electronic excitation (35); and therefore excited state proton transfer (ESPT) from the chromophore phenol to a proton-acceptor residue is the commonly accepted mechanism behind this phenomenology (36). E2GFP shows the same behavior with emission peak shifting from 510 to 523 nm with increasing pH in the range 5.0–9.0. Excitation spectra recorded with monitoring the emission at 523 nm are reported in Fig. 3 A at pH = 4.95, 7.05, and 9.3 (from left to right panel) for different Cl− concentrations. Fluorescence intensity drops off uniformly over the whole excitation spectra when chloride concentration is increased. Normalized fluorescence titration data derived at any combination of excitation and emission wavelengths superimpose nicely as shown in Fig. 3 B; and the simple 1:1 binding model (solid line) provides an excellent description of the data for all halogens and all pH values explored. Remarkably, fluorescence intensity at infinite halogen concentration goes asymptotically to zero within statistical uncertainty. Granted the formation of a specific halogen-GFP complex from absorbance data, this observation is indicative of the formation of a ground-state nonfluorescent complex as the physical origin of the observed luminescence quenching. To unambiguously verify that our data are governed by static quenching (37) we measured fluorescence decay time from the anionic excited state. Fluorescence decay data collected at pH values 7.4 and 9.4 in the absence and in the presence of 1 M chloride are respectively shown in the left and right panels of Fig. 3 C. They exhibit a single lifetime that is not influenced by the presence of chloride.
FIGURE 3.

(A) Fluorescence excitation spectra of E2GFP (normalized at 278 nm) collected with the emission wavelength set to 523 nm and at increasing chloride concentration (up to 1 M); and for three pH values: 4.95, 7.05, and 9.3 (from left to right). (B) Typical fluorescence isotherms obtained by integrating either the whole excitation spectra (270–515 nm) (solid circles) or the emission peak (495–540 nm) (open squares) after excitation at 274 nm (pH = 5.2 ± 0.05 and temperature 20°C). The solid line was obtained by data fitting to 1:1 binding Eq. 1 with kd = 15.4 ± 0.2 mM, F0 = 0.981 ± 0.002, and F1 = 0.005 ± 0.003. (C) Fluorescence decay time traces after excitation at 475 nm for E2GFP at pH values 7.4 and 9.4 in the absence (left-handed panel) and in the presence (right-handed panel) of 1 M NaCl. Single exponential decay fit (solid lines) give, at pH 7.4, τ = 3.24 ± 0.05 and 3.33 ± 0.05 ns in the absence and in the presence of chloride, respectively; and at pH 9.4, τ = 3.59 ± 0.04 and 3.64 ± 0.04 ns. Experimental conditions are described in Materials and Methods.
We also exclude any possible cation effect on the halogen·E2GFP interaction because fluorescence isotherms collected at pH values 5.2 and 7.9 using KCl, NH4Cl, MgCl2, or NaCl yield the same dissociation constants (data not shown).
Thermodynamic linkage of proton and halogen binding
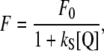
The static quenching nature of fluorescence decay has been established and this allows modeling the experimental fluorescence isotherms according to the equation
 |
(2) |
where F0 is the fluorescence intensity at zero halogen concentration, ks is the halogen-GFP association constant, and Q is the halogen concentration. Notably Eq. 2 allows an accurate determination of the dissociation constants without the need to collect data at halogen saturating concentration that may have required experimentally inaccessible salt concentrations. This fact proved extremely convenient, in the present study, to measure kd at high pH values with considerable precision. The kd values, obtained by fitting absorbance-derived SVD coefficient with Eq. 1 and fluorescence isotherms with Eq. 2, at different pH values and constant ionic strength (1 M), are shown in Fig. 4 A in the case of chloride. In the pH range 4.5–10, the chloride affinity falls by a factor of at least three orders of magnitude, evidencing a strong interplay between H+ and Cl− binding equilibrium.
FIGURE 4.

(A) Linkage between H+ and Cl− binding to E2GFP represented as the change in the logarithm of chloride dissociation constant as a function of pH. Data derived from fluorescence (open circles) and from absorbance (open squares) measurements are reported. The solid line was obtained by global data fitting to Eq. 6 with fit parameters: 0pka = 7.01 ± 0.13, (1/1kCl) = 12.1 ± 0.1 mM, and (1/0kCl) ≥ 2.5 × 1044 mM. Experimental conditions, described in Materials and Methods, are 20°C and 1 M ionic strength, except for the point at pH = 9.0 (open star) that was collected at 4 M. (B) Net number of H+ exchanged upon Cl− binding derived from the data reported in panel A according to Eq. 7. (C) Local binding linkage scheme that considers two H+ (chromophore Y66, E222) and one Cl− (halogen-binding cavity, see Fig. 8, B) binding sites.
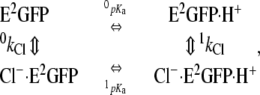
The dependence of the halogen-binding affinities on pH is analyzed by means of a statistical thermodynamic model accounting for two interacting binding sites on the GFP, one for the halide ion and one for the proton, as outlined by the linkage scheme reference cycle (38),
 |
(3) |
where 0kCl and 1kCl are the association constant of chloride to the unligated and proton-ligated forms of E2GFP and, likewise, 0pka and 1pka are the logarithm of the association constant of proton to the unligated and chloride-ligated forms of E2GFP. Thus, the apparent dissociation constants (1/kCl) obtained at different pH values follow the equation
 |
(4) |
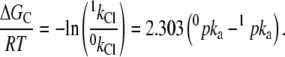
In addition, the binding interaction energy between H+ and Cl− ligands is given by the relationship
 |
(5) |
Accordingly, the data reported in Fig. 4 A were analyzed with the fit function
 |
(6) |
Our data explore the entire range of stability of E2GFP and clearly exhibit a plateau only at low pH values (≤6.0). Therefore, it is possible to estimate precisely only two of the three independent thermodynamic constants of Eq. 3. Specifically: 0pka = 7.01 ± 0.13 (for the binding of H+ in the absence of Cl−) and 1/1kCl = 12.1 ± 0.1 mM (for the binding of Cl− at saturating H+ concentration). The dissociation constant for chloride in the absence of H+ (1/0kCl ≥ 2.5 · 1044 mM) is not well determined. Nevertheless, its extremely high value is suggestive of a large coupling free energy between H+ and Cl−. It is worth noting that fitting to a model with infinite cooperativity (ΔGC → −∞, where the formation of the Cl−·E2GFP complex in Eq. 3 is forbidden) returned unchanged values for 0pka and 1/1kCl fitting parameters.
Furthermore, changes in E2GFP ligation with respect to ligand H+ when ligand Cl− is bound, are derived from the fit to Eqs. 4 or 6. Specifically the net number of proton exchanged (ΔH+) upon chloride binding is expressed by the relationship
 |
(7) |
This linkage function between H+ and Cl− binding to E2GFP is shown in Fig. 4 B. At low pH values (<6.0), Cl− binding is not associated to any proton exchange, while at high pH values (>8.0), Cl− binding determines the binding of one H+ ion. Analogous conclusions were derived in the case of bromide binding (data not shown).
Evidence of intramolecular FRET
Fluorescence excitation spectra (Fig. 3 A) present a band at ∼280 nm that can be linked to fluorescence resonance energy transfer (FRET) between the intrinsic aromatic residues (one tryptophan and 11 tyrosines) and the chromophore as previously observed in other GFP variants (39,40). We acquired emission spectra with excitation set to 280 nm at increasing chloride concentration and various pH values (reported for pH 7.9 in Fig. 5). The chromophore emission band, which is peaked at 523 nm, is quenched according to the chloride binding affinity. Conversely, the intrinsic fluorescence emitted at ∼350 nm is not dependent on the presence of chloride. This is suggestive of an intramolecular FRET not dependent on Cl− concentration; and therefore, Cl−-binding would be associated only with small conformational rearrangements.
FIGURE 5.

Fluorescence emission spectra (normalized at 523 nm) of E2GFP collected at pH 7.9 and increasing chloride concentration (up to 1 M). The excitation wavelength set to 280 nm and temperature to 20°C. In the inset, fluorescence isotherms obtained by integrating the peak at ∼350 nm (310–390 nm) (open squares) and at 523 nm (495–540 nm) (solid circles) are shown. Solid lines are, respectively, the fit to a straight line and to Eq. 2 (with fit parameters: kd = 102.1 ± 1.4, F0 = 0.993 ± 0.003).
X-ray structure of E2GFP
Overall, the crystal structure of E2GFP is similar to that reported for other YFP proteins (41). The phenol ring of Y203 forms a face-to-face π-π stacking interaction with the chromophore plane. However, the specific E2GFP substitutions do alter significantly the chromophore region.
Superimposition of E2GFP and YFP reveals three main structural differences in the chromophore cavity between these proteins (Fig. 6). The first is that in E2GFP, the chromophore O3-C3 carbonyl bond is flipped and the chromophore O3 atom is directed toward the Y203 residue. This unusual conformation with the chromophore O3 flipped internally is here denoted the closed-conformation (see Fig. 7 A).
FIGURE 6.

Stereo-view of the E2GFP chromophore region. The chromophore region of YFP protein is colored in magenta and superimposed for comparison.
FIGURE 7.

(A,B) Conformational changes involving the O3-C3 carbonyl bond between the closed (A) (E2GFP) and open (B) (E2GFP·Cl) form. Water molecule and chloride are rendered as red and green spheres, respectively. Map shown is 2Fo-Fc contoured at 2δ. (C,D) Schematic representation of the closed (C) and open (D) conformations of E2GFP shows conformational changes and hydrogen bonding pattern around the chromophore.
The two other structural differences are a consequence of the previous one. The chromophore ring system moves out by ∼0.5 Å toward the protein surface, and the Q94 side chain rotates around χ2 (from 161° of YFP to −154° of E2GFP) and χ3 (from −50° of YFP to 77° of E2GFP). In GFP proteins, the Q94 residue is of particular interest because it forms an H-bond with the imidazolidinic ring oxygen (O2) of the chromophore, together with residue R96. Despite the Q94 side-chain rotation, the Q94 NE2-O2 chromophore interaction is maintained in E2GFP. Finally, the S65T substitution induces a slight rotation at ∼χ1 of the H-bonded E222 side chain. A similar E222 rotation was previously reported for the GFP S65T variant (42).
Also in the E2GFP structure, there are three water molecules in the buried site delimited by the chromophore plane and by Y203, V68, Q69, L42, V224, and E222 side chains. In particular, Wat251 forms an H-bond bridge between the chromophore O3 atom and Y203 OH, stabilizing the chromophore O3 peptide bond (Fig. 7, A and C).
Halogen binding-site structure and halogen-induced conformational changes
The structure of E2GFP·Cl complex, solved at 1.4 Å resolution, reveals that the chloride ion is located in a buried pocket of ∼10 Å3 in proximity of the chromophore (Fig. 8, A and B). The halogen-binding cavity is delimited by the chromophore plane and by Y203 V68 Q69 L42 V224 E222 side chains (Fig. 8 B). Chloride (ionic radius = 1.67 Å (43)) forms hydrogen bonds with Y203 OH (3.0 Å), V68 N (3.1 Å). It is located at 3.4 Å from the imidazolidinone aromatic ring, in direct contact with the chromophore. The interaction with chloride also involves V68 C (3.4 Å), L42 CD (3.9 Å), and T65 CB (3.9 Å). In the chloride region, there is a single buried water molecule (Wat252), which H-bonds with the halogen (3.2 Å) and with V68 O (3.1 Å) (Fig. 7, B and D).
FIGURE 8.

(A) Ribbon representation of the E2GFP·Cl− complex crystal structure. The chromophore is shown in stick representation and colored in red. The 2Fo-Fc electron density map at 5δ corresponding to the area where the chloride anion was modeled, is in blue. The phases were calculated from a refined model lacking the chloride ion. The refined bonded chloride anion has been superimposed and represented as a green sphere. (B) Stereo-view of the chromophore region of E2GFP·Cl− complex. The chloride ion and water molecule Wat252 are represented as green and red spheres, respectively. The volume (≈10 Å3) of the halogen-binding cavity is represented in orange.
Comparison of the E2GFP·Cl complex structure with the halogen-free form shows that, upon chloride binding, a few conformational changes occur, allowing the anion to reach the binding pocket. The halogen molecule replaces Wat251, which is bridging the chromophore O3 atom with the Y203 OH in the halogen-free structure. Chloride-binding forces the chromophore O3 to flip externally toward Q94, assuming a new conformation, here denoted open-conformation, also characterized by the Q94 side-chain rotation and the loss of one water molecule (Wat257), which is hydrogen-bonded to Q94 amide in the halogen-free structure (Fig. 7, A–D). Finally, the bound chloride disrupts the H-bond, present in the halogen-free form, between the H148 ND1 and the chromophore OH.
Interestingly crystal structure of different variants like wild-type GFP (42), YFP (17), and BFP (44) resemble the open conformation found in the E2GFP·Cl complex structure.
The complex shows two additional chloride-binding sites located at the protein surface, near W57 (Cl–N W57, 3.2 Å), and near L207 (Cl–N L207, 3.3 Å). Similar to what has been observed for the YFP·I complex (17), E2GFP·Cl crystals, grown in 200 mM NH4Cl, need to be soaked in 1 M NH4Cl (far exceeding the solution kd ≈ 12–13 mM) to obtain fully occupied chloride sites in the refined structure.
Halides stabilize E222 in the neutral state
The protonation state of E222 in wild-type GFP and its mutants plays a very significant role in determining the molecule optical properties (45,46) and appears to be a key factor for the protonation equilibrium of E2GFP (47). To investigate the role of halogens in stabilizing the anionic or neutral state of E222, molecular dynamics simulations starting from the E2GFP·Cl complex x-ray structure have been performed. Two simulations, one with protonated (i.e., neutral) E222 and the other with deprotonated (i.e., anionic) E222, were executed. In both simulations, the chromophore was set in the neutral state. Whereas the protonated-E222 1-ns simulation shows a good superposition with the crystal structure (i.e., no important conformational changes are observed in particular in the vicinity of the chromophore), the other simulation features a new configuration of the deprotonated E222, in which the COO− group swings away from the T65 side chain and hydrogen bonds to the S205 backbone amino group. This rearrangement takes place during the first 10 ps of simulation and leads to a configuration that is stable over the next simulated nanosecond. This indicates that the Cl− negative charge repels the rather close E222 side chain (4.5 Å in the crystal structure) when the latter is deprotonated, while it has no effect on the protonated species. We infer that the E2GFP·Cl complex x-ray structure is compatible only with protonated E222 residue.
Specificity to different halogens
The decrease of kd values with ion size, as reported in the Stern-Volmer plots of Fig. 9 A, suggests that optimal van der Waals distances and electrostatic interaction between halogen and protein residues are reached for iodine. Crystal structures of E2GFP·bromide or E2GFP·iodide complex show a similar halogen-binding site and a similar chromophore O3 peptide bond flipping as in E2GFP·Cl complex. Relevant differences among halogen complexes are manifested for the most part in terms of small adjustments around the chromophore and changes in the H-bond network. For example, the distance of the halogen from the chromophore plane changes from 3.4 Å for Cl− and Br− to 3.5 Å for I−.
FIGURE 9.

(A) Fluorescence quenching (Stern-Volmer plot) of E2GFP with different halogens. Data collected at 23°C and pH = 7.95 ± 0.05. Fit parameter kd = 22.6 ± 0.3, 42.9 ± .9, 74.3 ± 1.3, and 182.6 ± 2 for I−, Br−, F−, and Cl−, respectively. (B) Fluorescence quenching (Stern-Volmer plot) at increasing chloride concentration for the GFP variants: E0GFP (−/−), EGFP (S56T/−), E1GFP (−/T203Y), and E2GFP (S65T/T203Y).
Interestingly, the E2GFP·Cl complex reveals the presence of a water molecule Wat252 near the chloride ion. However, possibly because of their larger size, bromide (ionic radius = 1.82 Å) and iodide (ionic radius = 2.06 Å) complexes do not show the presence of any solvent molecule around the halogen; this reveals a slightly different mode of binding.
Mutational analysis
To identify which substitutions establish the specific E2GFP halogen-binding site, we converted the two significant substitutions S65T and T203Y back to wild-type one by one. Fig. 9 B shows chloride affinity data for these mutants of the F64L GFP family. These data were measured at the favorable (for chloride binding) pH 5.2 by means of fluorescence quenching. The S65T variant (EGFP) as well as the double revertant (E0GFP) clearly do not bind chloride. Instead, the single T203Y substitution (E1GFP) introduces halogen-binding capacity albeit with a drastically weakened affinity (kd = 695 ± 10 mM at pH 5.2) compared to E2GFP (kd ∼ 12 mM at pH 5.2). In conclusion, the two substitutions S65T and T203Y cooperate to bind halogens with an estimated free energy of pairwise coupling (38) of ΔGC(65,203) ≈2–3 kcal/mol under the assumption that E0GFP and EGFP share the same extremely low affinity for halogens.
DISCUSSION
By comparing halide-free to halide-bound structures, this study reveals the existence of two distinct conformations of E2GFP—closed and open. In the closed conformation, the O3-C3 carbonyl bond, joining the chromophore to the protein scaffold, is oriented inward and toward the Y203 residue. In the open conformation, this bond is oriented toward the Q94 side chain. These two conformations additionally differ on H-bond networks, rotation of the Q94 side chain, displacement of few water molecules, and flexibility in the region around the chromophore.
While the open conformation observed in the halide-bound complexes resembles the chromophore environment of all previously reported GFP structures (17,42,44), the closed conformation appears to be a unique structural feature of the E2GFP variant. Interestingly upon binding of chloride or other halide-ions, E2GFP switches from closed to open conformation under the influence of the halide-ion steric hindrance and electrostatic repulsion.
The E2GFP·Cl x-ray data at 1.4 Å resolution describe, for the first time to our knowledge, the structural determinants of GFP/chloride interaction. Previously reported x-ray structure of a YFP·I (H148Q mutant) complex (17) showed the halide positioned in a small and buried cavity adjacent to Q69, next to the O2 (4.3 Å) and CD2 (4.4 Å) of the imidazolidinone ring. In line with this observation, Rekas et al. (48) analyzed the YFP variant called Venus and associated its chloride resistance to the substitution F64L. It was argued that the latter prevents ion access to the YFP halide-binding site by inducing a number of local and global structural changes. In contrast, in this study we show marked halide sensitivity in our F64L GFP variant by creating a specific halide-binding site differently located in direct contact with the chromophore imidazolidinone plane (3.5 Å). We also demonstrated that the T203Y substitution is necessary in determining halide sensitivity and that the S65T substitution cooperates to produce the remarkable E2GFP (F64L, S65T, T203Y, H231L) sensitivity to halogens (Fig. 9).
The presence of a halide ion in the chromophore environment strongly influences E2GFP photophysical and photochemical properties. As expected from simple electrostatic arguments, the presence of halide alters the small difference in free energy of the electronic ground state between the neutral and anionic chromophores. The electrostatic repulsion between the halide ion and the anionic chromophore favors the protonated form of the chromophore, as indicated by the depletion of the absorption anionic band at 515 nm (Fig. 1 and 2, A). Furthermore, because of the halide-generated electrostatic field in the chromophore environment, Cl− and H+ strongly cooperate in E2GFP-binding (Fig. 4 A). Statistical thermodynamic analysis of the data indicates very large cooperative interaction energy. Indeed, Fig. 4 B clearly shows that the binding of one chloride ion to E2GFP in the anionic state is linked to the binding of one proton.
Protonation mechanisms involving a second protonation site other than the chromophore or an effective protonation site formed by hydrogen-bonded cluster of charged/polar groups have been recently reported in fluorescent protein from Anemonia sulcata (40) and Cerianthus membranaceus (49). Similarly, Bizzarri et al. (47) demonstrated the existence of a second protonation site in E2GFP leading to a complex configuration scheme that, however, exhibits a phenomenology well described by an effective single-site scheme. This site is the E222 residue, which was previously evidenced as a proton donor-acceptor involved in the shuttling of a proton with the chromophore in wild-type GFP and in the absence of Cl− (42,50). Molecular dynamic simulations are reported here for the case of protonated (neutral) and deprotonated (anionic) E222, and indicate that the bound halide ion stabilizes the protonated form of this residue. Proton transfer between the chromophore (Y66) and E222, therefore, cannot take place. This leads to an influence of the halogen also on the excited-state dynamics. Indeed, our lifetime analysis proves that halide binding generates a nonfluorescent complex establishing fluorescence static quenching, which allowed us to advantageously investigate the halide-binding thermodynamics. Fig. 4 C outlines the local binding linkage mechanism for two protonation sites (E222, chromophore Y66) and one halide-binding site. In this scheme, the above-described anionic state corresponds to an effective protonation state (M), where the increase of pH causes the unloading of one of the two H+ binding sites. Accordingly halide-binding favors the E2GFP fully protonated state and the latter is dark because the chromophore is in the neutral (RH) form and almost certainly unable to fluoresce via ESPT. In fact, the negative halide charge would inhibit ESPT by preventing the formation of the anionic chromophore state because of electrostatic repulsion. SVD analysis of absorption spectroscopy data provides further support for the presence of a single fully protonated E2GFP·Cl− complex. In fact, this analysis strongly indicates the presence of three spectroscopic different species. Even though caution must be applied in the interpretation of the physical meaning of the SVD basis vector (34), the first difference spectra basis vector in Fig. 2 D is consistent with the chloride-binding equilibrium (solid line) and the second with the proton-binding equilibrium (dash-dot line) between A′ and A′·Cl−, and A′ and M, respectively.
Rearrangements of the H-bond network around residue H148 from halogen-free to halide-bound structures along with fluctuation in the H148 position suggest the presence of different protonation forms distinctive to the halide-bound complexes because of enhanced proton exchange through the H148 residue (51,52). This may indicate a complex interplay between the dynamics of proton exchange within the protein and between the protein and the solvent that is altered by Cl− binding. These observations suggest the need for a more detailed investigation at the local-binding level of the heterotropic linkage between protons and halides.
The identified E2GFP halide-binding site can accommodate different ions. E2GFP affinity to halogens was determined according to the order of I− > Br− > F− > Cl−, from high to low. This halogen selectivity sequence correlates with electron affinity and, similarly to YFP (20), bigger ions having lower dehydration energies bind more strongly. E2GFP halogen binding emerges as potentially more specific to halide ions than YFP, which was proved to be sensitive to anions other than halogens. Crystal structures of E2GFP in complex with different halogens confirm a similar protein structure arrangement and binding cavity. However, for the case of chloride—the smallest and less polarizable of the tested halogen—an additional water molecule is present in the binding pocket and a reduced tendency to approach the chromophore plane was observed.
The halide affinities of the YFP binding pocket was linked to the chromophore pKa (with a loss in affinity when the pKa is increased) (6). On the contrary, E2GFP exhibits a high halogen affinity (kd ≈ 12–15 mM in the pH range ≤ 7.0 for chloride) concomitantly with a relatively high pKa ∼7.0. Considering that E2GFP features spectroscopic ratiometric properties that allow sensing the environmental pH (18) in a way not dependent on halide ion concentration, we envision the design of a valuable GFP-based halide biosensor (16,19,20) with improved precision. In fact, the quantification of halogen concentration would be based on actual pH measurement.
Based on the analysis here reported, we believe that the crucial role, played by the chloride ion in several phases of human biology and disease regulation, motivates further substitutions in E2GFP to modulate its chloride specificity and design a molecular probe for simultaneous pH and Cl− monitoring in living specimens.
Acknowledgments
This research was in part supported by the Italian Ministry for University Research (FIRB No. RBLA03ER38) and by the Fondazione Monte dei Paschi.
G. Garau's present address is Biocrystallography Unit, DIBIT, San Raffaele Scientific Institute, via Olgettina 56, 20134 Milano, Italy.
Editor: Arthur G. Palmer.
References
- 1.Ormo, M., A. B. Cubitt, K. Kallio, L. A. Gross, R. Y. Tsien, and S. J. Remington. 1996. Crystal structure of the Aequorea victoria green fluorescent protein. Science. 273:1392–1395. [DOI] [PubMed] [Google Scholar]
- 2.Li, X., G. Zhang, N. Ngo, X. Zhao, S. R. Kain, and C. C. Huang. 1997. Deletions of the Aequorea victoria green fluorescent protein define the minimal domain required for fluorescence. J. Biol. Chem. 272:28545–28549. [DOI] [PubMed] [Google Scholar]
- 3.Creemers, T. M., A. J. Lock, V. Subramaniam, T. M. Jovin, and S. Volker. 2000. Photophysics and optical switching in green fluorescent protein mutants. Proc. Natl. Acad. Sci. USA. 97:2974–2978. [DOI] [PMC free article] [PubMed] [Google Scholar]
- 4.Subramaniam, V., Q. S. Hanley, A. H. Clayton, and T. M. Jovin. 2003. Photophysics of green and red fluorescent proteins: implications for quantitative microscopy. Methods Enzymol. 360:178–201. [DOI] [PubMed] [Google Scholar]
- 5.Jung, G., J. Wiehler, and A. Zumbusch. 2005. The photophysics of green fluorescent protein: influence of the key amino acids at positions 65, 203, and 222. Biophys. J. 88:1932–1947. [DOI] [PMC free article] [PubMed] [Google Scholar]
- 6.Wachter, R. M. 2005. Symposium-in-print: The family of GFP-like proteins: structure, function, photophysics and biosensor applications. Photochem. Photobiol. 82:339–344. [DOI] [PubMed] [Google Scholar]
- 7.Sacchetti, A., T. El Sewedy, A. F. Nasr, and S. Alberti. 2001. Efficient GFP mutations profoundly affect mRNA transcription and translation rates. FEBS Lett. 492:151–155. [DOI] [PubMed] [Google Scholar]
- 8.Waldo, G. S. 2003. Improving protein folding efficiency by directed evolution using the GFP folding reporter. Methods Mol. Biol. 230:343–359. [DOI] [PubMed] [Google Scholar]
- 9.Nagai, T., K. Ibata, E. S. Park, M. Kubota, K. Mikoshiba, and A. Miyawaki. 2002. A variant of yellow fluorescent protein with fast and efficient maturation for cell-biological applications. Nat. Biotechnol. 20:87–90.11753368 [Google Scholar]
- 10.Nifosi, R., and V. Tozzini. 2003. Molecular dynamics simulations of enhanced green fluorescent proteins: effects of F64L, S65T and T203Y mutations on the ground-state proton equilibria. Proteins. 51:378–389. [DOI] [PubMed] [Google Scholar]
- 11.Boeckmann, B. B. A., R. Apweiler, M.-C. Blatter, A. Estreicher, E. Gasteiger, M. J. Martin, K. Michoud, C. O'Donovan, I. Phan, S. Pilbout, and M. Schneider. 2003. The Swiss-Prot Protein Knowledgebase and its supplement TrEMBL in 2003. Nucleic Acids Res. 31:365–370. [DOI] [PMC free article] [PubMed] [Google Scholar]
- 12.Dickson, R. M., A. B. Cubitt, R. Y. Tsien, and W. E. Moerner. 1997. On/off blinking and switching behavior of single molecules of green fluorescent protein. Nature. 388:355–358. [DOI] [PubMed] [Google Scholar]
- 13.Cinelli, R. A. G., V. Pellegrini, A. Ferrari, P. Faraci, R. Nifosì, M. Tyagi, M. Giacca, and F. Beltram. 2001. Green fluorescent proteins as optically controllable elements in bioelectronics. Appl. Phys. Lett. 79:3353–3355. [Google Scholar]
- 14.Chirico, G., A. Diaspro, F. Cannone, M. Collini, S. Bologna, V. Pellegrini, and F. Beltram. 2005. Selective fluorescence recovery after bleaching of single E2GFP proteins induced by two-photon excitation. ChemPhysChem. 6:328–335. [DOI] [PubMed] [Google Scholar]
- 15.Nifosì, R. F. A., C. Arcangeli, V. Tozzini, V. Pellegrini, and F. Beltram. 2003. Photoreversible dark state in a tri-stable green fluorescent protein variant. J. Phys. Chem. B. 107:1679–1684. [Google Scholar]
- 16.Wachter, R. M., and S. J. Remington. 1999. Sensitivity of the yellow variant of green fluorescent protein to halides and nitrate. Curr. Biol. 9:R628–R629. [DOI] [PubMed] [Google Scholar]
- 17.Wachter, R. M., D. Yarbrough, K. Kallio, and S. J. Remington. 2000. Crystallographic and energetic analysis of binding of selected anions to the yellow variants of green fluorescent protein. J. Mol. Biol. 301:157–171. [DOI] [PubMed] [Google Scholar]
- 18.Bizzarri, R., C. Arcangeli, D. Arosio, F. Ricci, P. Faraci, F. Cardarelli, and F. Beltram. 2006. Development of a novel GFP-based ratiometric excitation and emission pH indicator for intracellular studies. Biophys. J. 90:3300–3314. [DOI] [PMC free article] [PubMed] [Google Scholar]
- 19.Galietta, L. J., P. M. Haggie, and A. S. Verkman. 2001. Green fluorescent protein-based halide indicators with improved chloride and iodide affinities. FEBS Lett. 499:220–224. [DOI] [PubMed] [Google Scholar]
- 20.Jayaraman, S., P. Haggie, R. M. Wachter, S. J. Remington, and A. S. Verkman. 2000. Mechanism and cellular applications of a green fluorescent protein-based halide sensor. J. Biol. Chem. 275:6047–6050. [DOI] [PubMed] [Google Scholar]
- 21.Griesbeck, O., G. S. Baird, R. E. Campbell, D. A. Zacharias, and R. Y. Tsien. 2001. Reducing the environmental sensitivity of yellow fluorescent protein. Mechanism and applications. J. Biol. Chem. 276:29188–29194. [DOI] [PubMed] [Google Scholar]
- 22.Valeur, B. 2002. Molecular Fluorescence Principles and Applications. Wiley-VCH, Weinheim, Germany.
- 23.Geddes, C. D. 2001. Optical halide sensing using fluorescence quenching: theory, simulations and applications—a review. Meas. Sci. Technol. 12:R53–R88. [Google Scholar]
- 24.Cinelli, R. A., V. Tozzini, V. Pellegrini, F. Beltram, G. Cerullo, M. Zavelani-Rossi, S. De Silvestri, M. Tyagi, and M. Giacca. 2001. Coherent dynamics of photoexcited green fluorescent proteins. Phys. Rev. Lett. 86:3439–3442. [DOI] [PubMed] [Google Scholar]
- 25.Gasteiger, E. H. C., A. Gattiker, S. Duvaud, M. R. Wilkins, R. D. Appel, and A. Bairoch. 2005. Protein identification and analysis tools on the ExPASy server. In The Proteomics Protocols Handbook. J. M. Walker, editor. Humana Press, Totowa, NJ.
- 26.Scilab. 1989. –2005. INRIA ENPC. http://www.scilab.org/.
- 27.Collaborative Computational Project. 1994. The CCP4 suite: programs for protein crystallography. Acta Crystallogr. D50:760–763. [DOI] [PubMed] [Google Scholar]
- 28.Emsley, P., and K. Cowtan. 2004. COOT: model-building tools for molecular graphics. Acta Crystallogr. D Biol. Crystallogr. 60:2126–2132. [DOI] [PubMed] [Google Scholar]
- 29.Cornell, W. D., O. Cieplak, C. I. Bayly, I. R. Gould, D. M. Ferguson, D. C. Spellmeyer, T. Fox, J. W. Caldwell, and P. A. Kollman. 1995. A second generation force field for the simulation of proteins and nucleic acids. J. Am. Chem. Soc. 117:5179–5197. [Google Scholar]
- 30.Kleywegt, G. J., J. Y. Zou, M. Kjeldgaard, and T. A. Jones. 2001. Around O. In International Tables for Crystallography, Vol. F. Crystallography of Biological Macromolecules. Kluwer Academic Publishers, Dordrecht, The Netherlands.
- 31.PyMOL. Molecular Graphics System. DeLano Scientific, San Carlos, CA. http://pymol.sourceforge.net/.
- 32.Berman, H. M., J. Westbrook, Z. Feng, G. Gilliland, T. N. Bhat, H. Weissig, I. N. Shindyalov, and P. E. Bourne. 2000. The Protein Data Bank. Nucleic Acids Res. 28:235–242. [DOI] [PMC free article] [PubMed] [Google Scholar]
- 33.Hendler, R. W., and R. I. Shrager. 1994. Deconvolutions based on singular value decomposition and the pseudoinverse: a guide for beginners. J. Biochem. Biophys. Methods. 28:1–33. [DOI] [PubMed] [Google Scholar]
- 34.van Holde, K. E., C. Johnson, and P. S. Ho. 1998. Principles of Physical Biochemistry. Prentice Hall, Englewood Cliffs, NJ.
- 35.Tsien, R. Y. 1998. The green fluorescent protein. Annu. Rev. Biochem. 67:509–544. [DOI] [PubMed] [Google Scholar]
- 36.Chattoraj, M., B. A. King, G. U. Bublitz, and S. G. Boxer. 1996. Ultra-fast excited state dynamics in green fluorescent protein: multiple states and proton transfer. Proc. Natl. Acad. Sci. USA. 93:8362–8367. [DOI] [PMC free article] [PubMed] [Google Scholar]
- 37.Lakowicz, J. R. 1999. Principles of Fluorescence Spectroscopy. Kluwer Academic/Plenum Publishers, New York.
- 38.DiCera, E. 2005. Thermodynamic Theory of Site-Specific Binding Processes in Biological Macromolecules. Cambridge University Press, Cambridge, UK.
- 39.Matz, M. V., A. F. Fradkov, Y. A. Labas, A. P. Savitsky, A. G. Zaraisky, M. L. Markelov, and S. A. Lukyanov. 1999. Fluorescent proteins from nonbioluminescent Anthozoa species. Nat. Biotechnol. 17:969–973. [DOI] [PubMed] [Google Scholar]
- 40.Nienhaus, K., F. Renzi, B. Vallone, J. Wiedenmann, and G. U. Nienhaus. 2006. Chromophore-protein interactions in the anthozoan green fluorescent protein asFP499. Biophys. J. 91:4210–4220. [DOI] [PMC free article] [PubMed] [Google Scholar]
- 41.Wachter, R. M., M. A. Elsliger, K. Kallio, G. T. Hanson, and S. J. Remington. 1998. Structural basis of spectral shifts in the yellow-emission variants of green fluorescent protein. Structure. 6:1267–1277. [DOI] [PubMed] [Google Scholar]
- 42.Brejc, K., T. K. Sixma, P. A. Kitts, S. R. Kain, R. Y. Tsien, M. Ormo, and S. J. Remington. 1997. Structural basis for dual excitation and photoisomerization of the Aequorea victoria green fluorescent protein. Proc. Natl. Acad. Sci. USA. 94:2306–2311. [DOI] [PMC free article] [PubMed] [Google Scholar]
- 43.Shannon, R. D. 1976. Revised effective ionic radii and systematic studies of interatomic distances in halides and chalcogenides. Acta Crystallogr. A32:751–767. [Google Scholar]
- 44.Wachter, R. M., B. A. King, R. Heim, K. Kallio, R. Y. Tsien, S. G. Boxer, and S. J. Remington. 1997. Crystal structure and photodynamic behavior of the blue emission variant Y66H/Y145F of green fluorescent protein. Biochemistry. 36:9759–9765. [DOI] [PubMed] [Google Scholar]
- 45.Stoner-Ma, D., A. A. Jaye, P. Matousek, M. Towrie, S. R. Meech, and P. J. Tonge. 2005. Observation of excited-state proton transfer in green fluorescent protein using ultrafast vibrational spectroscopy. J. Am. Chem. Soc. 127:2864–2865. [DOI] [PubMed] [Google Scholar]
- 46.van Thor, J. J., A. J. Pierik, I. Nugteren-Roodzant, A. Xie, and K. J. Hellingwerf. 1998. Characterization of the photoconversion of green fluorescent protein with FTIR spectroscopy. Biochemistry. 37:16915–16921. [DOI] [PubMed] [Google Scholar]
- 47.Bizzarri, R., R. Nifosi, S. Abbruzzetti, W. Rocchia, S. Guidi, D. Arosio, G. Garau, B. Campanini, E. Grandi, F. Ricci, C. Viappiani, and F. Beltram. 2007. Green Fluorescent Protein ground states: the influence of a second protonation site near the chromophore. Biochemistry. In press. [DOI] [PubMed]
- 48.Rekas, A., J. R. Alattia, T. Nagai, A. Miyawaki, and M. Ikura. 2002. Crystal structure of Venus, a yellow fluorescent protein with improved maturation and reduced environmental sensitivity. J. Biol. Chem. 277:50573–50578. [DOI] [PubMed] [Google Scholar]
- 49.Nienhaus, K., F. Renzi, B. Vallone, J. Wiedenmann, and G. U. Nienhaus. 2006. Exploring chromophore–protein interactions in fluorescent protein cmFP512 from Cerianthus membranaceus: x-ray structure analysis and optical spectroscopy. Biochemistry. 45:12942–12953. [DOI] [PubMed] [Google Scholar]
- 50.Palm, G. J., A. Zdanov, G. A. Gaitanaris, R. Stauber, G. N. Pavlakis, and A. Wlodawer. 1997. The structural basis for spectral variations in green fluorescent protein. Nat. Struct. Biol. 4:361–365. [DOI] [PubMed] [Google Scholar]
- 51.Abbruzzetti, S., E. Grandi, C. Viappiani, S. Bologna, B. Campanini, S. Raboni, S. Bettati, and A. Mozzarelli. 2005. Kinetics of acid-induced spectral changes in the GFPmut2 chromophore. J. Am. Chem. Soc. 127:626–635. [DOI] [PubMed] [Google Scholar]
- 52.Elsliger, M. A., R. M. Wachter, G. T. Hanson, K. Kallio, and S. J. Remington. 1999. Structural and spectral response of green fluorescent protein variants to changes in pH. Biochemistry. 38:5296–5301. [DOI] [PubMed] [Google Scholar]