Abstract
Living organisms make great efforts to maintain their genetic information integrity. However, DNA is vulnerable to many chemical or physical agents. To rescue the cell timely and effectively, the DNA damage response system must be well controlled. Recently, single cell experiments showing that after DNA damage, expression of the key DNA damage response regulatory protein oscillates with time. This phenomenon is observed both in eukaryotic and bacterial cells. We establish a model to simulate the DNA damage response (SOS response) in bacterial cell Escherichia coli. The simulation results are compared to the experimental data. Our simulation results suggest that the modulation observed in the experiment is due to the fluctuation of inducing signal, which is coupled with DNA replication. The inducing signal increases when replication is blocked by DNA damage and decreases when replication resumes.
INTRODUCTION
Both eukaryotes and bacteria have evolved elaborate systems to cope with critical conditions that threaten the DNA metabolism process. Bacteria undergo an inducible process, the SOS response, to rescue the cell from DNA replication interruptions that are mainly caused by DNA damage. Among the agents that cause DNA damage, ultraviolet (UV) light irradiation is one of the most comprehensively studied (1–3). It provides a paradigm for studying how cells survive and recover from DNA damage. Many significant principles in the field of DNA damage repair are first discovered from this model (4).
The SOS response is mediated by two key proteins: RecA and LexA. DNA replication is blocked when it encounters a UV-induced lesion. RecA is then activated. The activated form of RecA (referred to as RecA*) acts as a coprotease to catalyze the autocleavage of LexA. LexA is a transcriptional repressor that binds to the operator region (often referred to as SOS box) and represses the expression of more than 40 genes (SOS genes) (5), including recA and lexA themselves. The SOS genes have different functions, including DNA repairs, DNA recombinations, replication restarts, inhibitions of cell premature division, and inducible mutagenesis (reviewed in Crowley and Courcelle (6)). Most of these functions contribute to the replication restart. When the DNA replication returns to normal, RecA* is eliminated, allowing LexA to reaccumulate. Thus the SOS genes expression is repressed again.
A series of mathematical models have been established to simulate the regulation of SOS response (7–9). These works are based on experiments that investigate the dynamics of responses at population level, using Western blot (10) or mRNA microarray (5) technology. Recently, Friedman et al. investigated the dynamics of SOS genes promoter activity after UV irradiation at single cell level (11). They found that the promoter activity shows a digital oscillator-like characteristic. As SOS genes are controlled by the transcription repressor LexA, their experimental results suggest that LexA and RecA* have fine-tuned dynamics during SOS response. Analogously, in eukaryotic cells, the tumor suppressor protein p53 level also exhibits undamped oscillations in response to DNA damage (12). Ma et al. have established a model to explain the oscillations (13). According to their explanation, the oscillations of p53 is due to a time-delay negative feedback between p53 and Mdm2. p53 activates MDM2 gene transcription, whereas Mdm2 binds to p53 to inhibit its transcriptional activity and ubiquitinates it, so that p53 is recognized by proteasome. Furthermore, because the inducing signal, which sustains the oscillations, is considered to be a sharp and all-or-nothing switch (13), the amplitude of the modulation does not decrease before it disappears. However, there are significant differences between the eukaryotic p53-Mdm2 control mechanism and the bacterial LexA-RecA response feedback. There is no strong negative feedback regulation between RecA (or RecA*) and LexA in Escherichia coli. On the other hand, LexA is a transcriptional repressor, whereas p53 is an activator. Therefore, the response timescales of the two systems, i.e., the accumulation rate of p53 and the degradation rate of LexA, are very different.
In this article, we present a model to describe the SOS response process in E. coli. Different from previously models for this system (7–9), our model describes the dynamics at single cell level, and takes into account the stochastic and discrete characteristic of the inducing signal, RecA*, which shows up only when the replication fork encounters a DNA damage point. We show that the digital oscillator-like modulation is mainly due to the fluctuations of RecA*. RecA* goes up and down as the replication fork travels through the lesions one by one. We conclude that for UV irradiation, the SOS inducing signal is strongly coupled with the DNA replication. The regulatory network for the SOS response influences the modulation of the SOS gene expression dynamics in certain frequency range.
Model description
The model that we present here can be divided into three modules. First, DNA damage causes a replication interruption and hence RecA* generation. The activated RecA* then eliminates LexA. Second, the elimination of LexA induces an elevated level of the SOS gene expression. Third, the inducible nucleotide excision repair (NER) system and the DNA translesion synthesis (TLS) system, together with the noninducible recombination repair (RR) system, work on DNA damage. They seek to remove the lesions or complete DNA replication. In the following we discuss these modules one by one.
SOS inducing signal: RecA activation and LexA cleavage
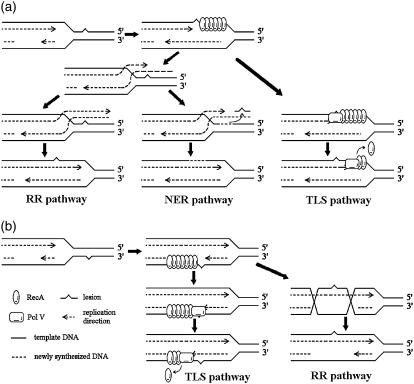
UV radiation produces DNA lesions; the cyclobutane pyrimidine dimers (CPD) and the pyrimidine(6-4)pyrimidone photoproducts (6-4PP) twist the DNA structure and block DNA replication (3). The DNA polymerase III (Pol III) cannot replicate the damaged DNA template. As shown in Fig. 1 a, when the enzyme encounters a lesion on the leading strand, the replication process stalls (14). If the lesion is on the lagging strand, replication may simply reinitiate downstream and leave a single daughter strand gap (DSG) behind (Fig. 1 b) (reviewed in Courcelle et al. (15)). Afterward, single strand DNA (ssDNA) appears at the stalled replication fork (reviewed in Michel et al. (16)). With the help of RecFOR, RecA is loaded onto the ssDNA, forming a nucleoprotein filament (17), as shown in Fig. 1. So far, whether RecA is loaded onto the leading (18) or lagging (19) strand is still in debate. RecA binds to ssDNA orderly in the 5′ to 3′ direction, and also disassociates from 5′ to 3′ (reviewed in Cox (20)). Every RecA molecule binds to three nucleotides. The ssDNA bounded RecA has multiple functions: it rearranges and stabilizes the stalled replication fork structure (21); it catalyzes DNA strand exchange as the first step of DSG repair (reviewed in Kreuzer (22)); it catalyzes autocleavage of LexA (23,24) and UmuD (25); it assists TLS (reviewed in Schlacher et al. (26)).
FIGURE 1.
A sketch for DNA replication arrest and resume. (a) DNA replication encounters a lesion on the leading strand; (b) DNA replication encounters a lesion on the lagging strand.
UV irradiation (253 nm) produces 65 lesions per J/m2 per 107 nucleotides (27). In our model, the lesions are randomly distributed on the E. coli chromosome with a total length of 4.6 × 10⁶ basepair (see Appendix for simulation details). The number of nucleotides (NNC) that have been replicated is described in the following reaction:
 |
(1) |
where krep = 900 s−1 is the replication rate constant. When the replication is blocked by a lesion on the leading strand, krep becomes zero and NNC stops increasing. We assume that lesions located on the leading strand will stop DNA replication, although this may not always be the case (reviewed in Langston and O'Donnell (28)). On the other hand if the lesion is on the lagging strand, the replication does not stop; it instead leaves a single strand gap behind. In both cases, ssDNA appears, therefore RecA* increases:
 |
(2) |
where ssDNA represents the number of ssDNAs (see Appendix for simulation details); kreca_on and kreca_off are binding and unbinding rate constants for RecA, respectively. As the length of ssDNAs at the stalled replication fork or DSG is assumed to be no more than 1500 bp (14), the total amount of RecA* molecules on one fragment of ssDNA is restricted to no more than 500. RecA*, in turn, mediates LexA cleavage:
 |
(3) |
The parameters for this module are listed in Table 1.
TABLE 1.
Parameters for SOS signaling, NER, TLS, and RR
| Parameter | Description | Value (s−1) |
|---|---|---|
| krep | DNA replication | 900 |
| kreca_on | RecA binding onto ssDNA | 0.003 |
| kreca_off | RecA unbind from ssDNA | 2 (55) |
| kclexa | RecA catalyzed LexA cleavage | 7.5 × 10⁻⁶ |
| krecu | RecA catalyzed UmuD cleavage | 1 × 10⁻⁵ |
| kner | NER | 1.5 × 10⁻⁶ |
| ktls | TLS | 4 × 10⁻⁶ |
| ThrTLS | RecA* threshold for TLS | 50 |
| krrDSG | RR on DSG | 0.05 |
| krrRF | RR on replication fork | 0.0001 |
| ThrRR | RecA* threshold for RR | 480 |
| kslow_on | UmuD2 binding onto Pol III | 0.025 |
| kslow_off | UmuD2 unbinding from Pol III | 10 |
| rslow | Replication rate fold change | 3 |
| kDD1 | UmuD binding | 0.001 |
| kDD2 | UmuD2 unbinding | 0.0058 |
| kD′D′1 | UmuD′ binding | 0.001 |
| kD′D′2 | UmuD′2 unbinding | 0.0058 |
| kDD′1 | UmuD and UmuD′ binding | 0.0058 |
| kDD′2 | UmuDD′ unbinding | 0.0029 |
| kD′C1 | UmuD′2 and UmuC binding | 0.001 |
| kD′C2 | UmuD′2C unbinding | 0.24 |
| kDDdp | UmuD2 degradation | 0.0017 |
| kD′dp | UmuD′ degradation | 0.00064 |
| kD′D′dp | UmuD′2 degradation | 0.00064 (40) |
| kDD′dp | UmuDD′ degradation | 0.00064 |
| kD′Cdp | UmuD′2C degradation | 0.0019 |
| kClp | UmuDD′ degraded by ClpXP | 0.001 |
SOS genes induction
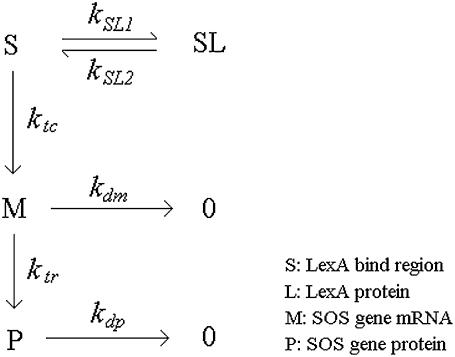
The transcription of SOS genes is repressed by LexA. The LexA controlled transcription and the subsequent translation processes are illustrated in Fig. 2 (29). S is the LexA binding region (SOS box), which can bind two LexA monomers. As LexA tends to form a stable dimer in solution (30), the LexA binding process is considered to be a single step. SL indicates S region occupied by one LexA dimer. M is mRNA, which is transcribed mainly from the unoccupied S region. We assume that the transcription from SL is negligible. P is the protein product of the corresponding mRNA. The degradation rate constants for mRNA and protein are denoted by kdm and kdp, respectively. In our model, five SOS genes are concerned: lexA, recA, uvrB, umuD, and umuC. uvrB is responsible for NER, and umuD and umuC are responsible for TLS. Note that the recFOR genes, which are responsible for RR, are not controlled by LexA. The parameters for this module are listed in Table 2.
FIGURE 2.
SOS genes expression reactions. S, LexA binding region; SL, S region occupied by one LexA dimer; M, mRNA; P, the protein product of M.
TABLE 2.
Parameters for transcription and translation
| recA | lexA | umuD | umuC | uvrB | |
|---|---|---|---|---|---|
| kSL1 | 1 | 1 | 1 | 1 | 1 |
| kSL2* | 33 | 470 | 27 | 27 | 175 |
| ktc† | 1.19 | 0.079 | 0.18 | 0.07 | 0.0593 |
| kdm‡ | 0.0034 | 0.0021 | 0.0018 | 0.0014 | 0.0035 |
| ktr§ | 0.9 | 0.03 | 0.18 | 0.038 | 0.13 |
| kdp¶ | 0.001 | 0.000231 | 0.0023 | 0.0019 | 0.001 |
| mRNA basal level‖ | 8 | 10 | 2 | 1 | 2 |
| Protein basal level** | 7200 | 1300 | 200 | 20 | 250 |
kSL2 is determined by fitting mRNA microarray data in Courcelle et al. (5).
The transcription rates are determined by mRNA degradation rate kdm and mRNA basal level.
The half-lives of mRNAs in E. coli are derived from Bernstein et al. (56).
The translation rates are determined by the protein degradation rate kdp and the protein basal level.
The half-life of LexA is derived from Sassanfar and Roberts (10); the half-lives of UmuD and UmuC are derived from Frank et al. (40); the half-lives of RecA and UvrB are determined by fitting Fig. 4, e and f, respectively.
The relative abundance of mRNA molecules is derived from Bernstein et al. (56).
NER, TLS, and RR
NER
The NER system (31) is responsible for removing the UV-produced CPDs and 6-4PPs. It is composed of uvrA, uvrB, and uvrC. uvrA and uvrB are repressed by LexA, whereas uvrC is not. The NER genes have a significant basal level expression in the normal condition to deal with the naturally occurring DNA damages. During SOS response, uvr genes are induced to speed up removing the lesions (32). The NER process is considered to be vital for cells to resume replication from UV-induced DNA damage. It has been shown that in uvrA defective cells, LexA proteins are unable to reaccumulate long after UV irradiation (10), and the DNA replication do not resume either (33). This indicates that the NER system is crucial to SOS recovery. uvrA deficiency also causes elevated sensitivity against UV irradiation (34). These experimental evidences lead to the hypothesis (15,21) that, in response to UV irradiation, the most efficient way to overcome a DNA replication arrest is to remove the lesion via NER, which is followed by a replication restart. As shown in Fig. 1 a, ssDNA bound RecA may facilitate replication fork regression (35), so that the NER proteins can gain access to excise the lesion-containing DNA fragment (Fig. 1 a, NER pathway). When the damage is repaired, replication starts again.
Because uvrA and uvrB present similar expression profile in transcription (5) and translation level (32), only uvrB is included in the model to represent the NER system. The repair process is considered to be first order:
 |
(4) |
When this reaction takes place, a lesion is randomly selected and removed from the chromosome. If the lesion chosen to be removed is the one right in front of the stalled replication fork, in other words, it is the one causing a replication arrest, the removal will lead to ssDNA-RecA filament disassembly and DNA replication restart. In the simulation, this process is realized by decreasing RecA* at a rate of kreca_off. When RecA* on the ssDNA involved decreases to zero, krep is set to be 900 s−1, indicating replication resumption.
TLS
TLS is another important SOS activity, which is thought to be responsible for SOS mutagenesis (reviewed in Tippin et al. (36)), replication restart, and DSG filling (37). In E. coli, there are three error-prone (EP) polymerases (36), which are all repressed by LexA: Pol II (encoded by polB), Pol IV (dinB), and Pol V (encoded by umuD and umuC). They are capable of passing through the lesion and continuing replication, yet with a low fidelity, thus raising the mutation rate. Pol V is the only EP polymerase that has evident phenotype during UV-induced SOS response (37). Deleting Pol V will dramatically reduce SOS mutagenesis, and will render the cell more sensitive to high dose UV exposure (37). For simplicity, among the three EP polymerases, only Pol V is considered in our model.
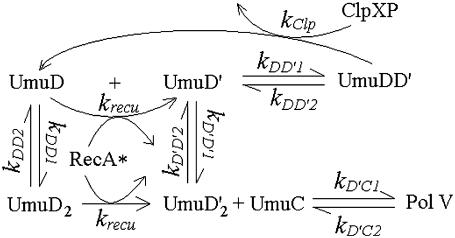
The cell has evolved an elaborate mechanism to control the in vivo concentrations of UmuD and UmuC, at both the transcriptional and the posttranscriptional levels (reviewed in Gonzalez and Woodgate (38)). The umu operon is tightly repressed by LexA. UmuD and UmuC are rapidly degraded by Lon protease (39,40). As shown in Fig. 3, UmuD can form homodimer UmuD2. UmuD and UmuD2 undergo autocleavage catalyzed by RecA*, similar to LexA cleavage. The 24 residues at the N-terminal of UmuD are then removed, so that UmuD turns into UmuD′. UmuD′ can form homodimer UmuD′2, and form heterodimer UmuDD′ with UmuD as well. UmuD′2 is more stable than UmuD2. UmuD and UmuD′ prefer to form heterodimer rather than homodimer. When forming a heterodimer, UmuD subunit presents UmuD′ substrate to the ClpXP protease for degradation (41), limiting the level of UmuD′ to a minimum. UmuD′2 and UmuC finally form UmuD′2C, namely Pol V.
FIGURE 3.
Pol V posttranslation regulation reactions.
As shown in Fig. 1, a and b, of the TLS pathway, Pol V is loaded onto the damage point to replace Pol III when ssDNA-RecA filament is presented (42). Pol V can effectively replicate across the lesion and continues to synthesize ∼20 nucleotides with low fidelity (42). Afterward, Pol III takes the place again and resumes normal replication. Because neither Pol III nor Pol V can replicate on a RecA coated template (36,43), RecA should disassemble from ssDNA before the replication resumes.
In our model, the TLS process is similar to the NER process.
 |
(5) |
where lesion_RF and lesion_DSG are the lesions that block replication at the replication fork or DSG, respectively. As RecA is needed to initiate TLS, reaction (5) does not happen before the length of ssDNA-RecA filament reaches a certain threshold ThrTLS. When reaction (5) takes place on the leading strand lesion, RecA* at the replication fork falls to zero before replication resumption. If the reaction takes place on a DSG, RecA* on that DSG decreases and the lesion becomes accessible for the NER system again.
Besides TLS, we consider a checkpoint-like function of UmuD and UmuC. After DNA damage, the induced UmuD and UmuC are thought to slow down DNA replication (44), allowing the cell to perform more excision repair. Once UmuD turns into UmuD′, it can no longer block replication. Therefore, we consider UmuD2 to be the key effecter:
 |
(6) |
When UmuD2 binds to Pol III and forms a complex, PolIII_UmuD, DNA replication is interfered. As a result, krep is reduced by a factor of rslow. Namely, the replication rate drops to krep/rslow.
RR
RR is found to be the major pathway filling the DSG (45). As shown in Fig. 1 b of the RR pathway, after the RecA-ssDNA filament is formed, RecA* can catalyze strand exchange between the lesion-containing DSG and the homologous double strand. Afterwards, the DSG is lesion free so that it can be filled up by normal replication. RR is also supposed to be involved in replication restart (reviewed in Michel et al. (16)). As shown in Fig. 1 a of the RR pathway, when the replication on the leading strand is blocked by a lesion, the replication on the lagging strand will continue for a certain distance (14). After the fork regression, the leading nascent strand may extend using the lagging nascent strand as template. The nascent strands then reanneal with the mother strands, and thereby the lesion is covered.
In our model, the DSG filling and replication restart processes by RR are described as follows:
 |
(7) |
 |
(8) |
We assume that the RR process would be stimulated only when the length of ssDNA-RecA filament reaches a certain threshold ThrRR. Two SOS genes, ruvA and ruvB, can catalyze branch migration (46) and may contribute to the RR process. However, so far the detailed mechanism of the RR pathway is not clear (16); we assume the RR rate constants krrDSG and krrRF are not induced by SOS response.
The parameters for this module are listed in Table 1.
We assume that an E. coli cell is a well-mixed biochemical reaction system. The SOS response process can be described with a series of elemental reactions. We use the exact stochastic method with Gillespie's algorithm (47) to do the simulation.
RESULTS
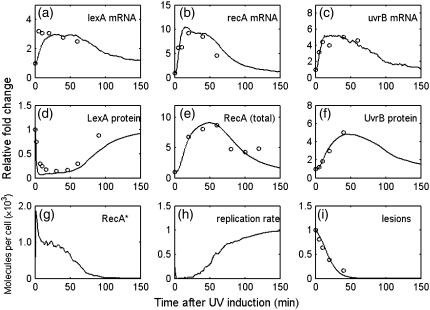
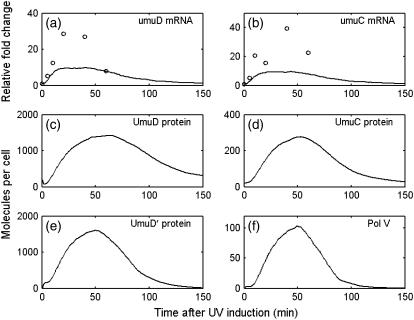
First we compare the simulation results to the population level experimental data. Fig. 4 shows the results of the average of 100 runs. Fig. 4, a–f, present the dynamics of lexA, recA, uvrB mRNA and protein levels. Fig. 4 g gives the dynamics of RecA* level. Fig. 4 h shows the replication rate after 20 J/m2 UV irradiation, relative to the normal speed. Fig. 4 i shows the relative fraction of lesions remained in the chromosome. In Fig. 4 i, the initial number of lesions is 2500, which corresponds to 40 J/m2 UV irradiation in our model. The simulation results fit well the experimental data (denoted by the circles in the figures), except for umuD and umuC mRNA (see Appendix). The reason for such disagreements is that the experimental data coming from different reports are not compatible. In the second module of our model, the protein production rate (ktr × M in Fig. 2) is proportional to the number of mRNA molecules M. According to the fact that the protein degradation rate constant kdp does not vary during the SOS response, the steady-state level of SOS protein Pst, which satisfies kdp × Pst = ktr × M, should be proportional to M. In the case of umuD and umuC induction, the mRNA level is measured to increase >20-fold (5), whereas the protein level only increases 10-fold (48). As a result, we only choose one result between the two to fit the parameters (see Appendix). Note that this kind of contradiction derives from different experimental conditions and different strains. Fortunately, it does not have significant contribution to the core results in our model.
FIGURE 4.
Averaging simulation results for 100 runs. (a–c) mRNA level, UV dose = 40 J/m2; (d) LexA protein level, UV dose = 20 J/m2; (e) RecA protein level (including RecA*), UV dose = 27 J/m2; (f) UvrB protein level, UV dose = 40 J/m2; (g) RecA* level, UV dose = 20 J/m2; (h) replication rate, UV dose = 20 J/m2; (i) lesions level, UV dose = 40 J/m2. Lines denote simulation results. Circles denote experimental data: (a–c) from Courcelle et al. (5); (d) from Sassanfar and Roberts (10); (e) from Voloshin et al. (57); (f and i) from Crowley and Hanawalt (32).
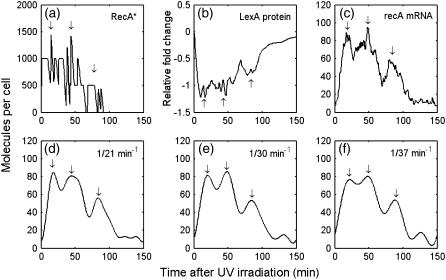
We now concentrate our study on single cell behavior. In single cell simulation the dynamics of recA mRNA is chosen to compare with the experimental results from Friedman et al. (11), in which the promoter activity of recA gene is found to show oscillatory-like behavior. Fig. 5 c shows the recA mRNA dynamics in one simulation. If we filter out the high frequency noise, the profile can be smoothed out, as shown in Fig. 5, d–f. In Fig. 5, d–f, the recA mRNA dynamics shows three peaks. As shown in Fig. 5, a and b, the modulation is derived from the fluctuation of RecA*. As RecA* goes up, LexA decreases, hence releasing the recA mRNA expression.
FIGURE 5.
Illustration of the recA mRNA modulation, a case study (a) RecA* level; (b) LexA protein relative level; (c) recA mRNA level; (d–f) filtering (c) with a cutoff frequency of 21 min−1, 30 min−1, 37 min−1, respectively. The six subgraphs are from a single simulation in UV dose = 50 J/m2. Arrows denote the peak position.
Note that if the cutoff frequency in the filtering process is shifted to a higher value, there will be more small peaks showing up. We consider this as noise that derived from stochastic fluctuation (49). We choose 1/30 min−1 as the cut-off frequency in the following simulation, which accords with the filtering frequency that is used in Friedman et al. (11) (1/32 min−1).
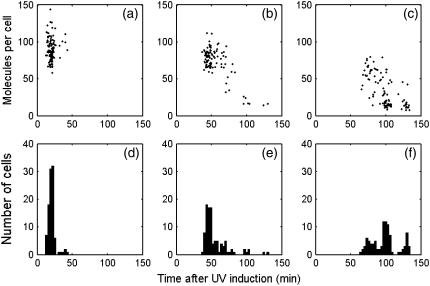
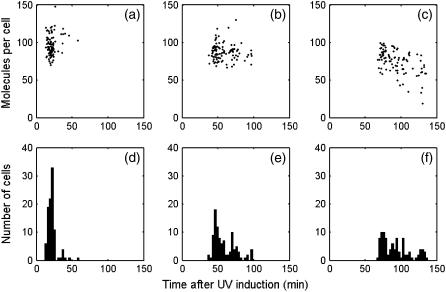
The distributions of the time and amplitude of the three peaks are illustrated in Fig. 6, a–c, which indicates the first, the second, and the third peaks, respectively. As shown in the histogram of the peak distribution in time (Fig. 6, d–f), the average interval between the first and second peaks is 35 min, with the standard deviation (SD) as 16 min. The average and SD of the interval between the second and third peaks are 47 and 23 min. This distribution is consistent with the experimental observation from Friedman et al., which also exhibits a peak interval of ∼40 min (11). The average amplitudes of the first and second peaks are 90 and 73, respectively. The average of the third peak drops to 33. This is not consistent with Friedman et al. (11), in which the modulation shows undamped characteristic. However, as discussed in the Appendix, if the NER rate kner is cut to half, undamped modulation shows up. As kner is determined by Crowley and Hanawalt (32), we suppose that the inconsistency is due to different NER efficiency between the strains used in Crowley, D. J., and P. C. Hanawalt (32) and Friedman et al. (11).
FIGURE 6.
recA mRNA dynamics statistic in 100 runs, UV dose = 50 J/m2. (a–c) The first, second, and third peak positions and amplitude distributions of the filtered recA mRNA profile. The cutoff frequency is 30 min−1. (d–f) Histograms of the first, second, and third peak positions.
Most of the parameters listed in Table 2 are determined by experimental data, whereas parameters in Table 1 are not known. We change the value of every undetermined parameter to see whether the modulation is sensitive to these values. Every time one parameter value (or two parameters; see Appendix for details) is multiplied or divided by 10. We find that the modulation is insensitive to most parameters except the parameters that are closely related to RecA* fluctuation or recA mRNA expression (see Appendix for details).
DISCUSSION
We have presented a model to describe the SOS response. As the details of the DNA replication coupled SOS-inducing signal control mechanism are considered, the model is able to simulate the process in single cell level. Simulation results are compared to both population level and single cell level experimental data. The model is able to describe various aspects of the SOS response, including the SOS gene induction, the DNA replication arrest and restart, the RecA activation and deactivation, the NER process, the TLS process, and the RR process, which all contribute to temporal modulation of SOS gene expression.
The fluctuation of RecA* activity leads to modulation in SOS gene promoter activity. The RecA* activity is in turn determined by the state of replication. When replication is blocked by a lesion, RecA* appears. On the other side, induced SOS genes would speed up removing the lesions or help the blocked replication to resume. This feedback is linked by the NER and TLS system. The RR system, which is not inducible in our model, is not considered. With the set of parameters that we use in the model, we are able to roughly compute the characteristic time of the accurate repair and the lesion-approved replication feedbacks, which are shown in Table 3. As many steps of the feedbacks actually overlap each other, the true feedback delay should be shorter than the total time we estimate. To reduce this inaccuracy, each overlapping step is considered to be the 70–90% of its maximum level (minimum level for LexA), with a reaction speed of 70–90% of the maximum. The “characteristic function time” of UvrB and Pol V are the time required that ensure them a 50% possibility to bind on the lesion that causes the replication stop. It is shown that the accurate repair feedback has a characteristic delay of ∼27 min, which can roughly explain why the first peak appears 20 min after radiation. The delay of lesion-approved replication is estimated to be ∼50 min, which is consistent with the experimental results that the mutations on the PolV-related genes mainly lead to changes of the second and the third peaks (11).
TABLE 3.
Estimation of the delays of the two feedbacks
| The accurate repair feedback
|
The error-approved replication feedback
|
||
|---|---|---|---|
| Process | Time cost | Process | Time cost |
| RecA* generation | 30 s | RecA* generation | 30 s |
| LexA decrease | 400 s | LexA decrease | 400 s |
| uvrB mRNA increase | 200 s | umuC mRNA increase | 1000 s |
| UvrB increase | 600 s | UmuC increase | 260 s |
| UvrB characteristic function time | 400 s | PolV characteristic function time | 1300 s |
| Total | 27 min | Total | 50 min |
The processes of umuD mRNA, UmuD, and UmuD′2 increase are not included in the table as their total time cost is shorter than that of the UmuC related processes. The binding of UmuD′2 and UmuC is much faster than other processes in the error-approved feedback. Therefore it is also neglected in the estimation.
Our model leads to two predictions. First, if the DNA repair rate is altered, the SOS response time changes. Therefore, the number of undamped peak changes. Second, if the cell suffers DNA double-strand break so that RecA binds to every break point simultaneously, such modulation may not exist.
The model we present has noticeable limitations though. Details of molecular mechanisms in DNA replication, replication arrest, and restart are still unclear (50). The process we described above is based on the recent knowledge, but there are still some missing links. For example, there are several proteins that function in regulating RecA filamentation process, such as DinI, RecX, RecFOR, and SSB (17,51,52). Because it is not clear how RecA would disassemble from ssDNA before replication restart, we just let RecA to do so automatically. The model can be enriched as long as new experimental findings come up.
APPENDIX
Gillespie algorithm
The exact stochastic simulation method developed by Gillespie has been widely used to simulate the biochemical reactions in vivo (53). Consider there are N chemical reactions taking place. A common formula of the reaction is
 |
(A1) |
In deterministic method, the dynamics of [A] can be described by an ordinary differential equation,
 |
(A2) |
whereas in the Gillespie algorithm, we define
 |
(A3) |
where a is proportional to the probability that reaction (Eq. A1) happens in a unit time interval. The algorithm is realized in four steps.
- Calculate the a for all reactions, and sum up all a.

(A4) Generate two random numbers, r1 and r2, between 0 and 1 from uniform distribution.
- The time interval t for next reaction to happen is determined by the following equation

(A5) - Take the m reaction to happen, which satisfies

(A6)
Then go to step 1 for next iteration.
Initially, the number of lesions (Nle) is determined by the incident UV dose (UVdose) in unit of J/m2 (27).
 |
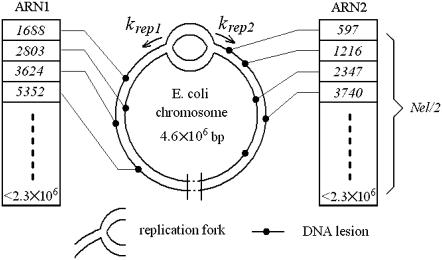
As shown in Fig. 7, two arrays of Nle/2 random numbers are generated evenly between 1 and 2.3 × 10⁶. These two arrays of random numbers (ARN) denote the position of the lesions that are distributed. When the NER reaction happens, a lesion is randomly chosen and removed from ARN.
FIGURE 7.
Scheme of two replication forks traveling on a damaged chromosome. Two replication forks progress at rates of krep1 and krep2, respectively. ARN1 and ARN2 store the position of the lesions. Each ARN is responsible for half of the chromosome, so the maximum position index is no more than 2.3 × 10⁶.
The reactions involved in our model are indicated in Eqs. 1–8 and Figs. 2 and 3. At the beginning of every iteration, parameters krep1, krep2, and ssDNA are reset according to the system state, as mentioned in the “Model description” section. For example, if NNC reaches the smallest number in ARN, which means the replication fork encounters a lesion, krep is set to be 0 and ssDNA is set to be 1. The system then evolves under the rules of the Gillespie algorithm.
UmuDC expression
The umuD and umuC mRNA and protein levels are shown in Fig. 8. According to Woodgate and Ennis (48), after SOS induction, the UmuD and UmuD′ protein levels are 1000 and 2000 molecules per cell, the UmuC protein level is 200 molecules per cell. PolV reaches about 60 molecules per cell (54).
FIGURE 8.
umuDC mRNA and protein levels, UV dose = 40 J/m2. (a) umuD mRNA level; (b) umuC mRNA level; (c) UmuD protein level; (d) UmuC protein level; (e) UmuD' protein level; (f) PolV (UmuD′2C) level. Lines denote simulation result. Circles denote experimental data (5).
The effect of changing NER efficiency
As shown in Fig. 9, if kner is set to be half as much as in Table 1, the SOS response time will be longer. In this case, the SOS response does not end before the third peak goes up, so the modulation shows undamped amplitudes.
FIGURE 9.
recA mRNA dynamics statistic in 100 runs, UV dose = 50 J/m2. (a–c) The first, second, and third peak positions and amplitude distributions of the filtered recA mRNA profile. The cutoff frequency is 30 min−1. (d–f) Histograms of the first, second, and third peak positions. kner is set to be half of that in Table 1.
Parameter analysis
Eighty-three groups of parameter changes, which are listed in Table 4, are chosen for sensitivity analysis. Parameters that are determined by experiments are not included. In some cases, to ensure that the protein average levels are in accord with experimental results, we change two parameter values simultaneously. For example, in parameter sets of number 13–18, the protein translation rate and degradation rate are changed simultaneously, so that the protein level is expected to remain unchanged. We also change the protein expression level via changing the gene transcription rate (see Nos. 19–28 in Table 4).
TABLE 4.
Parameters that are changed in 10-fold
| Serial number of parameter sets | Parameter value changes | Serial number of parameter sets | Parameter value changes |
|---|---|---|---|
| 1 | No changes | 2 | ThrRR/10 |
| 3 | kSL1_lexA/10, kSL2_lexA/10 | 4 | kSL1_lexA × 10, kSL2_lexA × 10 |
| 5 | kSL1_umuD/10, kSL2_umuD/10 | 6 | kSL1_umuD × 10, kSL2_umuD × 10 |
| 7 | kSL1_recA/10, kSL2_recA/10 | 8 | kSL1_recA × 10, kSL2_recA × 10 |
| 9 | kSL1_uvrB/10, kSL2_uvrB/10 | 10 | kSL1_uvrB × 10, kSL2_uvrB × 10 |
| 11 | kSL1_umuC/10, kSL2_umuC/10 | 12 | kSL1_umuC × 10, kSL2_umuC × 10 |
| 13 | ktr_uvrB/10, kdp_uvrB/10 | 14 | ktr_uvrB × 10, kdp_uvrB × 10 |
| 15 | ktr_lexA/10, kdp_lexA/10 | 16 | ktr_lexA × 10, kdp_lexA × 10 |
| 17 | ktr_recA/10, kdp_recA/10 | 18 | ktr_recA × 10, kdp_recA × 10 |
| 19 | ktc_lexA/10 | 20 | ktc_lexA × 10 |
| 21 | ktc_umuD/10 | 22 | ktc_umuD × 10 |
| 23 | ktc_recA/10 | 24 | ktc_recA × 10 |
| 25 | ktc_uvrB/10 | 26 | ktc_uvrB × 10 |
| 27 | ktc_umuC/10 | 28 | ktc_umuC × 10 |
| 29 | kClp/10 | 30 | kClp × 10 |
| 31 | kDD′dp/10 | 32 | kDD′dp × 10 |
| 33 | ThrTLS/10 | 34 | ThrTLS × 10 |
| 35 | kslow_on/10 | 36 | kslow_on × 10 |
| 37 | rslow/10 | 38 | rslow × 10 |
| 39 | kslow_off/10 | 40 | kslow_off × 10 |
| 41 | kreca_on/10 | 42 | kreca_on × 10 |
| 43 | kreca_off/10 | 44 | kreca_off × 10 |
| 45 | kner/10 | 46 | kner × 10 |
| 47 | ktls/10 | 48 | ktls × 10 |
| 49 | krrDSG/10 | 50 | krrDSG × 10 |
| 51 | krrRF/10 | 52 | krrRF × 10 |
| 53 | kDD1/10 | 54 | kDD1 × 10 |
| 55 | kDD2/10 | 56 | kDD2 × 10 |
| 57 | kD′D′1/10 | 58 | kD′D′1 × 10 |
| 59 | kD′D′2/10 | 60 | kD′D′2 × 10 |
| 61 | kD′D1/10 | 62 | kD′D1 × 10 |
| 63 | kD′D2/10 | 64 | kD′D2 × 10 |
| 65 | kD′C1/10 | 66 | kD′C1 × 10 |
| 67 | kD′C2/10 | 68 | kD′C2 × 10 |
| 69* | krecu_umuD2/10 | 70 | krecu_umuD2 × 10 |
| 71 | krecu_umuD/10 | 72 | krecu_umuD × 10 |
| 73 | kclexA/10 | 74 | kclexA × 10 |
| 75 | ktc_lexA × 10, ktr_lexA/10 | 76 | ktc_lexA/10, ktr_lexA × 10 |
| 77 | ktc_umuD × 10, ktr_umuD/10 | 78 | ktc_umuD/10, ktr_umuD × 10 |
| 79 | ktc_recA × 10, ktr_recA/10 | 80 | ktc_recA/10, ktr_recA × 10 |
| 81 | ktc_uvrB × 10, ktr_uvrB/10 | 82 | ktc_uvrB/10, ktr_uvrB × 10 |
| 83 | ktc_umuC × 10, ktr_umuC/10 | 84 | ktc_umuC/10, ktr_umuC × 10 |
krecu_umuD is the rate of RecA catalyzed UmuD cleavage, whereas krecu_umuD2 is the rate of RecA catalyzed UmuD2 cleavage.
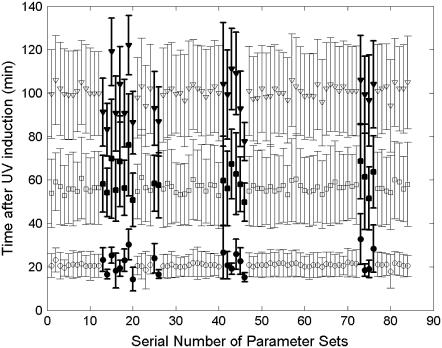
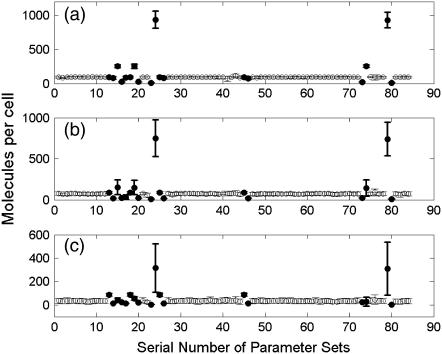
For each parameter set, recA mRNA dynamics is counted in 100 runs, UV dose = 50 J/m2. The cutoff frequency is 30 min−1. The statistical results of peak position and amplitude distributions are shown in Figs. 10 and 11, respectively. The modulation is insensitive to most parameters with some exceptions, which are listed in Table 5. As shown in Table 5, the modulation is mainly sensitive to the LexA protein level (Nos. 15, 16, 19, 20, 73, 74, 75, 76), NER process efficiency (Nos. 13, 14, 25, 26, 45, 46), and RecA activity (Nos. 17, 18, 23, 24, 41, 42, 43, 44, 79, 80). The active form of RecA, RecA* catalyzes LexA autocleavage. LexA in turn controls recA mRNA production rate. In our model, NER is the major repair pathway that rescues the stalled replication. As a result, the recA mRNA modulation profile, which is controlled by RecA* through LexA level, is affected mostly by NER efficiency.
FIGURE 10.
Parameters analysis for peak position distributions. For each parameter set, recA mRNA dynamics is counted in 100 runs, UV dose = 50 J/m2. The cutoff frequency is 30 min−1. The average of first (circle), second (square), and third (triangle) peak positions of the recA mRNA profile are shown. The ones that are different from the majority are highlighted in solid. Error bars are the mean ± SD of the peak positions.
FIGURE 11.
Parameters analysis for peak amplitude distributions. For each parameter set, recA mRNA dynamics is counted in 100 runs, UV dose = 50 J/m2. The cutoff frequency is 30 min−1. The average of first (a), second (b), and third (c) peak amplitudes of the recA mRNA profile are shown. The ones that are different from the majority are highlighted in solid. Error bars are the mean ± SD of the peak amplitudes.
TABLE 5.
Parameters that are sensitive to peak position or peak amplitude distributions
| Serial number of parameter sets | Parameter value changes | Sensitive to peak position or amplitude | Descriptions |
|---|---|---|---|
| 13 | ktr_uvrB/10, kdp_uvrB/10 | Both | UvrB protein translation and degradation rate |
| 14 | ktr_uvrB × 10, kdp_uvrB × 10 | ||
| 15 | ktr_lexA/10, kdp_lexA/10 | Both | LexA protein translation and degradation rate |
| 16 | ktr_lexA × 10, kdp_lexA × 10 | ||
| 17 | ktr_recA/10, kdp_recA/10 | Both | RecA protein translation and degradation rate |
| 18 | ktr_recA × 10, kdp_recA × 10 | ||
| 19 | ktc_lexA/10 | Both | lexA gene transcription rate |
| 20 | ktc_lexA × 10 | ||
| 23 | ktc_recA/10 | Peak amplitude | recA gene transcription rate |
| 24 | ktc_recA × 10 | ||
| 25 | ktc_uvrB/10 | Both | uvrB gene transcription rate |
| 26 | ktc_uvrB × 10 | ||
| 41 | kreca_on/10 | Peak position | RecA binding onto ssDAN |
| 42 | kreca_on × 10 | ||
| 43 | kreca_off/10 | Peak position | RecA unbinding from ssDNA |
| 44 | kreca_off × 10 | ||
| 45 | kner/10 | Both | NER |
| 46 | kner × 10 | ||
| 73 | kclexA/10 | Both | RecA catalyzed LexA cleavage |
| 74 | kclexA × 10 | ||
| 75 | ktc_lexA × 10, ktr_lexA/10 | Peak position | lexA gene transcription and LexA protein translation rate |
| 76 | ktc_lexA/10, ktr_lexA × 10 | ||
| 79 | ktc_recA × 10, ktr_recA/10 | Peak amplitude | recA gene transcription and RecA protein translation rate |
| 80 | ktc_recA/10, ktr_recA × 10 |
Editor: Alex van Oudenaarden.
References
- 1.Setlow, R. B., P. A. Swenson, and W. L. Carrier. 1963. Thymine dimers and inhibition of DNA synthesis by ultraviolet irradiation of cells. Science. 142:1464–1466. [DOI] [PubMed] [Google Scholar]
- 2.Setlow, R. B., and W. L. Carrier. 1964. The disappearance of thymine dimers from DNA: an error-correcting mechanism. Proc. Natl. Acad. Sci. USA. 51:226–231. [DOI] [PMC free article] [PubMed] [Google Scholar]
- 3.Friedberg, E. C., C. W. Graham, and W. Siede. 1995. DNA Repair and Mutagenesis. ASM Press, Washingtion, DC.
- 4.Walker, G. C. 2005. Lighting torches in the DNA repair field: development of key concepts. Mutat. Res. 577:14–23. [DOI] [PubMed] [Google Scholar]
- 5.Courcelle, J., A. Khodursky, B. Peter, P. O. Brown, and P. C. Hanawalt. 2001. Comparative gene expression profiles following UV exposure in wild-type and SOS-deficient Escherichia coli. Genetics. 158:41–64. [DOI] [PMC free article] [PubMed] [Google Scholar]
- 6.Crowley, D. J., and J. Courcelle. 2002. Answering the call: coping with DNA damage at the most inopportune time. J. Biomed. Biotechnol. 2:66–74. [DOI] [PMC free article] [PubMed] [Google Scholar]
- 7.Aksenov, S. V., E. A. Krasavin, and A. A. Litvin. 1997. Mathematical model of the SOS response regulation of an excision repair deficient mutant of Escherichia coli after ultraviolet light irradiation. J. Theor. Biol. 186:251–260. [DOI] [PubMed] [Google Scholar]
- 8.Aksenov, S. V. 1999. Induction of the SOS response in ultraviolet-irradiated Escherichia coli analyzed by dynamics of LexA, RecA and SulA proteins. J. Biol. Phys. 25:263–277. [DOI] [PMC free article] [PubMed] [Google Scholar]
- 9.Dasika, M. S., A. Gupta, and C. D. Maranas. 2005. DEMSIM: a discrete event based mechanistic simulation platform for gene expression and regulation dynamics. J. Theor. Biol. 232:55–69. [DOI] [PubMed] [Google Scholar]
- 10.Sassanfar, M., and J. W. Roberts. 1990. Nature of the SOS-inducing signal in Escherichia coli: the involvement of DNA replication. J. Mol. Biol. 212:79–96. [DOI] [PubMed] [Google Scholar]
- 11.Friedman, N., S. Vardi, M. Ronen, U. Alon, and J. Stavans. 2005. Precise temporal modulation in the response of the SOS DNA repair network in individual bacteria. PLoS Biol. 3:1261–1268. [DOI] [PMC free article] [PubMed] [Google Scholar]
- 12.Lahav, G., N. Rosenfeld, A. Sigal, N. Geva-Zatorsky, A. J. Levine, M. B. Elowitz, and U. Alon. 2004. Dynamics of the p53-Mdm2 feedback loop in individual cells. Nat. Genet. 36:147–150. [DOI] [PubMed] [Google Scholar]
- 13.Ma, L., J. Wagner, J. J. Rice, W. Hu, A. J. Levine, and G. A. Stolovitzky. 2005. A plausible model for the digital response of p53 to DNA damage. Proc. Natl. Acad. Sci. USA. 102:14266–14271. [DOI] [PMC free article] [PubMed] [Google Scholar]
- 14.Pages, V., and R. P. Fuchs. 2003. Uncoupling of leading- and lagging-strand DNA replication during lesion bypass in vivo. Science. 300:1300–1303. [DOI] [PubMed] [Google Scholar]
- 15.Courcelle, J., J. J. Belle, and C. T. Courcelle. 2004. When replication travels on damaged templates: bumps and blocks in the road. Res. Microbiol. 155:231–237. [DOI] [PubMed] [Google Scholar]
- 16.Michel, B., G. Grompone, M. J. Flores, and V. Bidnenko. 2004. Multiple pathways process stalled replication forks. Proc. Natl. Acad. Sci. USA. 101:12783–12788. [DOI] [PMC free article] [PubMed] [Google Scholar]
- 17.Morimatsu, K., and S. C. Kowalczykowski. 2003. RecFOR proteins load RecA protein onto gapped DNA to accelerate DNA strand exchange: a universal step of recombinational repair. Mol. Cell. 11:1337–1347. [DOI] [PubMed] [Google Scholar]
- 18.Friedberg, E. C., A. R. Lehmann, and R. P. P. Fuchs. 2005. Trading places: how do DNA polymerases switch during translesion DNA synthesis. Mol. Cell. 18:499–505. [DOI] [PubMed] [Google Scholar]
- 19.Hishida, T., Y. W. Han, T. Shibata, Y. Kubota, Y. Ishino, H. Iwasaki, and H. Shinagawa. 2004. Role of the Escherichia coli RecQ DNA helicase in SOS signaling and genome stabilization at stalled replication forks. Genes Dev. 18:1886–1897. [DOI] [PMC free article] [PubMed] [Google Scholar]
- 20.Cox, M. M. 2003. The bacterial RecA protein as a motor protein. Annu. Rev. Microbiol. 57:551–577. [DOI] [PubMed] [Google Scholar]
- 21.Courcelle, J., and P. C. Hanawalt. 2003. Reca-dependent recovery of arrested DNA replication forks. Annu. Rev. Genet. 37:611–646. [DOI] [PubMed] [Google Scholar]
- 22.Kreuzer, K. N. 2005. Interplay between DNA replication and recombination in prokaryotes. Annu. Rev. Microbiol. 59:43–67. [DOI] [PubMed] [Google Scholar]
- 23.Little, J. W. 1991. Mechanism of specific LexA cleavage: autodigestion and the role of RecA coprotease. Biochimie. 73:411–421. [DOI] [PubMed] [Google Scholar]
- 24.Luo, Y., R. A. Pfuetzner, S. Mosimann, M. Paetzel, E. A. Frey, M. Cherney, B. Kim, J. W. Little, and N. C. Strynadka. 2001. Crystal structure of LexA: a conformational switch for regulation of self-cleavage. Cell. 106:585–594. [DOI] [PubMed] [Google Scholar]
- 25.Shinagawa, H., H. Iwasaki, T. Kato, and A. Nakata. 1988. RecA protein-dependent cleavage of UmuD protein and SOS mutagenesis. Proc. Natl. Acad. Sci. USA. 85:1806–1810. [DOI] [PMC free article] [PubMed] [Google Scholar]
- 26.Schlacher, K., P. Pham, M. M. Cox, and M. F. Goodman. 2006. Roles of DNA polymerase V and RecA protein in SOS damage-induced mutation. Chem. Rev. 106:406–419. [DOI] [PubMed] [Google Scholar]
- 27.Rupp, W. D., and P. Howard-Flanders. 1968. Discontinuities in the DNA synthesized in a excision-defective strain of Escherichia coli following ultraviolet irradiation. J. Mol. Biol. 31:291–304. [DOI] [PubMed] [Google Scholar]
- 28.Langston, L. D., and M. O'Donnell. 2006. DNA replication: keep moving and don't mind the gap. Mol. Cell. 23:155–160. [DOI] [PubMed] [Google Scholar]
- 29.Setty, Y., A. E. Mayo, M. G. Surette, and U. Alon. 2003. Detailed map of a cis-regulatory input function. Proc. Natl. Acad. Sci. USA. 100:7702–7707. [DOI] [PMC free article] [PubMed] [Google Scholar]
- 30.Mohana-Borges, R., A. B. F. Pacheco, F. J. R. Sousa, D. Foguel, D. F. Almeida, and J. L. Silva. 2000. LexA repressor forms stable dimers in solution. J. Biol. Chem. 275:4708–4712. [DOI] [PubMed] [Google Scholar]
- 31.Truglio, J. J., D. L. Croteau, B. V. Houten, and C. Kisker. 2006. Prokaryotic nucleotide excision repair: the UvrABC system. Chem. Rev. 106:233–252. [DOI] [PubMed] [Google Scholar]
- 32.Crowley, D. J., and P. C. Hanawalt. 1998. Induction of the SOS response increases the efficiency of global nucleotide excision repair of cyclobutane pyrimidine dimers, but Not 6–4 photoproducts, in UV-irradiated Escherichia coli. J. Bacteriol. 180:3345–3352. [DOI] [PMC free article] [PubMed] [Google Scholar]
- 33.Courcelle, J., D. J. Crowley, and P. C. Hanawalt. 1999. Recovery of DNA replication in UV-irradiated Escherichia coli requires both excision repair and RecF protein function. J. Bacteriol. 181:916–922. [DOI] [PMC free article] [PubMed] [Google Scholar]
- 34.Howard-Flanders, P., L. Theriot, and J. B. Stedeford. 1969. Some properties of excision-defective recombination-deficient mutants of Escherichia coli K-12. J. Bacteriol. 97:1134–1141. [DOI] [PMC free article] [PubMed] [Google Scholar]
- 35.Courcelle, J., J. R. Donaldson, K. H. Chow, and C. T. Courcelle. 2003. DNA damage-induced replication fork regression and processing in Escherichia coli. Science. 299:1064–1067. [DOI] [PubMed] [Google Scholar]
- 36.Tippin, B., P. Pham, and M. F. Goodman. 2004. Error-prone replication for better or worse. Trends Microbiol. 12:288–295. [DOI] [PubMed] [Google Scholar]
- 37.Courcelle, C. T., J. J. Belle, and J. Courcelle. 2005. Nucleotide excision repair or polymerase V-mediated lesion bypass can act to restore UV-arrested replication forks in Escherichia coli. J. Bacteriol. 187:6953–6961. [DOI] [PMC free article] [PubMed] [Google Scholar]
- 38.Gonzalez, M., and R. Woodgate. 2002. The “tale” of UmuD and its role in SOS mutagenesis. Bioessays. 24:141–148. [DOI] [PubMed] [Google Scholar]
- 39.Frank, E. G., D. G. Ennis, M. Gonzalez, A. S. Levine, and R. Woodgate. 1996. Regulation of SOS mutagenesis by proteolysis. Proc. Natl. Acad. Sci. USA. 93:10291–10296. [DOI] [PMC free article] [PubMed] [Google Scholar]
- 40.Frank, E. G., M. Gonzalez, D. G. Ennis, A. S. Levine, and R. Woodgate. 1996. In vivo stability of the Umu mutagenesis proteins: a major role for RecA. J. Bacteriol. 178:3550–3556. [DOI] [PMC free article] [PubMed] [Google Scholar]
- 41.Neher, S. B., R. T. Sauer, and T. A. Baker. 2003. Distinct peptide signals in the UmuD and UmuD′ subunits of UmuD/D′ mediate tethering and substrate processing by the ClpXP protease. Proc. Natl. Acad. Sci. USA. 100:13219–13224. [DOI] [PMC free article] [PubMed] [Google Scholar]
- 42.Fujii, S., and R. P. Fuchs. 2004. Defining the position of the switches between replicative and bypass DNA polymerases. EMBO J. 23:4342–4352. [DOI] [PMC free article] [PubMed] [Google Scholar]
- 43.Pham, P., J. G. Bertram, M. O'Donnell, R. Woodgate, and M. F. Goodman. 2001. A model for SOS-lesion-targeted mutations in Escherichia coli. Nature. 409:366–370. [DOI] [PubMed] [Google Scholar]
- 44.Opperman, T., S. Murli, B. Smith, and G. C. Walker. 1999. A model for a umuDC-dependent prokaryotic DNA damage checkpoint. Proc. Natl. Acad. Sci. USA. 96:9218–9223. [DOI] [PMC free article] [PubMed] [Google Scholar]
- 45.Berdichevsky, A., L. Izhar, and Z. Livneh. 2002. Error-free recombinational repair predominates over mutagenic translesion replication in E. coli. Mol. Cell. 10:917–924. [DOI] [PubMed] [Google Scholar]
- 46.West, S. C. 1997. Processing of recombination intermediates by the RuvABC proteins. Annu. Rev. Genet. 31:213–244. [DOI] [PubMed] [Google Scholar]
- 47.Gillespie, D. T. 1977. Exact stochastic simulation of coupled chemical reactions. J. Phys. Chem. 81:2340–2361. [Google Scholar]
- 48.Woodgate, R., and D. G. Ennis. 1991. Levels of chromosomally encoded Umu proteins and requirements for in vivo UmuD cleavage. Mol. Gen. Genet. 229:10–16. [DOI] [PubMed] [Google Scholar]
- 49.Karn, M., T. C. Elston, W. J. Blake, and J. J. Collins. 2005. Stochasticity in gene expression: from theories to phenotypes. Nat. Rev. Genet. 6:451–464. [DOI] [PubMed] [Google Scholar]
- 50.Friedberg, E. C. 2005. Suffering in silence: the tolerance of DNA damage. Nat. Rev. Mol. Cell Biol. 6:943–953. [DOI] [PubMed] [Google Scholar]
- 51.Lusetti, S. L., O. N. Voloshin, R. B. Inman, R. D. Camerini-Otero, and M. M. Cox. 2004. The DinI protein stabilizes RecA protein filaments. J. Biol. Chem. 279:30037–30046. [DOI] [PubMed] [Google Scholar]
- 52.Dress, J. C., S. L. Lusetti, S. Chitteni-Pattu, R. B. Inman, and M. M. Cox. 2004. A RecA filament capping mechanism for RecX protein. Mol. Cell. 15:789–798. [DOI] [PubMed] [Google Scholar]
- 53.Turner, T. E., S. Schnell, and K. Burrage. 2004. Stochastic approaches for modelling in vivo reactions. Comput. Biol. Chem. 28:165–178. [DOI] [PubMed] [Google Scholar]
- 54.Sommer, S., F. Boudsocq, R. Devoret, and A. Bailone. 1998. Specific RecA amino acid changes affect RecA-UmuD'C interaction. Mol. Microbiol. 28:281–291. [DOI] [PubMed] [Google Scholar]
- 55.Arenson, T. A., O. V. Tsodikov, and M. M. Cox. 1999. Quantitative analysis of the kinetics of end-dependent disassembly of RecA filaments from ssDNA. J. Mol. Biol. 288:391–401. [DOI] [PubMed] [Google Scholar]
- 56.Bernstein, J. A., A. B. Khodursky, P. Lin, S. Lin-Chao, and S. N. Cohen. 2002. Global analysis of mRNA decay and abundance in Escherichia coli at single-gene resolution using two-color fluorescent DNA microarrays. Proc. Natl. Acad. Sci. USA. 99:9697–9702. [DOI] [PMC free article] [PubMed] [Google Scholar]
- 57.Voloshin, O. N., B. E. Ramirez, A. Bax, and R. D. Camerini-Otero. 2001. A model for the abrogation of the SOS response by an SOS protein: a negatively charged helix in DinI mimics DNA in its interaction with RecA. Genes Dev. 15:415–427. [DOI] [PMC free article] [PubMed] [Google Scholar]


