Abstract
Previously, an assay called conformation sensitive gel electrophoresis (CSGE) was developed for scanning PCR products for the presence of single-base and larger base mismatches in DNA. The assay was based on the assumption that mildly denaturing solvents in an appropriate buffer can accentuate the conformational changes produced by single-base mismatches in double-stranded DNA and thereby increase the differential migration in electrophoretic gels of heteroduplexes and homoduplexes. Here the sensitivity of assays by CSGE was improved by limiting the maximal size of the PCR products to 450 bp and making several changes in the conditions for PAGE. With the improved conditions, CSGE detected all 76 previously identified single-base changes in a large series of PCR products from collagen genes that contain multiple exons with highly repetitive and GC-rich sequences. In a survey of 736 alleles of collagen genes, CSGE detected 223 unique single-base mismatches that were confirmed by nucleotide sequencing. CSGE has the advantage over other methods for scanning PCR products in that it is simple, requires no special preparation of PCR products, has a large capacity, and does not use radioactivity.
Single-base changes are the most commonly occurring mutations in eukaryotic genomes and in genetic diseases. Many of the mutations, however, are in large and complex genes. Also, most disease-causing mutations are private in the sense that unrelated individuals may have one of several hundred different mutations in the same gene that produce similar disease phenotypes (1, 2). As a result, detection of single-base changes in large and complex genes remains a formidable technical challenge, and there has been a continuing search for rapid and efficient methods for detecting such mutations (see refs. 3–7).
The most commonly used strategy for detecting single-base mutations in large and complex genes is to amplify sequences of genes of interest by PCR, scan the PCR products for the presence of mutations by a rapid procedure, and then sequence the PCR products that were positive by the scanning technique. The scanning techniques most commonly used for PCR products are single-strand conformation polymorphism (8), enzymatic or chemical cleavage of mismatched base pairs (3, 9–14), and differential unfolding of homoduplexes and heteroduplexes by denaturing gradient gel electrophoresis (DGGE) (15, 16). Because the sequence context of a nucleotide change has an important effect on the sensitivity of detection by any of the commonly used methods, a large number of sequence contexts need to be assayed to ensure that a given PCR scanning procedure can detect all possible nucleotide changes. In addition, the scanning technique for PCR products must be simple and practical for the screening of a large number of samples under highly reproducible conditions. Of the currently available techniques for scanning PCR products, single-strand conformation polymorphism (8) is among the most commonly used. However, the assay is not reliable with fragments of greater than about 200 bp, and the sensitivity is estimated to range from about 60% to 95% (3, 4, 6–8). Another commonly used procedure is DGGE. The procedure is highly sensitive, but it requires the use of GC clamps in one of the primers for each PCR product and a considerable effort to optimize conditions for analysis of a given gene (15–18). Still another scanning procedure is to assay for differential migration by gel electrophoresis of homoduplexes and heteroduplexes containing base mismatches (19–25). A protocol for detection of heteroduplexes by CSGE was suggested previously (22–25) as a relatively simple and practical procedure for the scanning of complex genes for mutations. Here we have compared CSGE with both DGGE and nucleotide sequencing for detection of base mismatches in several complex collagen genes that are challenging targets for assay of mutations because they contain multiple exons with sequences that are both repetitive and GC rich.
METHODS
PCR Products from Human Genes.
PCR products were synthesized by amplification of exons of six collagen genes: COL1A1, COL1A2, COL2A1, COL3A1, COL9A1, and COL9A2 (see ref. 26). For CSGE, PCR primers were designed to target sequences flanking one or more exons of the gene so as to generate PCR products that were 200–450 bp. The PCR products for CSGE typically contained 20 bp of the forward primer, at least 40 bp of the 5′-flanking sequences of a target sequence, the target sequence, at least 40 bp of the 3′-flanking sequences of the target sequence, and 20 bp of the reverse primer. Here the target sequence was an exon plus at least 20 bp of 5′-flanking and 6 bp of 3′-flanking sequences. The primers were based on previously determined sequences for the COL1A1 (27–29), COL1A2 (29), COL2A1 (30), COL3A1 (H. Kuivaniemi and G. Tromp, personal communication), COL9A1, and COL9A2 genes (T.P., M. Vuoristo, S.A., M. Perälä, D.J.P., and L.A.-K., unpublished work). For DGGE, specific regions of the COL1A1 and COL2A1 genes were amplified by PCR with primers designed on the basis of published sequences (29–31) to generate PCR products that were 211–528 bp with a 40-bp GC-clamp added to the 5′-end of one of the PCR primers (17, 18, 31). The melting profiles of the predicted products were estimated with a program devised by Lerman and Silverstein (32). Typically, PCR amplifications were carried out in a reaction volume of 40 μl containing 50–100 ng of genomic DNA, 200 μM of each dNTP, 0.25 μM of each primer, and 1 unit of Taq polymerase (AmpliTaq Gold; Perkin–Elmer). The PCR conditions were an initial denaturation at 95°C for 10 min, followed by 95°C for 40 sec, 56–60°C for 40 sec, and 72°C for 40 sec for 30–35 cycles, and a final extension 72°C for 10 min in an automated thermocycler (either GeneAmp 9600, Perkin–Elmer or PTC 225 DNA Engine Tetrad, MJ-Research, Inc., Watertown, MA). From the 40-μl reaction volume, an aliquot of 5 μl was used to check the concentration and the quality of the PCR products by agarose gel electrophoresis. To generate heteroduplexes, the samples were denatured at 95°C for 5 min and annealed at 68°C for 30 min. From 2 to 15 μl (50–100 ng) was used for analysis by DGGE or CSGE.
Scanning of the PCR Products by DGGE.
For DGGE, conditions were essentially the same as those described by other authors (15, 16) and adapted for the COL2A1 gene (17, 18). The gel consisted of 9% polyacrylamide and a denaturing gradient that was prepared with 0%–80% stock solutions of 7 M urea and 40% formamide. The gradient gels were poured from two mixing chambers over 4–5 min (15). Electrophoresis was carried out at 150 V at 60°C in a chamber with circulating buffer. The running time for electrophoresis for different PCR products varied from 7 to 30 hr (17, 18, 31). The gel frames, plates, spacers, and combs were purchased from CBS Scientific Company (Del Mar, CA). The gel was stained in 1 μg/ml ethidium bromide for 15 min and destained twice in water for 2–10 min.
Scanning of the PCR Products by CSGE.
For heteroduplex analysis by CSGE (22, 23), PCR products were electrophoresed in a 1-mm thick gel with 37-well comb (FMC) prepared with 10 or 15% polyacrylamide, 99:1 ratio of acrylamide (Intermountain Scientific, Kaysville, UT) to 1,4-bis(acryloyl)piperazine (Fluka), 10% ethylene glycol (Sigma), 15% formamide (GIBCO), 0.1% ammonium persulfate (U.S. Biochemicals), and 0.07% N,N,N′,N′-tetramethylethylenediamine (Sigma) in 0.5× TTE buffer (44 mM Tris/14.5 mM Taurine/0.1 mM EDTA buffer, pH 9.0). It was important not to autoclave the TTE buffer to obtain optimal separation of heteroduplexes and homoduplexes. The optimal polymerization time was about 1 hr. PCR products containing heteroduplexes were mixed with 3 μl of 10× stock loading buffer (10× stock solution of 30% glycerol/0.25% bromphenol blue/0.25% xylene cyanol FF). Samples were separated by electrophoresis on a standard DNA sequencing gel apparatus with 37.5 × 45-cm glass plates using 0.5× TTE as the electrode buffer. Typically, a comb for 37 lanes was used, and up to five PCR products of different sizes were mixed and loaded in each lane. The gel was pre-electrophoresed for 15 min, and the samples were separated at room temperature using power as a limiting factor during the run with 40 W and 6 hr for 10% gels, or 40 W and 8.5 hr for 15% gels. After electrophoresis, the gel was stained on the glass plate in 1 μg/ml of ethidium bromide for 10 min followed by destaining in water. A hand-held UV torch was used to visualize the bands. The relevant section of the gel was cut, transferred to a piece of blotting paper, and then released from the paper onto the surface of a transilluminator by wetting with water. The gel was photographed with either a Polaroid camera or high-quality charge-coupled-device camera for gel documentation (Fotodyne, New Berlin, WI).
Nucleotide Sequencing of PCR Products.
PCR products were analyzed either by manual sequencing (T7 Sequenase PCR Product Sequencing Kit, United States Biochemical) or by automated sequencing (ABI PRISM 377 Sequencer, Perkin–Elmer; ABI PRISM Dye Terminator Cycle Sequencing Ready Kit with AmpliTaq DNA polymerase, FS, Perkin–Elmer). Before sequencing, the samples were treated with exonuclease I to degrade the residual PCR primers and shrimp alkaline phosphatase to dephosphorylate the residual nucleotides (33, 34). PCR products that contained deletions or insertions in one allele were sequenced after they were cloned into a plasmid (pT7 Blue T-Vector Kit, Novagen).
RESULTS
Improved Conditions for Mutation Detection by CSGE.
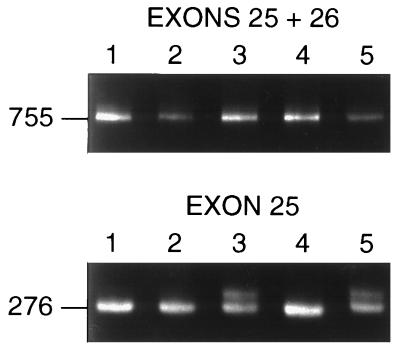
Initial data (22) suggested that PCR products of up to 800 bp were appropriate for assay by CSGE. However, a common single-base polymorphism in exon 25 of the COL1A2 gene (35) was not detected in a PCR product of 755 bp that spanned both exons 25 and 26 (Fig. 1). Here, the polymorphism was readily detected with new primers that were designed so as to reduce the size of the PCR products to less than 300 bp (Fig. 1).
Figure 1.
The effect of product size on detection of sequence variations by CSGE. (Upper) CSGE analysis of a 755-bp PCR product that contains sequences for exons 25 and 26 of the COL1A1 gene. No heteroduplexes are detected. (Lower) CSGE analysis of a 276-bp PCR product that contains sequences for exon 25 of the same gene. DNA from the same five individuals were analyzed in both panels. Heteroduplexes were detected in samples 3 and 5.
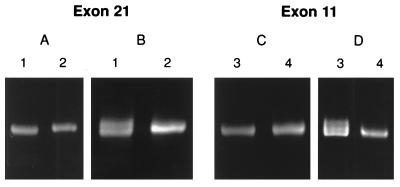
In further experiments we explored the effect of varying the electrophoretic conditions. A G−12IVS20A polymorphism in a product containing exon 21 of the COL1A1 gene (29) was difficult to detect under previously described conditions (22) even in fragments that were less than 400 bp. However, we found that the polymorphism was more readily detected when the electrophoretic conditions were changed from 400 V for 18 hr (Fig. 2A) to 40 W for 6 hr (Fig. 2B).
Figure 2.
(A and B) Effect of electrophoretic conditions on separation of heteroduplexes from PCR products of exon 21 from the COL1A1 gene. (A) Separation on a 10% polyacrylamide gel at 400 V for 18 hr. (B) Same samples as in A separated on a 10% polyacrylamide gel at 40 W for 6 hr. Sample 1 has a polymorphism. (C) Electrophoresis in a 10% polyacrylamide gel at 40 W for 6 hr. (D) Same samples as in C separated in a 15% polyacrylamide gel at 40 W for 8.5 hr. Sample 3 has a polymorphism.
In still further experiments, we explored the effects of increasing the polyacrylamide concentration of the CSGE gels from 10% to 15%, and increasing the electrophoresis time from 6 hr to 8.5 hr. A G+62IVS11A polymorphism in a product containing exon 11 of the COL1A1 gene was difficult to detect or not detected (Fig. 2C) under the originally described conditions (22). The same polymorphism was detected when the polymer concentration in the gel was increased to 15% and the electrophoretic conditions were changed to 40 W for 8.5 hr (Fig. 2D). To test the sensitivity of 15% gels and the electrophoretic conditions of 40 W for 8.5 hr, we analyzed more than 200 single-base changes in the collagen genes that were previously detected by using 10% gels and the conditions of 400 V for 18 hr or 40 W for 6 hr. The separations between homoduplexes and heteroduplexes were greater using 15% gels and 40 W for 8.5 hr than the other two conditions (not shown).
Based on these observations, the following conditions were used for scanning PCR products by CSGE: (a) PCR primers were designed so as to generate products of 200–450 bp instead of products as large as 800 bp; (b) electrophoresis was for 8.5 hr at 40 W; and (c) 15% polyacrylamide gels were used.
Detection of Mismatches in High-Melting Domains.
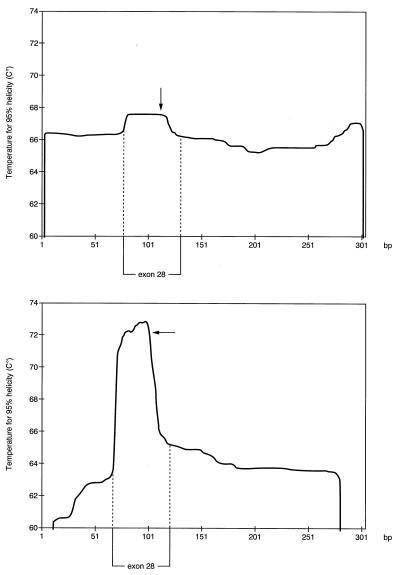
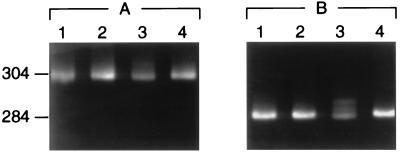
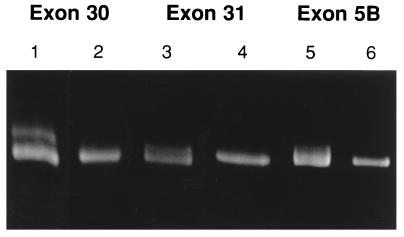
Previously, it was suggested (22) that failure to detect a few mismatches by CSGE was explained by the mismatches being present in high melting domains of double-stranded DNA as defined by Lerman and Silverstein (32). Here we added a 10-bp GC-sequence to both ends of a PCR product for exon 28 of the COL3A1 gene to move one single-base change out of the high melting domain (Fig. 3A and B). Detection of the mismatch was not improved under the previous CSGE protocol (Fig. 4A). However, the mismatch in a PCR product not containing a GC clamp was detected with the improved conditions (Fig. 4B). Similarly, three additional single-base mismatches in high-melting domains of collagen genes (22) that either were not detected or were poorly detected with the previous protocol were readily detected here by using the improved conditions (Fig. 5).
Figure 3.
Melting profile for a PCR product containing sequences for exon 28 of the COL3A1 gene. (Upper) Melting profile after addition of 10-bp GC clamps to the 5′-end and 3′-end of the product. (Lower) Melting profile for the native sequence without GC clamps. Arrows indicate the site of a single-base mismatch.
Figure 4.
CSGE analysis of the PCR products for exon 28 of the COL3A1 gene. (A) PCR samples with 10-bp GC clamps. (B) Same PCR product without GC clamps. Heteroduplexes caused by a C to T polymorphism in sample 3 are seen only in B.
Figure 5.
Detection of sequence variations in high-melting domains in exon 30 (C to A) and exon 31 (G to A) of the COL3A1 gene, and exon 5B (A to C) of the COL2A1 gene. Previously not detected or poorly detected sequence variations (22) were detected here in samples 1, 3, and 5 by using 15% polyacrylamide gels and 40 W/8.5 hr. Samples 2, 4, and 6 are controls.
Detection of Previously Identified Single-Base Mismatches.
To test the sensitivity of CSGE, the assay was used with PCR products from four human collagen genes in which 76 separate neutral polymorphisms and disease-causing mutations were previously identified. The nucleotide changes were identified by complete nucleotide sequencing of 12 kb of both alleles of the COL1A1 gene from eight unrelated individuals (29); sequencing of cDNAs for the COL1A1, COL1A2, and COL3A1 genes in probands with osteogenesis imperfecta and type IV Ehlers-Danlos syndrome (see ref. 22); assays by DGGE of the COL1A1 gene in probands with osteogenesis imperfecta (31); and assays by DGGE of the COL2A1 gene in probands with chondrodysplasias and osteoarthritis (17, 18). Most of the changes were single-base substitutions. As indicated in Table 1, the CSGE assay detected all 76 of the polymorphisms and mutations.
Table 1.
Sensitivity of CSGE for detection of polymorphisms and mutations
| Gene | Known polymorphisms and mutations
|
Heteroduplexes by CSGE (detected/assayed) | |
|---|---|---|---|
| Exon sequences | Intron sequences | ||
| COL1A1 | 18 | 22 | 40/40* |
| COL1A2 | 10 | 0 | 10/10 |
| COL2A1 | 8 | 15 | 23/23 |
| COL3A1 | 3 | 0 | 3/3 |
| Totals | 39 | 37 | 76/76 |
One single-base polymorphism in intron 21 of the COL1A1 gene was consistently detected with a PCR product spanning exon 22 but inconsistently detected with an overlapping PCR product spanning exon 21.
Nucleotide Sequencing of Heteroduplex PCR Products.
To test the assay further, a series of PCR products that generated heteroduplexes in the CSGE assay were sequenced. PCR products from the COL1A1 gene or both the COL1A1 and COL1A2 genes were assayed from 85 individuals; PCR products from the COL2A1 gene were from 23 individuals; and PCR products from the COL9A1 or both the COL9A1 and COL9A2 genes were from 95 individuals (Table 2). PCR products that generated 223 different heteroduplexes by CSGE were sequenced. All were found to have at least one base mismatch. As controls, more than 200 PCR products from the same genes that generated only homoduplexes also were sequenced. None contained a base mismatch. Therefore, CSGE assay apparently did not generate a significant number of false-positive or false-negative results.
Table 2.
Nucleotide sequencing of PCR products that generated heteroduplexes by CSGE
| Gene | PCR products per gene | Alleles assayed | Unique mismatches detected*
|
|
|---|---|---|---|---|
| CSGE | Nucleotide sequencing | |||
| COL1A1 | 54 | 170 | 78 | 78 |
| COL1A2 | 55 | 140 | 43 | 43 |
| COL2A1 | 50 | 46 | 36 | 36 |
| COL9A1 | 34 | 190 | 40 | 40 |
| COL9A2 | 31 | 190 | 26 | 26 |
| Totals | 736 | 223 | 223 | |
Some PCR products contained more than one single-base mismatch (see Fig. 6).
Detection of Multiple Single-Base Mismatches in the Same PCR Product.
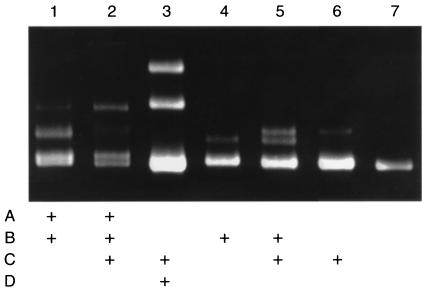
Comparison of data from repeated assays indicated that the same mismatch in the same PCR products usually generated one or more heteroduplex bands of the same relative mobility. For example, the two mismatches generated heteroduplexes of the same mobility when presented separately or together in the same PCR product (Fig. 6, lanes 4–6). However, the relative mobility of one heteroduplex in some PCR products was altered by the presence of a second mismatch. For example, the relative migration of the heteroduplex from mismatch B (Fig. 6, lane 4) was altered by the presence of the mismatch A (Fig. 6, lane 1) and the presence of the two additional mismatches A and C (Fig. 6, lane 2). Therefore, the assay frequently detected the presence of a second or even a third mismatch in the same PCR product by appearance of new heteroduplex bands.
Figure 6.
Detection of more than one base mismatch in PCR products for exon 30 of the COL1A1 gene. The PCR products of 236 bp each were obtained from seven unrelated individuals. For clarity, the mismatches are defined here as A (C−5IVS29A), B (T39IVS30C), C (A−41IVS29G), and D (G−43IVS29C). Lane 1, mismatches A and B. Lane 2, mismatches A, B, and C. Lane 3, mismatches C and D. Lane 4, mismatch B. Lane 5, mismatches B and C. Lane 6, mismatch C. Lane 7, control sample.
DISCUSSION
Detection of mutations in double-stranded DNA by gel electrophoresis is based on the assumption that a single-base mismatch can produce conformational changes such as a bend in the double helix that causes differential migration of heteroduplexes and homoduplexes (19–25). The technique of CSGE was developed on the basis of the further assumption that mildly denaturing solvents in an appropriate buffer can accentuate the conformational changes produced by single-base mismatches and thereby increase the differential migration of heteroduplexes and homoduplexes (22, 23).
Under the initially described conditions (22), 60 of 63 single-base mismatches were detected by CSGE in a series of PCR products ranging in size from 200 to 800 bp. Three sequence variations that were not detected and one that was poorly detected by CSGE were found in high-melting domains as defined by analysis of the melting profiles (22, 23). Therefore, it was assumed that failure to detect the mismatches was explained by the stability of the adjacent flanking sequences (22). The results here, however, indicate that the same single-base matches in high-melting domains are readily detected by reducing the maximal size of the PCR products to 450 bp and by several improvements in the conditions for gel electrophoresis.
With the improved conditions developed here, CSGE was shown to detect 76 different single-base changes in a variety of sequence contexts of collagen genes that are both GC-rich and repetitive. In addition, CSGE detected all sequence variations previously detected by DGGE (17, 18, 31). Moreover, comparisons with data obtained by sequencing of more than 12,000 nucleotides in both alleles of the COL1A1 gene from each of eight unrelated individuals suggested that CSGE is sensitive to detect essentially all sequence variations in the gene. In addition to its sensitivity, the advantage of CSGE over other commonly used techniques for scanning PCR products is that it requires no special equipment or preparation of PCR samples, and it uses a standard polyacrylamide electrophoretic gel in a modified solvent-buffer system. The procedure is simple, requires little standardization, has a large capacity, and does not use radioactivity.
Acknowledgments
We thank Ms. Aira Harju and Mr. Robert Hnatuk for expert technical assistance, and Dr. Helena Kuivaniemi for supplying DNA samples for the analysis of the COL3A1 gene. This work was partially funded by grants from the Academy of Finland, National Institutes of Health Grant AR-39740, and a grant from the Arthritis Foundation.
ABBREVIATIONS
- CSGE
conformation-sensitive gel electrophoresis
- DGGE
denaturing gradient gel electrophoresis
References
- 1.Kuivaniemi H, Tromp G, Prockop D J. Hum Mutat. 1997;9:300–315. doi: 10.1002/(SICI)1098-1004(1997)9:4<300::AID-HUMU2>3.0.CO;2-9. [DOI] [PubMed] [Google Scholar]
- 2.Collod-Beroud G, Beroud C, Ades L, Black C, Boxer M, et al. Nucleic Acids Res. 1997;25:147–150. doi: 10.1093/nar/25.1.147. [DOI] [PMC free article] [PubMed] [Google Scholar]
- 3.Cotton R G H. Mutat Res. 1993;285:125–144. doi: 10.1016/0027-5107(93)90060-s. [DOI] [PubMed] [Google Scholar]
- 4.Grompe M. Nat Genet. 1993;5:111–117. doi: 10.1038/ng1093-111. [DOI] [PubMed] [Google Scholar]
- 5.Glavac D, Dean M. Hum Mutat. 1995;6:281–287. doi: 10.1002/humu.1380060402. [DOI] [PubMed] [Google Scholar]
- 6.Eng C, Vijg J. Nat Biotechnol. 1997;15:422–426. doi: 10.1038/nbt0597-422. [DOI] [PubMed] [Google Scholar]
- 7.Nollau P, Wagener C. Clin Chem. 1997;43:1114–1128. [PubMed] [Google Scholar]
- 8.Orita M, Iwahana H, Kanazawa H, Hayashi K, Sekiya T. Proc Natl Acad Sci USA. 1989;86:2766–2770. doi: 10.1073/pnas.86.8.2766. [DOI] [PMC free article] [PubMed] [Google Scholar]
- 9.Novack D F, Casna N J, Fischer S G, Ford J P. Proc Natl Acad Sci USA. 1986;83:586–590. doi: 10.1073/pnas.83.3.586. [DOI] [PMC free article] [PubMed] [Google Scholar]
- 10.Myers R M, Larin Z, Maniatis T. Science. 1985;230:1242–1246. doi: 10.1126/science.4071043. [DOI] [PubMed] [Google Scholar]
- 11.Cotton R G H, Rodrigues N R, Campbell R D. Proc Natl Acad Sci USA. 1988;85:4397–4401. doi: 10.1073/pnas.85.12.4397. [DOI] [PMC free article] [PubMed] [Google Scholar]
- 12.Ganguly A, Rooney J E, Hosomi S, Zeiger A, Prockop D J. Genomics. 1989;4:530–538. doi: 10.1016/0888-7543(89)90276-0. [DOI] [PubMed] [Google Scholar]
- 13.Ganguly A, Prockop D J. Nucleic Acids Res. 1990;18:3933–3939. doi: 10.1093/nar/18.13.3933. [DOI] [PMC free article] [PubMed] [Google Scholar]
- 14.Youil R, Kemper B W, Cotton R G. Proc Natl Acad Sci USA. 1995;92:87–91. doi: 10.1073/pnas.92.1.87. [DOI] [PMC free article] [PubMed] [Google Scholar]
- 15.Myers R M, Maniatis T, Lerman L S. Methods Enzymol. 1987;155:501–527. doi: 10.1016/0076-6879(87)55033-9. [DOI] [PubMed] [Google Scholar]
- 16.Sheffield V C, Cox D R, Lerman L S, Myers R M. Proc Natl Acad Sci USA. 1989;86:232–236. doi: 10.1073/pnas.86.1.232. [DOI] [PMC free article] [PubMed] [Google Scholar]
- 17.Ritvaniemi P, Hyland J, Ignatius J, Kivirikko K I, Prockop D J, Ala-Kokko L. Genomics. 1993;17:218–221. doi: 10.1006/geno.1993.1306. [DOI] [PubMed] [Google Scholar]
- 18.Ritvaniemi P, Körkkö J, Bonaventure J, Vikkula M, Hyland J, et al. Arthritis Rheum. 1995;38:999–1004. doi: 10.1002/art.1780380717. [DOI] [PubMed] [Google Scholar]
- 19.Bhattacharyya A, Lilley D M J. Nucleic Acids Res. 1989;17:6821–6840. doi: 10.1093/nar/17.17.6821. [DOI] [PMC free article] [PubMed] [Google Scholar]
- 20.Keen J, Lester D, Inglehearn C, Curtis A, Bhattacharyya S. Trends Genet. 1991;7:5. doi: 10.1016/0168-9525(91)90004-a. [DOI] [PubMed] [Google Scholar]
- 21.White M G, Carvalho M, Derse D, O’Brien S J, Dean M. Genomics. 1992;12:301–306. doi: 10.1016/0888-7543(92)90377-5. [DOI] [PubMed] [Google Scholar]
- 22.Ganguly A, Rock M J, Prockop D J. Proc Natl Acad Sci USA. 1993;90:10325–10329. doi: 10.1073/pnas.90.21.10325. [DOI] [PMC free article] [PubMed] [Google Scholar]
- 23.Ganguly A, Prockop D J. Electrophoresis. 1995;16:1830–1835. doi: 10.1002/elps.11501601301. [DOI] [PubMed] [Google Scholar]
- 24.Ganguly A, Williams C J. Hum Mutat. 1997;9:339–343. doi: 10.1002/(SICI)1098-1004(1997)9:4<339::AID-HUMU6>3.0.CO;2-0. [DOI] [PubMed] [Google Scholar]
- 25.Ganguly, A., Leahy, K., Marshall, A., Dhulipala, R., Godmilow, L. & Ganguly, T. (1998) Genet. Testing, in press. [DOI] [PubMed]
- 26.Prockop D J, Kivirikko K I. Annu Rev Biochem. 1995;64:403–434. doi: 10.1146/annurev.bi.64.070195.002155. [DOI] [PubMed] [Google Scholar]
- 27.D’Alessio M, Bernard M, Pretorious P, de Wet W, Ramirez F. Gene. 1988;67:105–115. doi: 10.1016/0378-1119(88)90013-3. [DOI] [PubMed] [Google Scholar]
- 28.Westerhausen A I, Constantinou C, Pack M, Peng M, Hanning C, Olsen A, Prockop D J. Matrix. 1991;11:375–379. doi: 10.1016/s0934-8832(11)80191-5. [DOI] [PubMed] [Google Scholar]
- 29.Körkkö, J., Ala-Kokko, L., De Paepe, A., Nuytinck, L., Earley, J. & Prockop, D. J. (1998) Am. J. Hum. Genet., in press. [DOI] [PMC free article] [PubMed]
- 30.Ala-Kokko L, Prockop D J. Genomics. 1990;8:454–460. doi: 10.1016/0888-7543(90)90031-o. [DOI] [PubMed] [Google Scholar]
- 31.Körkkö J, Kuivaniemi H, Paassilta P, Zhuang J, Tromp G, De Paepe A, Prockop D J, Ala-Kokko L. Hum Mutat. 1997;9:148–156. doi: 10.1002/(SICI)1098-1004(1997)9:2<148::AID-HUMU7>3.0.CO;2-5. [DOI] [PubMed] [Google Scholar]
- 32.Lerman L S, Silverstein V. Methods Enzymol. 1987;155:482–501. doi: 10.1016/0076-6879(87)55032-7. [DOI] [PubMed] [Google Scholar]
- 33.Hanke M, Wink M. BioTechniques. 1994;17:858–860. [PubMed] [Google Scholar]
- 34.Werle E. Nucleic Acids Res. 1994;22:4354–4355. doi: 10.1093/nar/22.20.4354. [DOI] [PMC free article] [PubMed] [Google Scholar]
- 35.Constantinou C D, Spotila L D, Zhuang J, Sereda L, Hanning C, Prockop D J. Nucleic Acids Res. 1990;18:5577. doi: 10.1093/nar/18.18.5577. [DOI] [PMC free article] [PubMed] [Google Scholar]


