

Abstract
Microbial maintenance is an important concept in microbiology. Its quantification, however, is a subject of continuous debate, which seems to be caused by (1) its definition, which includes nongrowth components other than maintenance; (2) the existence of partly overlapping concepts; (3) the evolution of variables as constants; and (4) the neglect of cell death in microbial dynamics. The two historically most important parameters describing maintenance, the specific maintenance rate and the maintenance coefficient, are based on partly different nongrowth components. There is thus no constant relation between these parameters and previous equations on this subject are wrong. In addition, the partial overlap between these parameters does not allow the use of a simple combination of these parameters. This also applies for combinations of a threshold concentration with one of the other estimates of maintenance. Maintenance estimates should ideally explicitly describe each nongrowth component. A conceptual model is introduced that describes their relative importance and reconciles the various concepts and definitions. The sensitivity of maintenance on underlying components was analyzed and indicated that overall maintenance depends nonlinearly on relative death rates, relative growth rates, growth yield, and endogenous metabolism. This quantitative sensitivity analysis explains the felt need to develop growth-dependent adaptations of existing maintenance parameters, and indicates the importance of distinguishing the various nongrowth components. Future experiments should verify the sensitivity of maintenance components under cellular and environmental conditions.
Introduction
Describing microbial dynamics is of great importance for many different applications. Microbial dynamics determines production levels in food industry, waste removal in reactors, pollution cleanup in soils and sediments, as well as the biogeochemical cycles to major extents. Although some kinetic approaches of microbial dynamics do not explicitly account for changes in microbial biomass, a majority of the kinetic descriptions incorporates some measure of microbial growth. Most microbiologists acknowledge that, apart from microbial growth, some measure of “maintenance” is needed to provide proper descriptions of microbial kinetics. Over the years, maintenance has been quantified in various, partly contradictory, ways. These contradictions are caused by four interrelated issues.
The first issue that lies at the heart of matter is the definition of maintenance. Maintenance has been defined as “the energy consumed for functions other than the production of new cell material” [38]. This definition includes all nongrowth components and does not provide insight in its underlying processes, which complicates its general application. The nongrowth components thus included and determined empirically when measuring maintenance are (1) shifts in metabolic pathways, (2) energy spilling reactions, (3) cell motility, (4) changes in stored polymeric carbon, (5) osmoregulation, (6) extracellular losses of compounds not involved in osmoregulation, (7) proofreading, synthesis and, turnover of macromolecular compounds such as enzymes and RNA, and (8) defense against O2 stress [6, 30, 45, 50]. The opinion on which component is the dominant nongrowth component differs from osmoregulation [51], turnover of macromolecular compounds [6, 27, 50], to energy spilling reactions [45].
Second, and even more important, is that not all these nongrowth components are, physiologically speaking, part of maintenance—when maintenance is defined as a basic or endogenous metabolism. Endogenous metabolism was introduced [15] around the same time as “maintenance,” and the variables were frequently used interchangeably (e.g., [38]). Physiological maintenance comprises energy costs of osmoregulation, cell motility, defense mechanisms, and proofreading and internal turnover of macromolecular compounds. As indicated previously [6], physiological maintenance should not include shifts in metabolic pathways, storage of polymers, or extracellular losses. Some of the physiological maintenance components—such as shifts in metabolic pathways—seem to be better in place when corrected for in the cell growth yield, YG, which was defined as the amount of cell growth per amount of substrate consumed [15]. Physiological maintenance dominates the nongrowth losses of energy under starvation conditions [45].
Third, even though several incomparable nongrowth components were combined into a single variable, maintenance evolved as a biological kinetic constant through time. Originally, none of the microbial kinetic parameters used up to the present were initiated as constants. The most popular equation used to describe microbial growth, the Monod equation [31], was introduced as a purely empirical relationship resembling an adsorption isotherm. However, many microbiologists viewed the Monod equation as something that has an inherent meaning. From there, it is a small step to consider the variables involved as constants for the species considered. When measurements of maintenance (e.g., [14, 32]) showed deviations from a constant maintenance, the concept itself was not questioned, but an additional growth-rate-dependent maintenance parameter was introduced [39]. Similar evolution occurred with growth yield YG and the energy yield (YATP) [49], which was introduced based on a correlation between biomass production and ATP availability [2]. These were subsequently “proven” to be constants (e.g., [37]), whereas Stouthamer et al. [50] concluded that YG is not a biological constant, based on measured shifts in metabolic pathways.
The fourth issue arises from the fact that cell death is hardly considered in microbial dynamics. Flux measurements do not distinguish cell death from intracellular turnover. Although Herbert [15] described maintenance as similar to a negative relative growth rate, only some applied models (see, e.g., [53] for a review) consider it as a “relative death rate.” Explicit inclusion of death and lysis can have serious implications for the interpretation of maintenance effects [30].
These four issues have led to several inconsistencies in the quantification of “maintenance” and in equations describing microbial kinetics in general. The aim of this article is to describe the various measures of maintenance, to show the apparent relationship between the different measures and to quantify the dynamics of maintenance when distinguishing the various components included in maintenance to increase the understanding, description, and prediction of microbial dynamics.
Estimators for Maintenance
Specific Maintenance Rate
Herbert [15] postulated an “endogenous metabolism,” later termed “specific maintenance rate” [28], as a negative relative growth rate, in which the sum of the specific maintenance rate times microbial biomass equals the loss of cell material through maintenance:
 |
1 |
 |
2 |
in which x denotes microbial biomass (in g Cx m−3), μ is the true specific growth rate (in s−1) [15], a is the specific maintenance rate (in s−1), S is the energy supplying substrate (in g Cs m−3), and Yapp is the apparent yield coefficient (in g Cx g−1 Cs). Yapp describes the gross partitioning of elements over cell biomass and extracellular products. It is important to distinguish Yapp from YG, which is the yield coefficient corrected for maintenance. In other words, YG considers only consumption of substrate for growth purposes (in g Cx g−1 Cs). Given the correction for maintenance, YG is supposed to be higher and less variable with S than Yapp. VanUden [56] applied Eq. (2) with YG instead of Yapp. Consequently, his equations relating a to YG are incorrect.
As shown in Eq. (1), the definition of specific maintenance rate is completely analogous to the definition of μ. Maintenance a is an imaginative decay rate to account for a diversion of substrate flux from growth, but does not necessarily lead to additional losses of substrate. In fact, a includes osmoregulation, extracellular losses and turnover terms, and neglects the occurrence of the other nongrowth components listed in the Introduction. Given its mathematical definition, a also includes relative death rates when a is determined experimentally from biomass and compound balances, e.g., in chemostat experiments. Estimates derived for either a or relative death rates thus overlap, and researchers should avoid applying both simultaneously in a kinetic model (as done in [48]). It also implies that a includes nongrowth components other than physiological maintenance, whereas some physiological maintenance processes are not incorporated. More complicated models are needed to estimate real physiological maintenance rates.
The general definition given above does not imply that a is a constant. However, the empirical relation developed [28] to estimate a treated a as a constant:
 |
3 |
in which xmax was incorrectly [56] assumed to be a constant maximum microbial biomass (in g Cx m−3). Still, most models that apply a treat it as a constant (see, e.g., [53]), although a constant a does not explain the persistence of microbial communities under low nutrient conditions. Moreover, experimentally derived values for a, assuming its constancy, for different microbial species shows a significant correlation with its μmax value (P<0.001; correlation coefficient 0.73; Fig. 1). This indicates a higher a for faster-growing microorganisms. There is also evidence that a decreases at decreasing μ within microbial species [4] and even more strongly at starvation [45]. This can be understood from the changes in components included in a with decreasing μ [19].
Figure 1.
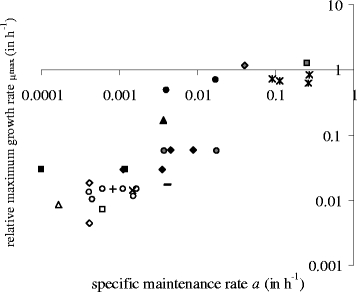
Literature compilation of correlation between measured specific maintenance rates a and maximum relative growth rates μmax for various microbial species ( ж [1];  [10]; × [21];○ [22];
  [23]; — [26];
  [29];
[29];  [33];
[33];  [34];
[34];  [36];
[36];  [43];
[43];  [44];
[44];  [58];
[58];  [59]; + [60]).
Given that a depends upon growth conditions, direct application of its values should be done with care and only under conditions similar to those at which it was determined. Alternatively, a may be made explicitly dependent upon growth conditions and growth history. In a theoretical study, Powell [41] proposed that the instantaneous specific substrate consumption rate is related to the organism's activity called its physiological state. This concept of physiological state r was applied and incorporated in a Synthetic Chemostat Model [35]. By definition, r varies between 0 and 1, where r=1 represents maximum activity and r=0 represents complete dormancy. Consequently:
 |
4 |
in which amax is the maximum specific maintenance rate (occurring if S≥∞). The complication is to derive r and its dynamics. Panikov [35] and Blagodatsky and Richter [5] proposed for the steady state r value,  :
:
 |
5 |
in which Kr is a saturation constant (in g Csm−3), analogous to Michaelis-Menten constant and the Monod saturation constant, and  is the equilibrium substrate concentration (in g Csm−3). Next to the theoretical foundation of this equation, the parameter estimation of Kr is especially problematic. More complex models determining a(S) such as inverse Monod relations [61], exponential functions relating a to internal microbial substrate concentrations [20], and multiple compartment models (e.g., [42]) have similar problems.
Maintenance Coefficient
Schulze and Lipe [46] defined “maintenance supply,” later termed “maintenance coefficient” m by Pirt [38], as the minimum substrate consumption to maintain the cells (m in g Cs g−1Cx s−1):
 |
6 |
in which q is the specific substrate consumption rate (in g Cs g−1 Cx s−1), used for growth and for maintenance. In this approach, maintenance thus denotes extra substrate consumption not used for growth purposes. In this approach, no biomass losses are possible, which is conceptually unattractive [3] and which in fact assumes μ to be the net relative growth rate. This leads to substrate consumption while substrate concentrations are zero. Defined in this way, m neglects the extracellular losses, osmoregulation, and turnover of macromolecular compounds listed for maintenance in the Introduction. It is also questionable whether shifts in metabolic pathways or storage of products are included.
In its original definition, the maintenance coefficient was considered constant for a species and has been used as such in numerous models describing microbial dynamics (e.g., [54]). However, in analogy to the understanding that a depended on growth conditions, it was found that the maintenance coefficient depended on μ [4, 7, 11, 32]. Therefore, on the assumption that the maintenance coefficient includes a portion that decreases with increasing μ, Pirt [39] postulated a modification to Eq. (6):
 |
7 |
in which mc denotes the constant maintenance coefficient (in g Cs g−1 Cx s−1) and mv(1 − μ/μmax) denotes the growth rate dependent maintenance coefficient (in g Cs g−1 Cx s−1). Equation (7) incorrectly assumes that maintenance is only a function of time and biomass [57]. Indeed, these mathematical constants are not biological constants, but both may vary with μ [51]. Accordingly, Pirt [40] concluded that Eq. (7) is not valid at very low μ and attributed this to the formation of dormant cells.
Relation between Specific Maintenance Rate and Maintenance Coefficient
Several authors (e.g., [38]) have tried to link the two maintenance estimators. Inconsequent application of the two above-mentioned yield parameters, however, have led to an erroneous derivation of a relationship between m and a. From Eq. (6), in combination with the definitions of YG and Yapp, it can be derived that:
 |
8a |
Similarly, from Eqs. (1) and (2), in combination with the definitions of YG and Yapp, it follows that:
 |
8b |
Equation (8b) predicts that Yapp decreases with decreasing growth rates if both YG and a are assumed constant, which indeed has been found so experimentally [8, 9]. Substitution of 1/YG in either Eqs. (8a) and (8b) shows that:
 |
9 |
which is only equal to m=a/YG (which is the equation between m and a that was derived by Schulze and Lipe [46] and later on applied by Pirt [38]) if Yapp=YG. It follows from Eqs. (8a) and (8b) that this only happens to be true if maintenance is absent—or, in other words, if m [Eq. (8a)] is zero or, following the alternative approach, if a [Eq. (8b)] is zero! The differences between the results obtained by Eq. (9) and the one from [38] can be substantial, especially if maintenance is large (Fig. 2). The errors made in previous reports on this subject thus may be considerable. Within each separate analysis, the empirical equations developed to estimate a separate maintenance parameter still hold true.
Figure 2.
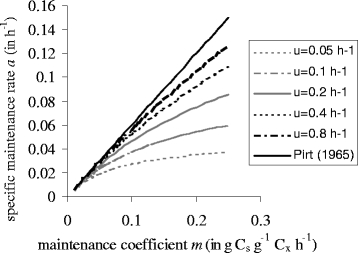
Comparison between the relationship between maintenance coefficient m and specific maintenance rate a calculated according to Eq. (9) and the original equation in Pirt [38] for various μ values with YG=0.6 g Cx g−1 Cs.
Equation (9) implies that there is no constant relation between the two parameters describing maintenance (Fig. 2), because Yapp depends on μ if maintenance occurs. Without sophisticated experimental tools, it is impossible to tell which parameter is nonconstant, because the two approaches on maintenance address partly the same and partly different nongrowth components and even cell death, whereas shifts in metabolic pathways are neglected by both approaches. For each component, the contribution to overall nongrowth losses may shift both in absolute and in relative terms with growth conditions. Therefore, the two ways of describing “maintenance” should be seen as two independent measures approaching a complex phenomenon from different directions. Combining empirical parameter estimates from both approaches in one model (as done frequently, e.g., [24]) should thus be done with great reservation and care. In reality, it is highly probable that given the different components combined in “maintenance,” partial losses occur in both biomass and in consumption. This will be extended and quantified below.
Only a few studies tried to separate the maintenance estimators. Servais et al. [47] quantified the relative release rate of label that had been incorporated into DNA as a relative death rate or specific maintenance rate (sensu [28]) assuming that DNA is not subject to maintenance (sensu [38]). Servais et al. [47] also showed that the temperature dependence of this specific maintenance rate was slightly less than generally found for relative growth rates.
Maintenance as a Minimum Substrate Concentration
Finally, some authors (e.g., [18]) introduced a minimum substrate concentration (Smin) above which growth occurs, instead of explicitly accounting for maintenance and/or death. Sometimes, Smin was linked to the occurrence of reverse enzymatic reactions [16]. Below Smin, it is usually assumed that growth is zero although it would be more correct to consider growth negative at concentrations lower than Smin. In fact, the introduction of Smin shifts the μ–[S] curve horizontally, where introducing a shifts the μ–[S] curve vertically (Fig. 3). Both parameters can be easily converted into each other. By definition, S=Smin if dx/dt=0. Assuming Monod kinetics, then:
 |
10 |
in which Ks is the Monod saturation constant (in g Cs m−3) and μmax is the maximum relative growth rate (in s−1). In Eq. (10), a simply equals a at S=Smin nd is not necessarily a constant. Analogous to the combination of m and a in one model, the combination of Smin and m in one model (as done, e.g., by Tros et al. [54]), should be carried out with great caution.
Figure 3.
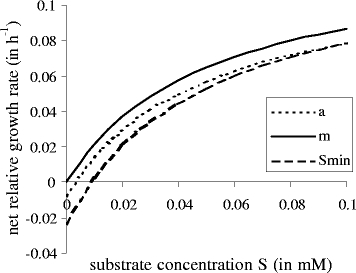
Relationship between the substrate concentration S and the net relative growth rate μ while accounting for maintenance in different ways, i.e., by a specific maintenance rate (a), maintenance coefficient (m), or a minimum substrate concentration (Smin). Kinetic parameters were obtained for growth on 3-Chlorobenzoate [54].
Influence of Nongrowth Components on Overall Maintenance Dynamics
A Conceptual Model
Ideally, a maintenance description should distinguish physiological maintenance from other nongrowth components and incorporate the dynamics of each component. Unfortunately, experimental data on the contribution of individual nongrowth components—let alone information on changes in contributions as a function of growth conditions—are scarce. Mason et al. [29] introduced a maintenance model that was based on death and cell lysis. Lysis was incorporated in decreased Y values. Unfortunately, their four compartments (active cells, nonviable active cells, dead cells, and extracellular products) are hard to distinguish, as indicated by the same authors, and led to numerous unknown kinetic parameters that had to be fitted. Beeftink et al. [3] also derived kinetic equations by accounting for death and maintenance separately. However, their critical assumptions on constant total maintenance energy and the applied modulation between decay and maintenance-associated catabolism are questionable given the variability in maintenance requirements.
In this section, an analysis is introduced that builds upon existing formulations and that separates the individual nongrowth components to the extent allowed by the limited experimental data. To allow application in kinetic studies, the conceptual model contains a minimum number of parameters that may be estimated from kinetic studies. Moreover, only single species cultures are considered. Microbial physiological processes were simplified and lumped using existing formulations as long as these did not contradict first principles. Present experimental data do not justify further specification. The conceptual model is by no means quantitatively correct, but allows us to analyze the sensitivity of microbial dynamics to various nongrowth components and may be refined when experimental data become available.
The first step to separate physiological maintenance from other nongrowth components is by dividing the total microbial biomass into two fractions, an inactive dormant fraction (subscript i) and a reactive fraction (subscript r). Inactive fractions may occur in a different compartment within active cells or outside active cells. The inactive biomass fraction may thus be “passively” dormant like spores or resting microbes (as differentiated by [30]), or “actively” dormant like less reactive individual cells [41] or energy storage products [25, 57] within vacuoles [55] such as polyglucose, glycogen, or polyhydroxybutyrate. This biomass distinction follows earlier theories on maintenance quantification [7, 35, 40, 41]. Further specification of the inactive fraction is not necessary as long as a quasi steady state is assumed—a restriction that concerns most theoretical descriptions developed so far. This allows us to separate the effects of storage of polymeric carbon from other nongrowth components. So,
 |
11 |
Experiments have shown a partitioning of biomass between reactive and inactive fractions as a function of growth conditions (e.g., [17, 55]). Unfortunately, there is a lack of quantitative data that describe this partitioning, e.g., as a function of substrate concentrations, although it is generally acknowledged that in most environments a significant proportion of the microbial community is in the “inactive state” (e.g., [30]). Therefore, an approach similar to those in earlier theoretical descriptions [35, 40] is applied that takes the relative activity proportional to the true relative growth rate μ [15]:
 |
12 |
This postulation is in line with [41], and in accordance with a great body of experimental evidence [35]. Cell-size dynamics does not need to be considered in this approach, and growth is simply a biomass increment independent of whether this leads to bigger cells or splitting cells.
The inactive fraction has no participation in growth or permanent biomass losses such as excretion and death, because first xi has to be converted into active metabolic biomass before such changes may occur. Under quasi steady state conditions, xi dynamics does thus not have to be considered:
 |
13 |
A similar feature of inactive biomass fractions has previously helped to explain nongrowth dynamics at low growth rates [40]. Assuming Monod kinetics and first-order kinetics for biomass losses leads to:
 |
14 |
in which d is the relative death rate (in s−1), which is an approximation for irreversible losses of biomass such as cell death and extracellular excretion and leakage of intermediates. S is the concentration of the limiting substrate. It is assumed that S is the same compound across all growth conditions and that d does not contribute to S. If, in addition, if physiological maintenance requirements would be neglected, substrate dynamics would be described following the definition of YG:
 |
15a |
Most physiological maintenance requirements, i.e., energy related to osmoregulation, cell motility, proofreading and internal turnover of macromolecular compounds, and defense mechanisms, are related to cell activity. The energy needed for physiological maintenance will consequently, as a first-order approach, be proportional to growth. Therefore, physiological maintenance is assumed to be a fraction of active biomass increment by growth. Incorporation of physiological maintenance thus leads to:
 |
15b |
in which mp denotes the substrate consumption for physiological maintenance per biomass increment (in g Cs g−1 Cx). Treating mp as a variable instead of a constant also allows the incorporation of energy spilling reactions into mp, given that active transport of protons over membranes is considered the most important energy spilling reaction [45].
Most theoretical approaches assume that YG is constant for a given substrate S. However, this is not appropriate if shifts in metabolic pathways occur [50]. Varying YG as a function of growth conditions would thus quantify the last nongrowth component. Unfortunately, there are no experimental data that allow general quantification of this variation in YG.
Relating the Conceptual Model to Maintenance Parameters
The described conceptual model explicitly incorporates all nongrowth terms listed in the Introduction: d allows for excretion, leakage, and cell death; xi allows for storage and growth-dependent activities; and mp for the various physiological maintenance processes, and the variation in YG allows for shifts in metabolic pathways. It allows the quantification of nongrowth components as a function of growth conditions and can be related to existing maintenance parameters:
The specific maintenance rate a incorporates the same maintenance components as d, and can be calculated from d combining Eqs. (1), (11) and (14):
 |
16 |
Note the similarity between Eq. (16) and a derived by combining Eqs. (4) and (5). This shows, in agreement with the theory discussed, that a is composed of biomass losses corrected for the proportion of biomass stored in inactive biomass.
The maintenance coefficient m most closely resembles mp, but note its different units. Combining Eqs. (6), (11) and (15b) shows that:
 |
17 |
explicitly indicating the influence of energy spilling reactions, through a nonconstant mp, and the effects of storage on m. This agrees with the postulation of Pirt [39] that a growth-dependent maintenance may be related to the dynamics of energy storage products. Eq. (17) also shows that shifts in metabolic pathways are not included in m, given that variation in YG is not accounted for in either Eq. (17) or Schulz and Lipe [46].
All nongrowth components can be combined in one overall maintenance coefficient (mtot in g Cs g−1 Cx s−1)—which equals the maintenance estimated in experiments—by applying Eq. (9), estimating a from Eqs. (12) and (16) and estimating Yapp from Eqs. (2), (14) and (15b):
 |
18 |
Sensitivity Analysis of the Conceptual Model
Equation (18) clearly shows that mtot is not a constant, but rather a nonlinear dynamic function of all variables involved, which is in line with a similar postulation in [6]. Unfortunately, no experimental data are available on the individual nongrowth variables, and even the lumped parameters mp and d can only be estimated indirectly from Eqs. (12) and (16). Therefore, Eq. (18) has not been applied to provide the quantitative estimates of mtot. Instead, sensitivity analyses were carried out to determine the potential sensitivity of the various nongrowth components and the potential variability of mtot with growth conditions. First, Eq. (18) was used to calculate the relative sensitivity of the dynamics in mtot as a function of mp, d, μr, and YG assuming that μmax is a species characteristic and hence constant. The analytical solutions for these sensitivities are:
 |
19a |
 |
19b |
 |
19c |
 |
19d |
Equations (19a-19d) emphasize the nonlinear dependence of mtot upon the underlying variables, particularly upon d and μr. Next, a numerical sensitivity analysis was carried out, calculating mtot for various combinations of mp, d, μr, and YG while each parameter was varied independently of each other. The results of this sensitivity analysis (Fig. 4) confirmed that both absolute and relative variations in mtot mainly depended on d and μr. At all combinations of mp and YG, mtot was low at low d and μr and tilted toward high values at combinations of high values of these parameters. Increases in mp reinforced and increases in YG decreased these tilting patterns. The small changes in mtot with YG indicate that the effects of shifts in metabolic pathways [13] are relatively minor (but attributed to physiological maintenance if it would be assumed that YG is constant).
Figure 4.
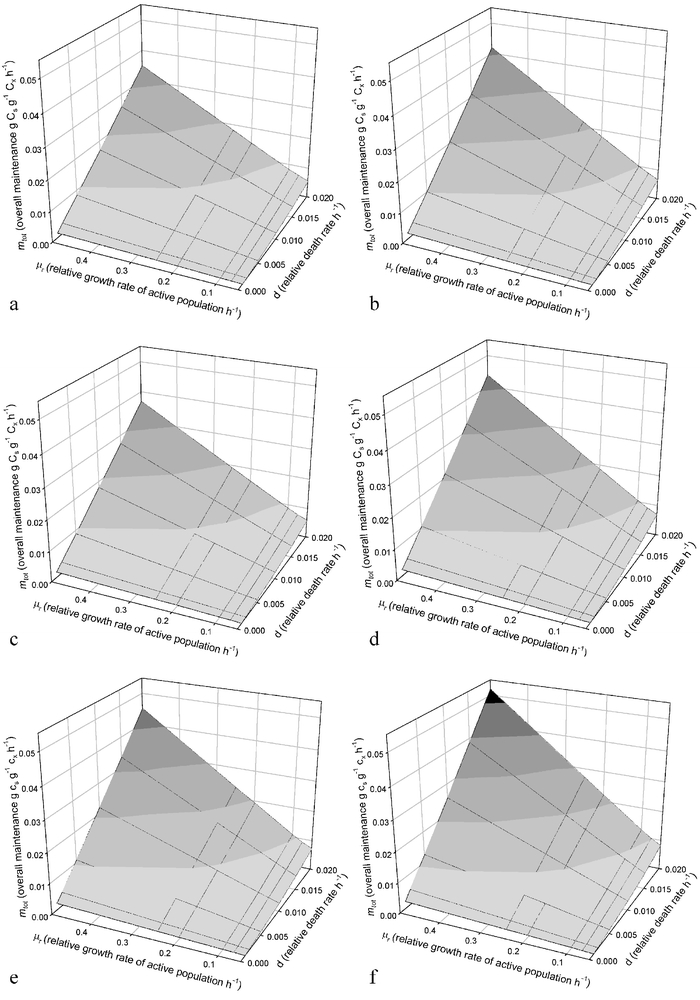
Responses of the overall maintenance mtot, depicted as planes, calculated by the conceptual model to variation in relative growth rate μr with μmax=0.5 h−1 and relative death rate d for different combinations of physiological maintenance mp and growth yield YG: (a) mp=0.01 g Cs g−1 Cx and YG=0.6 g Cx g−1 Cs; (b) mp=0.01 g Cs g−1 Cx and YG=0.5 g Cx g−1 Cs; (c) mp=0.10 g Cs g−1 Cx and YG=0.6 g Cx g−1 Cs; (d) mp=0.10 g Cs g−1 Cx and YG=0.5 g Cx g−1 Cs; (e) mp=0.50 g Cs g−1 Cx and YG=0.6 g Cx g−1 Cs; (f) mp=0.50 g Cs g−1 Cx and YG=0.5 g Cx g−1 Cs.
Discussion
Maintenance Estimators
The above analysis of “maintenance” estimators shows that there is no simple solution to reconcile the different approaches and terminologies. First, the analysis underlines the importance of distinguishing and explicitly describing and quantifying the various components of maintenance to understand its dynamics and the differences between maintenance estimates. This was hardly done in the past. The conceptual model—based on common sense microbiological assumptions such as inactive vs reactive fractions and Monod kinetics, simplified to apply to quasi steady states only—incorporated all nongrowth components and showed that maintenance is a dynamic process that depends nonlinearly on relative death rates, relative growth rates, physiological maintenance, and growth yield. The first two variables dominated the variability in the overall maintenance. This is not to say that physiological maintenance is unimportant, because part of the sensitivity of mp on overall maintenance goes through μr, see Eq. (17). The dominance of μ on mtot variability led to an almost linear dependence and was mainly due to the mechanistic distinction between an inactive and an active microbial fraction. Similar linear relationships between μ and maintenance have been incorporated in empirical formulations (e.g., [32, 39]).
This is not meant to indicate that the presented conceptual model is quantitatively correct, but it considers and quantifies all nongrowth components and is, contrary to earlier descriptions on maintenance, internally consistent in the sense that it avoids combinations of contrasting descriptions of maintenance. In its present form, the conceptual model is highly helpful as it provides estimates on the sensitivity of maintenance on the underlying components and shows maintenance dynamics. These characteristics may make the approach attractive as a point of departure to develop and validate mechanistic models on maintenance.
Second, the analysis made clear that the difference between physiological maintenance (or endogenous metabolism sensu [45]) and other nongrowth conditions is crucial. Explicit consideration of this difference in models would greatly improve our understanding of the phenomenon, whereas neglect of this factor has led to many misunderstandings on the quantification of maintenance and its dynamics as a function of growth conditions.
Third, the analysis pinpointed inconsistencies in current formulations of maintenance, i.e., the specific maintenance rate and the maintenance coefficient. These variables are principally incompatible and there is no constant relation between the two. Schulze and Lipe's [46] derived relationship between the two, which was applied by others later on, is incorrect. Comprehension and correct use of these differences is crucial to correctly describe maintenance.
Finally, an important illustrated aspect of microbial dynamics is the variability in kinetic macroscopic “constants” with growth conditions as shown for the overall maintenance coefficient. Moreover, the analysis showed how the dynamics of YG is intermingled with maintenance. This problem is more general than discussed above, because YG is derived empirically as the maximum yield after correcting for maintenance according to a presupposed formulation on the variation of maintenance with cultivation conditions. By this procedure, YG becomes by definition a constant, whose value depends on the chosen formulation for maintenance. This variability in kinetic parameters and its separation needs reevaluation.
All results outlined above were obtained from macroscopic microbial features. It should be noted, however, that the conclusions do not change when considering energy balances instead, i.e., when applying YATP and mE as yield and maintenance coefficients (e.g., [12, 52]) instead of YG and m. The equations to calculate mE [52] are fully analogous to Eq. (8a), with the same conceptual problems and assumptions of constancy. Moreover, similar to YG, YATP is not constant even when considering maintenance [45].
Implications for Microbial Ecology
Many microbial ecologists have a clear concept on the processes entangled in physiological maintenance or endogenous metabolism, but this is not what is measured empirically. The introduced conceptual model has quantified how physiological maintenance in concert with other nongrowth components determines empirical maintenance estimates. This conceptual model also provides possible explanations for the wide variety of maintenance estimates among microorganisms. The most sensitive variable was the estimate of relative death rates, which was taken independent of growth conditions although that is a major simplification. A decrease in relative death rates with relative growth rate, as found experimentally [44], leads to even stronger nonlinearities in mtot with growth conditions. Surprisingly, estimates of mtot were relatively insensitive to variation in physiological maintenance, which might imply that this is relatively unimportant in explaining the variety in mtot among microorganisms. The variability in mtot and its nonlinearity needs to be considered by experimental microbial ecologists and should lead to adjustments in the equations used to describe microbial dynamics.
Apart from explanations of measured maintenance dynamics, the conceptual model also shows the need for experimental data on the contribution of the various nongrowth components, a need felt already by Pirt [40]. The presented model may be used to validate—components of—maintenance. Attempts to quantify physiological maintenance costs already exist [50], and may be integrated with measurements on the dynamics of relative death rates, e.g., through the application of flow cytometry. If, in addition, future experimental studies would make a stringent separation of effects on YG and physiological effects on maintenance, then the contribution of physiological maintenance costs, growth yield dynamics, and losses of biomass on mtot with changing growth conditions may be quantified. This would validate and improve the presented conceptual model and would strongly improve our knowledge on maintenance and nongrowth components in general.
In conclusion, the general definition of maintenance has led to a partly independent development of several maintenance estimators. Each maintenance parameter approaches the phenomenon from a different perspective and is thus fundamentally different. Previous attempts to relate the parameters are incorrect. The review of studies on maintenance showed that, although they started initially as constants, growth-dependent adaptations of maintenance variables were developed over time. A conceptual model that explicitly described the various nongrowth components also showed a strong dependence of overall maintenance on the relative growth rate. Apart from relative growth rates, overall maintenance depended in a nonlinear way on the combination of relative death rates, physiological maintenance, and growth yield. This analysis emphasizes that the components underlying maintenance should be considered and distinguished explicitly. Future experiments should verify the sensitivities of maintenance on the actual cellular and external environmental conditions.
Acknowledgments
Nancy de Bakker, Hans Scholten, Reinoud Segers, and three anonymous reviewers provided constructive comments on an earlier version of this manuscript.
References
- 1.Amrane, A (2002) Unstructured model for the decline phase of batch cultures of Lactobacillus helveticus growing on supplemented whey permeate. Biochem Eng J 10: 9–15 [DOI]
- 2.Bauchop, T, Elsden, SR (1960) The growth of microorganisms in relation to their energy supply. J Gen Microbiol 23: 457–469 [DOI] [PubMed]
- 3.Beeftink, HH, van der Heijden, RTJM, Heijnen, JJ (1990) Maintenance requirements: energy supply from simultaneous endogenous respiration and substrate consumption. FEMS Microbiol Ecol 73: 203–210 [DOI]
- 4.Beyeler, W, Rogers, PL, Fiechter, A (1984) A simple technique for the direct determination of maintenance energy coefficient: an example with Zymomonas mobilis. Appl Microbiol Biotechnol 19: 277–280 [DOI]
- 5.Blagodatsky, SA, Richter, O (1998) Microbial growth in soil and nitrogen turnover: a theoretical model considering the activity state of microorganisms. Soil Biol Biochem 30: 1743–1755 [DOI]
- 6.Chesbro, W (1988) The domains of slow bacterial growth. Can J Microbiol 34: 427–435 [DOI] [PubMed]
- 7.Chesbro, W, Evans, T, Eifert, R (1979) Very slow growth of Escherichia coli. J Bacteriol 139: 625–638 [DOI] [PMC free article] [PubMed]
- 8.Erickson, LE, Minkevich, IG, Eroshin, VK (1978) Application of mass and energy balance regularities in fermentation. Biotechnol Bioeng 20: 1595–1621 [DOI] [PubMed]
- 9.Esener, AA, Roels, JA, Kossen, NWF (1981) Fed-batch culture: modeling and applications in the study of microbial energetics. Biotechnol Bioeng 23: 1851–1871 [DOI]
- 10.Ghosh, S, Pohland, FG (1974) Kinetics of substrate assimilation and product formation in anaerobic digestion. J Water Pollut Control Fed 46: 748–758
- 11.Goma, G, Moletta, R, Novak, M (1979) Comments on the maintenance coefficient changes during alcohol fermentation. Biotechnol Lett 1: 415–420 [DOI]
- 12.Heijnen, JJ (1994) Thermodynamics of microbial growth and its implications for process design. Trends Biotechnol 12: 483–492 [DOI]
- 13.Heijnen, JJ, van Loosdrecht, MCM, Tijhuis, L (1992) A black box mathematical model to calculate auto- and heterotrophic biomass yields based on Gibbs energy dissipation. Biotechnol Bioeng 40: 1139–1154 [DOI] [PubMed]
- 14.Hempfling, WP, Mainzer, SE (1975) Effects of varying the carbon source limiting growth yield and maintenance characteristics of Escherichia coli in continuous culture. J Bacteriol 123: 1076–1087 [DOI] [PMC free article] [PubMed]
- 15.Herbert, D (1958) Some principles of continuous culture. In: Tunevall, G (Ed.) Recent Progress in Microbiology, VII Intern. Congr. for Microbiology, Stockholm, pp 381–396
- 16.Hoh, CY, Cord-Ruwisch, R (1996) A practical kinetic model that considers end-product inhibition in anaerobic digestion processes by including the equilibrium constant. Biotechnol Bioeng 51: 597–604 [DOI] [PubMed]
- 17.Ivanova, TI, Nesterov, AI (1988) Production of organic exometabolites by diverse cultures of obligate methanotrophs. Microbiology 57: 486–491
- 18.Jetten, MSM, Stams, AJM, Zehnder, AJB (1990) Acetate threshold values and acetate activating enzymes in methanogenic bacteria. FEMS Microbiol Ecol 73: 339–344 [DOI]
- 19.Kjelleberg, S, Hermansson, M, Mårdén, P, Jones, GW (1987) The transient phase between growth and nongrowth of heterotrophic bacteria, with emphasis on the marine environment. Annu Rev Microbiol 41: 25–49 [DOI] [PubMed]
- 20.Knapp, EB, Elliot, LF, Campbell, GS (1983) Carbon, nitrogen and microbial biomass interrelationships during the decomposition of wheat straw: a mechanistic simulation model. Soil Biol Biochem 15: 455–461 [DOI]
- 21.Kugelman, JJ, Chin, KK (1971) Toxicity, synergism, and antagonism in anaerobic waste treatment processes. In: Pohland, FG (Ed.) Anaerobic Biological Treatment Processes. American Chemical Society, Washington DC, pp 55–90
- 22.Lawrence, AW, McCarty, PL (1969) Kinetics of methane formation in anaerobic treatment. J Water Pollut Control Fed 41: R1–R17 [PubMed]
- 23.Leenen, EJTM, Boogert, AA, van Lammeren, AAM, Tramper, J, Wijffels, RH (1997) Dynamics of artificially immobilized Nitrosomonas europaea: effect of biomass decay. Biotechnol Bioeng 55: 630–641 [DOI] [PubMed]
- 24.Leffelaar, PA, Wessel, WW (1988) Denitrification in a homogeneous, closed system: experiment and simulation. Soil Sci 146: 335–349
- 25.LeGall, J, Xavier, AV (1996) Anaerobes response to oxygen: the sulfate-reducing bacteria. Anaerobe 2: 1–9 [DOI] [PubMed]
- 26.Lin, C-Y, Sato, K, Noike, T, Matsumoto, J (1986) Methanogenic digestion using mixed substrate of acetic, propionic and butyric acids. Water Res 20: 385–394 [DOI]
- 27.Mandelstam, J (1958) Turnover of protein in growing and non-growing populations of Escherichia coli. Biochem J 69: 110–119 [DOI] [PMC free article] [PubMed]
- 28.Marr, AG, Nilson, EH, Clark, DJ (1963) The maintenance requirements of Escherichia coli. Ann N Y Acad Sci 102: 536–548 [DOI]
- 29.Mason, CA, Bryers, JD, Hamer, G (1986) Activity, death and lysis during microbial growth in a chemostat. Chem Eng Commun 45: 163–176
- 30.Mason, CA, Hamer, G, Bryers, JD (1986) The death and lysis of microorganisms in environmental processes. FEMS Microbiol Rev 39: 373–401 [DOI]
- 31.Monod, J (1949) The growth of bacterial cultures. Annu Rev Microbiol 3: 371–394 [DOI]
- 32.Neijssel, OM, Tempest, DW (1976) Bioenergetic aspects of aerobic growth of Klebsiella aerogenes NCTC 418 in aerobic chemostat culture. Arch Microbiol 110: 215–221 [DOI] [PubMed]
- 33.Novak, JT, Carlson, DA (1970) The kinetics of anaerobic long chain fatty acid degradation. J Water Pollut Control Fed 42: 1933–1943
- 34.O'Rourke, JT (1968) Kinetics of Anaerobic Treatment at Reduced Temperatures. Stanford University, California
- 35.Panikov, NS (1995) Microbial Growth Kinetics, 1st edn. Chapman and Hall, London
- 36.Pavlostathis, SG, Giraldo-Gomez, E (1991) Kinetics of anaerobic treatment. Water Sci Technol 24: 35–59
- 37.Payne, WJ (1970) Energy yields and growth of heterotrophs. Annu Rev Microbiol 25: 17–52 [DOI] [PubMed]
- 38.Pirt, SJ (1965) The maintenance energy of bacteria in growing cultures. Proc R Soc London B 163: 224–231 [DOI] [PubMed]
- 39.Pirt, SJ (1982) Maintenance energy: a general model for energy-limited and energy-sufficient growth. Arch Microbiol 133: 300–302 [DOI] [PubMed]
- 40.Pirt, SJ (1987) The energetics of microbes at slow growth rates: maintenance energies and dormant organisms. J Ferment Technol 65: 173–177 [DOI]
- 41.Powell, EO (1967) The growth rate of microorganisms as a function of substrate concentration. In: Powell, EO, Evans, CGT, Strange, RE, Tempest, DW (Eds.) Microbial Physiology and Continuous Culture. HMSO, London, pp 34–56
- 42.Richter, O, Diekkrüger, B, Nörtersheuser, P (1996) Environmental Fate Modelling of Pesticides. VCH, Weinheim
- 43.Roslev, P, King, GM (1994) Survival and recovery of methanotrophic bacteria starved under oxic and anoxic conditions. Appl Environ Microbiol 60: 2602–2608 [DOI] [PMC free article] [PubMed]
- 44.Roslev, P, King, GM (1995) Aerobic and anaerobic starvation metabolism in methanotrophic bacteria. Appl Environ Microbiol 61: 1563–1570 [DOI] [PMC free article] [PubMed]
- 45.Russell, JB, Cook, GM (1995) Energetics of bacterial growth: balance of anabolic and catabolic reactions. Microbiol Rev 59: 48–62 [DOI] [PMC free article] [PubMed]
- 46.Schulze, KL, Lipe, RS (1964) Relationship between substrate concentration, growth rate, and respiration rate of Escherichia coli in continuous culture. Arch Mikrobiol 48: 1–20 [DOI] [PubMed]
- 47.Servais, P, Billen, G, Vives Rego, J (1985) Rate of bacterial mortality in aquatic environments. Appl Environ Microbiol 49: 1448–1454 [DOI] [PMC free article] [PubMed]
- 48.Sinclair, CG, Topiwala, HH (1970) Model for continuous culture which considers the viability concept. Biotechnol Bioeng 12: 1069–1079 [DOI] [PubMed]
- 49.Stouthamer, AH, Bettenhausen, CW (1973) Utilization of energy for growth and maintenance in continuous and batch cultures of microorganisms. Biochim Biophys Acta 301: 53–70 [DOI] [PubMed]
- 50.Stouthamer, AH, Bulthuis, BA, van Verseveld, HW (1990) Energetics of growth at low growth rates and its relevance for the maintenance concept. In: Poole, RK, Bazin, MJ, Keevil, CW (Eds.) Microbial Growth Dynamics. IRL Press, Oxford, Special Publications Society for General Microbiology, vol. 28, pp 85–102
- 51.Tempest, DW, Neijssel, OM (1984) The status of YATP and maintenance energy as biologically interpretable phenomena. Annu Rev Microbiol 38: 459–486 [DOI] [PubMed]
- 52.Tijhuis, L, van Loosdrecht, MCM, Heijnen, JJ (1993) A thermodynamically based correlation for maintenance Gibbs energy requirements in aerobic and anaerobic chemotrophic growth. Biotechnol Bioeng 42: 509–519 [DOI] [PubMed]
- 53.Toal, ME, Yeomans, C, Killham, K, Meharg, AA (2000) A review of rhizosphere carbon flow modelling. Plant Soil 222: 263–281 [DOI]
- 54.Tros, ME, Bosma, TNP, Schraa, G, Zehnder, AJB (1996) Measurement of minimum substrate concentration (Smin) in a recycling fermentor and its prediction from the kinetic parameters of Pseudomonas sp. Strain B13 from batch and chemostat cultures. Appl Environ Microbiol 62: 3655–3661 [DOI] [PMC free article] [PubMed]
- 55.van Niel, EWJ, Pedro Gomes, TM, Willems, A, Collins, MD, Prins, RA, Gottschal, JC (1996) The role of polyglucose in oxygen-dependent respiration by a new strain of Desulfovibrio salexigens. FEMS Microbiol Ecol 21: 243–253
- 56.van Uden, N (1967) Transport-limited growth in the chemostat and its competitive inhibition: a theoretical treatment. Arch Mikrobiol 58: 145–154 [DOI] [PubMed]
- 57.van Verseveld, HW, Chesbro, WR, Braster, M, Stouthamer, AH (1984) Eubacteria have 3 growth modes keyed to nutrient flow. Consequences for the concept of maintenance and maximal growth yield. Arch Microbiol 137: 176–184 [DOI] [PubMed]
- 58.Vogelaar, JCT, Klapwijk, B, Temmink, H, van Lier, JB (2003) Kinetic comparisons of mesophilic and thermophilic aerobic biomass. J Ind Microbiol Biotechnol 30: 81–88 [DOI] [PubMed]
- 59.Wandrey, C, Aivasidis, A (1983) Continuous anaerobic digestion with Methanosarcina barkeri. Ann N Y Acad Sci 413: 489– 500 [DOI]
- 60.Yoda, M, Kitagawa, M, Miyaji, Y (1987) Long term competition between sulfate-reducing and methane-producing bacteria for acetate in an anaerobic biofilm. Water Res 21: 1547–1556 [DOI]
- 61.Zelenev, VV, van Bruggen, AHC, Semenov, AM (2000) “BACWAVE,” a spatial–temporal model for traveling waves of bacterial populations in response to a moving carbon source in soil. Microb Ecol 40: 260–272 [DOI] [PubMed]