

Abstract
Summary
Vitamin K mediates the synthesis of proteins regulating bone metabolism. We have tested whether high vitamin K2 intake promotes bone mineral density and bone strength. Results showed that K2 improved BMC and femoral neck width, but not DXA-BMD. Hence high vitamin K2 intake may contribute to preventing postmenopausal bone loss.
Introduction
Vitamin K is involved in the synthesis of several proteins in bone. The importance of K vitamins for optimal bone health has been suggested by population-based studies, but intervention studies with DXA-BMD as a clinical endpoint have shown contradicting results. Unlike BMC, DXA-BMD does not take into account the geometry (size, thickness) of bone, which has an independent contribution to bone strength and fracture risk. Here we have tested whether BMC and femoral neck width are affected by high vitamin K intake.
Methods
A randomized clinical intervention study among 325 postmenopausal women receiving either placebo or 45 mg/day of vitamin K2 (MK-4, menatetrenone) during three years. BMC and hip geometry were assessed by DXA. Bone strength indices were calculated from DXA-BMD, femoral neck width (FNW) and hip axis length (HAL).
Results
K2 did not affect the DXA-BMD, but BMC and the FNW had increased relative to placebo. In the K2-treated group hip bone strength remained unchanged during the 3-year intervention period, whereas in the placebo group bone strength decreased significantly.
Conclusions
Vitamin K2 helps maintaining bone strength at the site of the femoral neck in postmenopausal women by improving BMC and FNW, whereas it has little effect on DXA-BMD.
Keywords: Bone mineral content, Femoral neck strength, Fracture risk, Menaquinone, Osteoporosis, Vitamin K
Introduction
Since the discovery of osteocalcin, the vitamin K-dependent protein synthesized by bone tissue, attempts have been made to correlate bone vitamin K status with bone strength. The way in which these variables were measured varied in different studies. Obviously, the best way to assess bone strength is monitoring fracture incidence in a large study cohort over a long period of time. Unfortunately, this method is expensive and time consuming. Therefore, most authors have used bone mineral density as measured by DXA (DXA-BMD) as a surrogate marker for bone strength. A disadvantage of this technique is that it gives the amount of calcium per area, but does not take into account the three dimensions of the bone [1]. Findingreliable markers for bone vitamin K status turned out to be even more difficult. Dietary vitamin K may occur in different forms: K1 (also known as phylloquinone) and K2, which is a group name for a series of related compounds also known as menaquinones [2]. The various menaquinones differ structurally in the length of their isoprenyl side chain, which may contain four isoprenoid residues in menaquinones-4 (MK-4) up to nine residues in menaquinones-9 (MK-9). Still higher menaquinones have been described, but are increasingly rare in the diet. Dietary K1 originates mainly from green, leafy vegetables, whereas menaquinones are produced by bacteria and are mostly found in fermented foods such as cheese and the Japanese food natto (fermented soy beans) [3, 4]. Synthetic forms of vitamin K available in food supplements or pharmaceutical preparations are K1 and MK-4, recently also the natural MK-7 has become available. The recommended daily intake of vitamin K (all forms) is between 100 and 120 μg/day, but this value is based on the hepatic vitamin K requirement for blood clotting factor synthesis. The requirements of other tissues have not yet been defined, but are probably higher.
In 1984, Hart and coworkers described a case-control study in which patients with femur neck fractures had lower circulating vitamin K1 concentrations than age- and sex-matched controls [5]. In a second study from the same authors it was found that subjects with low serum vitamin K1 concentrations had a lower DXA-BMD than those with normal or high serum vitamin K1 [6]. A potential bias in these studies is that low circulating vitamin K may be a marker for general poor nutritional status and that low DXA-BMD and increased fracture risk are associated with the combined deficiency of essential minerals, vitamins and proteins rather than with vitamin K alone.
Others have published population-based studies in which an inverse correlation was found between fracture risk and vitamin K1 intake [7, 8]. It was found that the association between vitamin K1 intake and fracture risk was much stronger than that between vitamin K1 intake and DXA-BMD [9]. A drawback of these studies is that no attempts were made to also monitor vitamin K2 intake. Although in the western society K2 forms only 10–20% of the total vitamin K intake [3, 4], it is absorbed from the food matrix much better than K1 and may cover 50% of the total vitamin K absorbed. Moreover, it has been demonstrated that vitamin K2 rather than K1 is preferentially taken up by extrahepatic tissues such as bone and arteries [10]. Hence also vitamin K1 intake seems to be a questionable marker for bone vitamin K status.
Possibly the best marker available today is circulating undercarboxylated osteocalcin (ucOC). Either the absolute concentration, the ratio between ucOC and total osteocalcin, or the ratio between ucOC and carboxylated osteocalcin (cOC) are used in the literature. The group of Delmas [11–13] and Luukinen et al. [14] reported a number of independent studies suggesting a strongly increased fracture risk in populations with elevated serum ucOC; later studies by the French group [15] and others [9, 16] showed that ucOC was inversely associated with DXA-BMD. It is at least remarkable that in all approaches, associations between vitamin K status and fracture risk were demonstrated more readily than those between K status and DXA-BMD.
In a supplementation study with vitamin K1 alone no effect on DXA-BMD was observed during a 2-year treatment with 10 mg/day [17]. In another study from the same group, however, a synergistic effect of 1 mg/day of K1 with minerals and vitamin D [18] was found. In this study the rate of bone loss in postmenopausal women was reported to be 35% lower in the presence of minerals and vitamins K1 and D as compared to the group receiving minerals and vitamin D without vitamin K. A number of Japanese studies reported variable effects of vitamin K2 alone, but substantial beneficial effects if combined with vitamin D [19].
It has been reported by many different authors that in the healthy population serum osteocalcin is incompletely carboxylated, which is indicative for poor vitamin K status of bone [11, 14, 16, 20]. Based on our present knowledge of vitamin K-dependent proteins, it must be expected that non-carboxylated osteocalcin is not functional. Since the molecular function of osteocalcin has remained unclear thus far, we do not know whether it contributes to bone strength at all. From transgenic osteocalcin-deficient mice, we know that osteocalcin contributes to regulating the form and the dimensions of bone [21]. This may also be important for humans.
The importance of bone geometry for bone strength is rapidly gaining interest [22–26]. Although DXA-BMD is still the determinant most generally used in the clinical evaluation of hip fracture risk, it has been stipulated that its uncritical use may lead to size-related artifacts in the estimation of bone strength and in the identification of fracture risk [27]. As was mentioned by Heaney [28], the ultimate concern in studying bone status is bone strength. Holding other variables constant, strength will increase both as bone mass increases and as bone size increases. When estimating bone strength, two strategies to also compensate for the dimensions of bone have been proposed. First, it is encouraged that densitometric comparisons between groups are based on bone mineral content (BMC) rather than on DXA-BMD [28]. Second, bone dimensions are used as independent determinants for bone strength. Important geometric parameters are the hip axis length (HAL) and the femoral neck width (FNW). Patients with low DXA-BMD or after experiencing a hip fracture had an increased FNW, suggesting an attempt to compensate for the increased fracture risk at this critical site [26]. On the other hand, it seems obvious that at comparable DXA-BMD a larger FNW will positively contribute to bone strength. In this way it is understandable that also and increase of BMC may contribute to bone strength, although it should be reminded that it is not the mass per se but the distribution of mass that is crucial for bone strength. The importance of combining bone geometry with DXA-BMD for expressing bone strength and fracture risk was realized by Karlamangla et al., who developed mathematical equations for calculating indices for compression strength, bending strength, and impact strength of the femoral neck [29]. In these equations, DXA-BMD is combined with HAL, FNW, height and body weight. We have used the same equations to analyse the data from a placebo-controlled intervention trial in which we compared the effects of vitamin K2 on DXA-BMD and bone strength indices in postmenopausal women, who were recruited from the apparently healthy population and thus represent the large group of free living elderly subjects. Additional or synergistic effects of calcium and vitamin D were not included in the design of our study.
Subjects and methods
Subjects
The study was designed for apparently healthy, non-osteoporotic women. Participants were recruited by local newspapers. Inclusion criteria were female gender, age between 55 and 75 years at intake, Caucasian race, apparently healthy, at least 2 years postmenopausal and willingness to sign informed consent. Exclusion criteria were: a history of metabolic bone disease(s) or recent bone fractures (less than one year), low bone density (T-score < −2.5), ovariectomy, hysterectomy, oral anticoagulant treatment, hormone replacement therapy, treatment with bisphosphonates, calcitonin, prednisone, heparin, or vitamin K-containing vitamin concentrates and food supplements. Also subjects who had received an investigational new drug within the last 12 months were excluded from the trial. In total 325 women met the criteria and were randomized into our study. The participants were pre-stratified according to age: 105 in the age of 55–65 years, and 220 in the age of 65–75 years. The study protocol was approved by the University Hospital medical ethics committee.
Masking
Participants were identified by a single randomization number according to the randomization schedule generated by the University Hospital Pharmacy using a computer-generated random permutation procedure in the software package SPSS. Participants were randomly assigned to treatment with either 45 mg/day of MK-4 (menatetrenone, EISAI Co, Tokyo, Japan) or placebo, and compliance with treatment was decided from pill counts during home visits. The daily dose of MK-4 was given in three capsules of 15 mg each, which had to be taken at three time points spread over the day, preferably after the meal. The participant randomization codes were allocated sequentially in the order in which the participants were enrolled. After completion of all analyses the randomization code was disclosed to the investigator.
Measurements
The clinical end points chosen to evaluate the effect of the study treatment on bone were bone mineral density (DXA-BMD), bone mineral content (BMC) and bone strength indices of the femoral neck. DXA-BMD and BMC were measured at baseline and after 1, 2 and 3 years of treatment by dual energy X-ray absorptiometry (DXA) at the site of the left total hip and femoral neck, as well as the vertebrae (L2-L4) using a Hologic QDR 4500-A (Waltham MA, USA). The in vivo precision (CV) after repeated measurements in 10 healthy adults (30–40 years old) was 0.85% for the spine and 0.78% for the femur neck in short term (one day interval) and 1.03% and 0.98% in long term (one-year interval) precision measurements. The long-term precision of FNW assessment was 1.53%. At each time point, standing height and body weight were determined with standardized equipment and the body mass index (BMI) was calculated as the weight in kilograms divided by the square of the height in meters. The daily calcium intake was assessed using a validated food frequency questionnaire. Indices for compression strength (CSI), bending strength (BSI) and impact strength (ISI) at the site of the femoral neck were calculated from the mean femoral neck width (FNW) and hip axis length (HAL), together with height, weight and femoral neck DXA-BMD as described by Karlamangla et al. [29]. The mean FNW was obtained from the 1.5 cm wide femoral neck region of interest (area (cm2)/1.5 (cm)). The HAL reflects the distance along the femoral neck axis from the lateral margin at the base of the greater trochanter to the inner pelvic brim. The equations used were:
 |
 |
 |
Sample collection
Fasting blood was taken and 2-h fasting urine was collected at baseline and after 3, 6, 12 and 36 months of treatment. After blood was taken, it was allowed to clot at room temperature for half an hour. Serum was prepared after centrifugation at 3,000 rpm, during 15 minutes. It was subdivided in small aliquots and kept at −80°C until use. Urine was collected as the second morning void after an overnight fast.
Biochemical measurements
In serum the following markers were tested, all based on enzyme immuno assays (EIA): total osteocalcin (t-OC, BioSource Europe SA); under-carboxylated osteocalcin (uc-OC) and carboxylated osteocalcin (c-OC) both obtained from Takara Shuzo Co Ltd., Shiga, Japan; bone-specific alkaline phosphatase (BAP, Alkphase B, Quidel/Metra Biosystems San Diego, CA, USA); N-telopeptides of type I collagen (sNTX, Osteomark sNTx, Ostex International, Inc., Seattle, WA, USA) and 25-Hydroxy vitamin D (25-OH D, OCTEIA 25-hydroxy vitamin D, IDS, UK).
In the urine we measured free deoxypyridinoline by using an enzyme immunoassay (DPD, Quidel/Metra Biosystems). Urinary calcium (Ca) and creatinine (creat) were assessed according to standard methods. Dpd and Ca were corrected for the urinary creat concentration.
Statistics
The required numbers of participants in both age groups were assessed using separate power analyses (power of 90% and a significance level of 0.05). In the younger age group it was assumed that in the placebo group the mean bone loss is approximately 1.5% (4.5% in 3 years). The lowest detectable effect was set at an improvement of 30% (=3.15% bone loss after 3 years). Taking into account a drop-out frequency of 12% per year this group should consist of at least 76 subjects. In the older age group the mean bone loss was assumed to amount 1% per year (3% in 3 years). With a lowest detectable effect of 30% (=2.1% bone loss in 3 years) and a drop-out frequency of 19% per year, the minimal size of this group is 218 subjects.
Statistical analysis was performed using the statistical package SPSS (SPSS Corp, Chicago, IL). The calculations are based on the intention-to-treat principle. Drop-outs were included in the analyses, with the last data available in all subsequent measuring points. All follow-up measurements were related to the baseline values and the proportional changes were calculated for each subject. Differences between and within the different groups were assessed with the unpaired and paired Student’s t-test, respectively. All data are given as mean values ±SE. The linear regression model was used to investigate the effect of treatment after adjustment for potential confounders. Change of FNW, HAL and bone strength indices after 3 years of treatment were used as dependent variables and age and BMI as independent variables.
Results
Baseline measurements and follow-up
Three hundred fifty-one women were recruited for the study, 26 of whom were excluded before randomization for different reasons. After randomization there were 161 women receiving MK-4 and 164 women receiving placebo. The MK-4 group consisted of 54 women younger than 65 years of age and 107 women older than 65 years of age; in the placebo group these numbers were 51 and 113, respectively. The baseline characteristics of all participants in the placebo and MK-4 group are given in Table 1. No significant differences were found between both groups. However, when comparing the two age groups there was an age-related increase in weight and BMI and an age-related decrease in height (Table 2). DXA-BMD and BMC in the older age group were significantly lower at the site of the femoral neck, but not at the total hip and spine. From all serum markers for bone metabolism only BAP was higher in the older age group (borderline significant). Although there was an age-related decrease in serum vitamin D concentration, all participants had levels which were within the normal range at baseline (Tables 1 and 2) and at all subsequent measurements (data not shown). Urinary DPD/creat was markedly lower in the older age group compared to the younger group.
Table 1.
Baseline characteristics of all participants subdivided according to treatment
| Placebo n = 164 | MK-4 n = 161 | P-value | |
|---|---|---|---|
| Anthropomorphic variables: | |||
| Age (years) | 66.0 ± 0.5 | 65.9 ± 0.4 | 0.9 |
| Years since menopause | 17.7 ± 0.7 | 17.2 ± 0.6 | 0.6 |
| Weight (kg) | 71.8 ± 1.0 | 70.3 ± 0.9 | 0.3 |
| Height (cm) | 162 ± 0.5 | 161 ± 0.5 | 0.2 |
| BMI (kg/m2) | 27.3 ± 0.3 | 27.1 ± 0.4 | 0.7 |
| Calcium intake (mg/day) | 811 ± 26 | 870 ± 32 | 0.1 |
| Non-smoking (%) | 87 | 87 | 1.0 |
| Bone density characteristics: | |||
| DXA-BMD (g/cm2) of: femoral neck | 0.688 ± 0.007 | 0.706 ± 0.008 | 0.1 |
| Total hip | 0.842 ± 0.009 | 0.861 ± 0.008 | 0.1 |
| Lumbar L2-L4 | 0.931 ± 0.012 | 0.929 ± 0.013 | 0.9 |
| BMC (g) of: femoral neck | 3.54 ± 0.04 | 3.65 ± 0.04 | 0.06 |
| Total hip | 30.6 ± 0.43 | 31.4 ± 0.39 | 0.2 |
| Lumbar L2-L4 | 43.1 ± 0.72 | 42.4 ± 0.76 | 0.6 |
| Hip geometry: | |||
| Mean FNW (cm) | 3.43 ± 0.02 | 3.45 ± 0.017 | 0.4 |
| HAL (cm) | 11.6 ± 0.07 | 11.7 ± 0.06 | 0.2 |
| Bone strength indices: | |||
| CSI (g/kg.m) | 3.41 ± 0.055 | 3.52 ± 0.052 | 0.1 |
| BSI (g/kg.m) | 1.00 ± 0.017 | 1.04 ± 0.017 | 0.2 |
| ISI (g/kg.m) | 0.24 ± 0.004 | 0.26 ± 0.004 | 0.03 |
| Serum markers for bone metabolism: | |||
| c-OC (ng/mL) | 6.1 ± 0.2 | 6.2 ± 0.2 | 1.0 |
| uc-OC (ng/mL) | 3.3 ± 0.2 | 3.3 ± 0.2 | 0.4 |
| t-OC (ng/mL) | 13.2 ± 0.4 | 13.2 ± 0.5 | 0.7 |
| BAP (ng/mL) | 23.1 ± 0.7 | 23.6 ± 0.8 | 0.2 |
| NTX (nM) | 10.8 ± 0.2 | 10.7 ± 0.3 | 0.5 |
| 25-OH D (nM) | 67.2 ± 2.3 | 72.3 ± 2.6 | 0.09 |
| Urine markers for bone metabolism: | |||
| Creatinine (mmol/L) | 3.5 ± 0.3 | 3.6 ± 0.2 | 1.0 |
| DPD / creat (μmol/mol) | 7.4 ± 0.2 | 7.5 ± 0.2 | 0.7 |
| Calcium / creat (mol/mol) | 0.29 ± 0.02 | 0.29 ± 0.01 | 0.7 |
Only the BMC and the impact strength index of the femoral neck in the MK-4 group were slightly higher than in the placebo one. This difference is accounted for by expressing MK-4-induced changes as a percentage of the baseline values. All data are given ± SE.
Table 2.
Baseline characteristics of participants subdivided according to age
| Age 55–65 n = 105 | Age 65–75 n = 220 | P-value | |
|---|---|---|---|
| Anthropomorphic variables: | |||
| Age (years) | 59.0 ± 0.3 | 69.3 ± 0.2 | |
| Years since menopause | 9.7 ± 0.5 | 21.2 ± 0.4 | |
| Weight (kg) | 67.4 ± 1.0 | 72.8 ± 0.8 | 0.0001 |
| Height (cm) | 163 ± 0.6 | 161 ± 0.4 | 0.003 |
| BMI (kg/m2) | 25.4 ± 0.4 | 28.1 ± 0.3 | 0.0001 |
| Calcium intake (mg/day) | 816 ± 34 | 858 ± 27 | 0.4 |
| Non-smoking (%) | 88 | 87 | 0.9 |
| Bone density characteristics: | |||
| DXA-BMD (g/cm2) of: femoral neck | 0.716 ± 0.010 | 0.689 ± 0.006 | 0.02 |
| Total hip | 0.871 ± 0.012 | 0.842 ± 0.007 | 0.03 |
| Lumbar L2-L4 | 0.940 ± 0.015 | 0.925 ± 0.011 | 0.4 |
| BMC (g) of: femoral neck | 3.69 ± 0.06 | 3.55 ± 0.03 | 0.02 |
| Total hip | 31.4 ± 0.6 | 30.7 ± 0.3 | 0.3 |
| Lumbar L2-L4 | 44.0 ± 0.9 | 42.1 ± 0.6 | 0.1 |
| Hip geometry: | |||
| Mean FNW (cm): | 3.44 ± 0.022 | 3.44 ± 0.016 | 0.9 |
| HAL (cm): | 11.8 ± 0.08 | 11.6 ± 0.06 | 0.03 |
| Bone strength indices: | |||
| CSI (g/kg m): | 3.75 ± 0.068 | 3.31 ± 0.039 | 0.0001 |
| BSI (g/kg m): | 1.09 ± 0.022 | 0.98 ± 0.013 | 0.0001 |
| ISI (g/kg m): | 0.27 ± 0.005 | 0.24 ± 0.003 | 0.0001 |
| Serum markers for bone metabolism: | |||
| c-OC (ng/mL) | 5.9 ± 0.2 | 6.3 ± 0.2 | 0.2 |
| uc-OC (ng/mL) | 3.3 ± 0.2 | 3.2 ± 0.1 | 0.8 |
| t-OC (ng/mL) | 13.9 ± 0.6 | 12.8 ± 0.4 | 0.1 |
| BAP (ng/mL) | 21.8 ± 0.8 | 24.1 ± 0.7 | 0.05 |
| NTX (nM) | 11.0 ± 0.3 | 10.6 ± 0.2 | 0.2 |
| 25-OH D (nM) | 76.5 ± 2.7 | 66.3 ± 2.3 | 0.005 |
| Urine markers for bone metabolism: | |||
| creatinine (mmol/L) | 3.5 ± 0.3 | 3.6 ± 0.2 | 0.8 |
| DPD / creat (nmol/mmol) | 8.2 ± 0.2 | 7.1 ± 0.2 | 0.0001 |
| Calcium / creat (mmol/mmol) | 0.29 ± 0.02 | 0.29 ± 0.01 | 0.9 |
The differences in all age-related variables were highly significant. All data are given±SE.
After 3 years 257 women had completed the study: 133 women in the MK-4 group and 124 women in the placebo group. In total 68 women stopped during the study. This was 21% of the total. The largest group of participants (n = 30) stopped during the first 3 months of the trial. The most important reasons for discontinuation in this time period were various health problems (n = 18), low DXA-BMD (n = 17), lack of motivation (n = 10) and complaints about the capsules (n = 9). Subjects who stopped because of low DXA-BMD did so after consultation during the trial with their general practitioner; there were two complaints about the capsules in the MK-4 group and seven in the placebo group. Two participants died during the trial: one brain tumor and one cerebrovascular accident. Both casualties were in the placebo group. In total, 36 negative or positive side effects were mentioned by the participants. In the MK-4 group 16 women experienced negative effects and four experienced positive effects of the capsules; in the placebo group the numbers were 15 and one, respectively. The most frequent negative effects were gain of weight and gastro-intestinal complaints. However, there was no difference in total numbers of complaints between the MK-4 and the placebo group.
Effect of MK-4 supplementation
Effects on serum markers (if detectable) were maximal after 12 months of treatment, with no further increase of the difference from placebo at 36 months. In Fig. 1 we have plotted the changes of bone markers in serum during the first year. As was to be expected, a statistically significant effect of vitamin K treatment was observed on the serum concentrations of cOC and ucOC. The markers for bone formation (tOC and BAP) were also significantly higher in the MK-4 group as compared to the placebo one. No effect was observed on markers for bone resorption, or on DXA-BMD at any of the sites measured (Fig. 2a). Also urinary calcium excretion was not affected by MK-4 treatment (data not shown). It turned out that in the MK-4 group the BMC of the femoral neck decreased at a significantly lower rate than in the placebo one (Fig. 2b), and that this effect was paralleled by a significant increase in the femoral neck width, suggesting bone accrual at this critical site (Fig. 2c). The hip axis length (HAL) seemed to slightly increase with age in an MK-4 independent manner. From the DXA-BMD, the FNW and the HAL we have calculated the various indices for strength of the femur neck, and it resulted that MK-4 had a significant effect on all three indices (Fig. 2d). Notably the bending strength remained almost constant after the three years of intervention.
Fig.1.
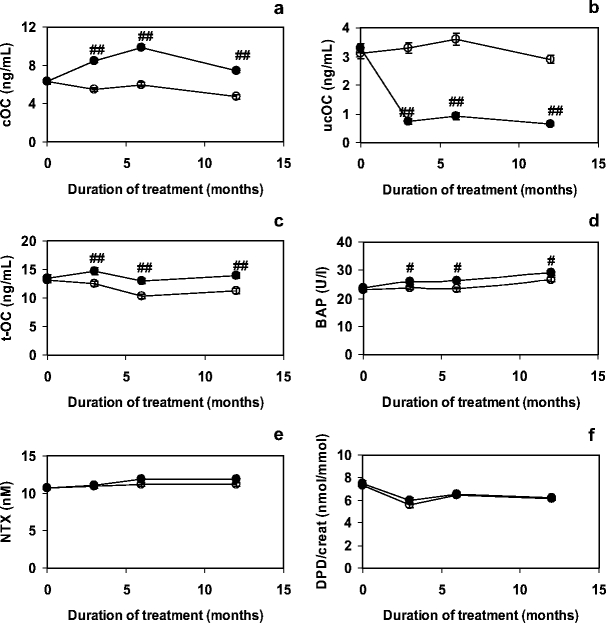
EffectofMK-4 on markers for bone metabolism during the first year of treatment. Bone formation markers are presented in graphs a–d (cOC, ucOC, tOC and BAP, respectively) and bone resorption markers in graph E and F (NTX and DPD/creat respectively). Closed symbols: MK-4; open symbols: placebo. Error bars represent SE. Significance of differences MK-4 compared to placebo: #: p < 0.05; ##: p < 0.005
Fig. 2.
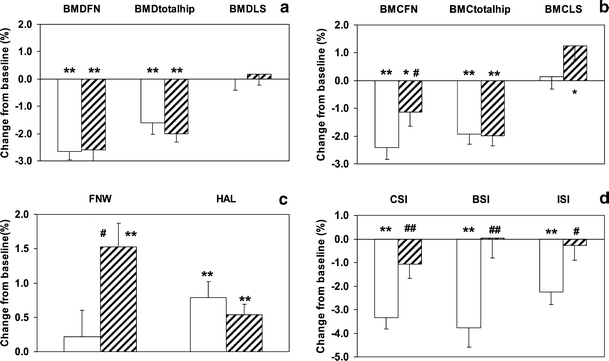
Effects of MK-4 on bone after 3 years of treatment. All data are expressed as a percentage of the respective baseline values. Graph A shows the data of DXA-BMD of the femoral neck (DXA-BMDFN), total hip (DXA-BMDtotalhip) and lumbar spine (DXA-BMDLS); graph B shows the BMC of the femoral neck (BMCFN), total hip (BMCtotalhip) and lumbar spine (BMCLS); graph C shows the femoral neck width (FNW) and hip axis length (HAL) and graph D shows the indices of the compression strength (CSI), bending strength (BSI) and impact strength (ISI). Open bars: placebo; hatched bars: MK-4. Error bars represent SE. Significance of change from baseline: *: p < 0.05, **: p < 0.005; significance of difference MK-4 compared to placebo: #: p < 0.05, ##: p < 0.005
Using a linear regression model, we have tested the statistical significance of the MK-4 induced effects. As is shown in Table 3, the differences in FNW, CSI, BSI and ISI between the MK-4 and placebo group were significant, both before and after adjustment for age and BMI. The effects on BMC, FNW and bone strength indices were observed for both age groups. As is shown in Fig. 3 the loss of bone strength in the MK-4 supplemented group was almost negligible in the group of 65 years and older.
Table 3.
Effect of MK-4 treatment on geometrical variables
| Unadjusted adjusted mean difference (SE) | p | Mean difference(SE) | p | |
|---|---|---|---|---|
| FNW (%) | +1.30 (0.50) | 0.01 | +1.34 (0.50) | 0.009 |
| HAL (%) | − 0.25 (0.26) | 0.3 | +0.23 (0.22) | 0.9 |
| CSI (%) | +2.26 (0.77) | 0.004 | +2.03 (0.76) | 0.008 |
| BSI (%) | +3.80 (1.2) | 0.002 | +3.83 (1.2) | 0.001 |
| ISI (%) | +1.98 (0.82) | 0.02 | +1.72 (0.79) | 0.03 |
The increase/decrease of each variable was calculated as a percentage from its baseline value. The differences between the change in MK-4 group and that in the placebo group are given. A positive value reflects a more pronounced effect in the MK-4, a negative value reflects a more pronounced effect in the placebo group. The values are given before and after adjustment for age and BMI, adjusted values are quoted at the mean values for age and BMI of the total group (age = 65.9 years; BMI = 27.2 kg/m2).
Fig. 3.

Effect of MK-4 on bone strength indices in 2 different age groups (55–65 and 65–75 years of age). All data are expressed as the mean percent change relative to the respective baseline values after 3 years of treatment with either MK-4 or placebo. Graph A shows the compact strength index (CSI), graph B the bending strength index (BSI) and graph C the impact strength index (ISI). Open bars: placebo; hatched bars: MK-4. Error bars represent SE. Significance of change from baseline: *: p < 0.05, **: p < 0.005; significance of difference MK-4 compared to placebo: #: p < 0.05
Discussion
In this paper we demonstrate that the main effect of vitamin K2 on bone in the hip is an increase of the femoral neck BMC and width, resulting in maintenance of the calculated bone strength even at decreasing DXA-BMD after the menopause. This makes K2 to an interesting compound for combination therapy with other food supplements (calcium, vitamin D) or drugs (bisphosphonates) with known effects on also DXA-BMD. The potential synergism between K2 and other supplements/drugs, however, requires further investigation.
In the literature there are many indications that vitamin Kcontributes to the maintenance of optimal bone strength. Besides various population-based studies and a number of clinical intervention trials investigating the effects of increased vitamin K intake, it has also been reported that subjects receiving vitamin K antagonists (oral anticoagulant therapy) have lower DXA-BMD and increased fracture risk [30–32]. Also experimental animals developed osteopenia upon treatment with the vitamin K antagonist warfarin [33]. On the other hand we must conclude, however, that in intervention trials the reported effects on DXA-BMD of vitamin K alone were small; most studies published thus far indicate that only in combination with calcium and vitamin D, vitamin K has a synergistic effect on DXA-BMD [18, 19, 34]. Osteocalcin is the most abundant vitamin K-dependent protein in bone, and the phenotype of transgenic osteocalcin-deficient mice suggests that it is primarily involved in the correct arrangement of hydroxyapatite crystals and in structuring the correct dimensions of bone [21]. Both factors may contribute to the total bone strength. Hence studies in which DXA-BMD is the only clinical endpoint do not give conclusive evidence on bone strength. If, for instance, the femoral neck DXA-BMD remains constant but increases in width the bone will become stronger and more resistant to fracture. Therefore, we have used mathematical procedures for calculating three indices for bone strength at the site of the femoral neck.
Despite the very high dose of MK-4 used in the present trial, no effect was found on the DXA-BMD of the femoral neck, the total hip or the lumbar spine. On the other hand, significant positive effects were observed both on the femoral neck BMC and width. The relation between DXA-BMD, BMC and FNW can be seen from the formula: DXA-BMD=BMC/area, where FNW is one of the dimensions of the surface area. In case FNW is increasing, the projected area of the DXA-BMD measurement will increase too. In case BMC remains constant, the DXA-BMD values will decrease. In case FNW increases and BMC increases adequately, DXA-BMD remains constant, with a concomitant increase of bone strength. The importance of the FNW for the calculated bone strength is obvious from the equations for all three bone strength indices. Our results showed that during the entire intervention period there was no or very little decrease in bone strength in the K2 treated group, whereas there was substantial loss of bone strength in the placebo one. The favourable effect was found both in the young postmenopausal group (55–65 years old) as well as in the older group (65–75 years old). Since together with vitamin D and calcium vitamin K was also reported to have a positive effect on DXA-BMD it might even be speculated that the combination of these supplements will result in an increase of bone strength. After we obtained these data, we re-analysed previous studies from our lab, and it turned out that vitamin K1 had only little or no effect on the FNW. It should be pointed out, however, that the doses used in these studies were 1 mg/day and 10 mg/day, which is considerably lower than the 45 mg/day used in the present study.
The first question that may be raised is whether the very high dose of vitamin K used in our study is required to obtain the observed effect. The present recommendations for vitamin K intake vary between 90 and 120 micrograms per day, and in a dose of 45 milligrams per day the vitamin is used as a drug rather than as a food supplement. It should be realized, however, that MK-4 has a very short biological halflife time (1–2 h), which is the reason why it was given three times daily in a dose of 15 mg per helping. Even at this regimen its short halflife will result in fluctuating K2 serum levels, which may explain the requirement of a high dose. At this time no data are available on the efficacy of MK-4 at lower doses, for instance in the range between 100–500 micrograms per day. A possible alternative to MK-4 might be using MK-7, the K2 vitamin most abundantly found in the Japanese food natto (fermented soy beans). MK-7 has probably a comparable effect as MK-4 [35], but it has a halflife in the circulation of 3 days, resulting in more constant plasma levels and accumulation in the blood and various tissues. Therefore, MK-7 is the most logical choice for use as a low-dose food supplement, because even at low intake relatively high blood and tissue levels can be obtained. Clinical trials in which the efficacy of MK-7 is tested are, however, lacking at this time. From our study it is not clear whether the high MK-4 regimen will increase vertebral bone strength in a similar way as observed for the DXA-derived femoral neck bone strength. To our knowledge no reliable formulas are available for calculating vertebral compression strength, the most important strength index for the vertebrae. However, the substantial and significant effect of MK-4 on the lumbar spine BMC warrants more elaborate studies in which the effect on vertebral fracture risk is investigated. A substantial risk reduction for vertebral fractures by long-term MK-4 treatment has also been reported by a number of Japanese studies [36, 37].
Another question that needs to be answered is why K2 has a much more pronounced effect than K1. One reason may be the different doses used: 45 mg/day for MK-4 and 1–10 mg/day for K1. Based on our present knowledge, all three doses are an excess; it seems not unlikely, therefore, that there is a qualitative difference between K1 and K2. The only difference between both vitamins is the aliphatic side chain, which does not influence the coenzyme function, but which does affect the distribution of vitamin K over the lipoproteins in the blood, and the transport to and absorption by the various tissues. It has been demonstrated in human volunteers that both K1 and K2 are transported to the liver via triglycerides, but that only K2 vitamins (both MK-4 and MK-7) are incorporated into the LDL fraction for transport to extrahepatic tissues [39]. It is not surprising, therefore, that in animal experiments it was found that K1 mainly accumulates in the liver, whereas MK-4 is far more abundant in other tissues including pancreas, bone and vessel wall [10]. In that perspective, K2 seems to be the most logical choice for supplementation because notably bone and arteries (and not the liver) were reported to have a sub-optimal vitamin K status in the majority of the healthy population.
A limitation of this study is that it was conducted in non-osteoporotic women, in whom we tried to decrease bone loss and to maintain bone strength. Therefore, this study does not allow conclusions regarding beneficial effects of vitamin K2 on bone quality in women who have been diagnosed with osteoporosis already. A further limitation is that the study was exclusively conducted on women, so that no conclusions can be drawn for bone loss in men. A further limitation of our study was that the DXA-BMD of the spine was determined only in the postero-anterior (PA) position. This measurement includes not only the trabecular bone of the vertebral body, but also a substantial amount of cortical bone from posterior elements. During ageing, degenerative changes in the spine such as osteoarthritis or sclerosis of the endplates may occur. In those cases, PA projection may result in incorrect interpretation of the DXA-BMD and BMC values because the observed increase is due to degenerative changes and is not based on treatment effect. Lateral DXA-BMD measurements evaluate exclusively the vertebral body, allowing more sensitive detection of postmenopausal bone loss or DXA-BMD changes during therapy [38]. At the start of this study lateral DXA-BMD monitoring, however, was not yet available for clinical trials in our hospital.
In conclusion we have demonstrated that vitamin K2 is capable of improving both the BMC and bone geometry at critical sites, leading to maintenance of the DXA-derived femoral neck bone strength in postmenopausal women during a 3-year study period. Even in the very high doses used in our study, adverse side effects of MK-4 were minor and not different from the placebo group. Therefore, it seems desirable to evaluate the cost-benefits of supplementing low dose vitamin K2 to all postmenopausal women. The optimal dose, the preferred form (MK-4 or MK-7), and synergistic effects of complementary food supplements (calcium, vitamin D) or medication (bisphosphonates), however, require further research.
Acknowledgement
The authors wish to thank EISAI Co. Ltd. (Tokyo, Japan) which supported this study by supplying vitamin K2 (menatetrenone) and a non-restricted research fund.
References
- 1.Kaptoge S, Dalzell N, Jakes RW, Warchem N, Day NE, Khaw KT, Beck TJ, Loveridge N, Reeve J (2003) Hip section modulus, a measure of bending resistance, is more strongly related to reported physical activity than DXA-BMD. Osteoporos Int 14:941–949 [DOI] [PubMed]
- 2.Berkner KL, Runge KW (2004) The physiology of vitamin K nutrititure and vitamin K-dependent protein function in atherosclerosis. J Thromb Haemostas 2:2118–2132 [DOI] [PubMed]
- 3.Schurgers LJ, Geleijnse JM, Grobbee DE, Pols HAP, Hofman A, Witteman JCM, Vermeer C (1999) Nutritional intake of vitamins K-1 (phylloquinone) and K-2 (menaquinone) in The Netherlands. J Nutr Environm Med 9:115–122 [DOI]
- 4.Schurgers LJ, Vermeer C (2000) Determination of phylloquinone and menaquinones in food: effect of food matrix on circulating vitamin K concentrations. Haemostasis 30:298–307 [DOI] [PubMed]
- 5.Hart JP, Catterall A, Dodds RA, Klenerman L, Shearer MJ, Bitensky L, Chayen J (1984) Circulating vitamin K1 levels in fractured neck of femur. Lancet ii:283 [DOI] [PubMed]
- 6.Hart JP, Shearer MJ, Klenerman L, Caterall A, Reeve J, Sambrook PN, Dodds RA, Bitensky L, Chayen J (1985) Electrochemical detection of depressed circulating levels of vitamin K1 in osteoporosis. J Clin Endocrinol Metab 60:1268–1269 [DOI] [PubMed]
- 7.Feskanich D, Weber P, Willett WC, Rockett H, Booth S, Colditz GA (1999) Vitamin K intake and hip fractures in women: a prospective study. Am J Clin Nutr 69:74–79 [DOI] [PubMed]
- 8.Booth SL, Tucker KL, Chen H, Hannan MT, Gagnon DR, Cupples LA, Wilson PWF, Ordovas J, Schaefer EJ, Dawson-Hughes B, Kiel DP (2000) Dietary vitamin K intakes are associated with hip fracture but not with bone mineral density in elderly men and women. Am J Clin Nutr 71:1201–1208 [DOI] [PubMed]
- 9.Booth SL, Broe KE, Gagnon DR, Tucker KL, Hannan MT, McLean RR, Dawson-Hughes B, Wilson PWF, Cupples LA, Kiel DP (2003) Vitamin K intake and bone mineral density in women and men. Am J Clin Nutr 77:512–516 [DOI] [PubMed]
- 10.Ronden JE, Thijssen HHW, Vermeer C (1998) Tissue distribution of K-vitamers under different nutritional regimens in the rat. Biochim Biophys Acta 1379:16–22 [DOI] [PubMed]
- 11.Szulc P, Chapuy M-C, Meunier PJ, Delmas PD (1993) Serum undercarboxylated osteocalcin is a marker of the risk of hip fracture in elderly women. J Clin Invest 91:1769–1774 [DOI] [PMC free article] [PubMed]
- 12.Szulc P, Chapuy M-C, Meunier PJ, Delmas PD (1996) Serum undercarboxylated osteocalcin is a marker of the risk of hip fracture: a three year follow-up study. Bone 18:487–488 [DOI] [PubMed]
- 13.Vergnaud P, Garnero P, Meunier PJ, Breart G, Kamihagi K, Delmas PD (1997) Undercarboxylated osteocalcin measured with a specific immunoassay predicts hip fracture in elderly women: the EPIDOS study. J Clin Endocrinol Metab 82:719–724 [DOI] [PubMed]
- 14.Luukinen H, Kakonen S-M, Petterson K, Koski K, Laippala P, Lovgren T, Kivela S-L, Vaananen HK (2000) Strong prediction of fractures among older adults by the ratio of carboxylated to total serum osteocalcin. J Bone Miner Res 15:2473–2478 [DOI] [PubMed]
- 15.Szulc P, Arlot M, Chapuy M-C, Duboeuf F, Meunier PJ, Delmas PD (1994) Serum undercarboxylated osteocalcin correlates with hip bone mineral density in elderly women. J Bone Miner Res 9:1591–1595 [DOI] [PubMed]
- 16.Knapen MHJ, Nieuwenhuijzen Kruseman AC, Wouters RSME, Vermeer C (1998) Correlation of serum osteocalcin fractions with bone mineral density in women during the first 10 years after menopause. Calcif Tissue Int 63:375–379 [DOI] [PubMed]
- 17.Braam LAJLM, Knapen MHJ, Geusens P, Brouns F, Vermeer C (2003) Factors affecting bone loss in female endurance athletes: a two-year follow -up study. Am J Sports Med 31:889–895 [DOI] [PubMed]
- 18.Braam LAJLM, Knapen MHJ, Geusens P, Brouns F, Hamulyák K, Gerichhausen MJW, Vermeer C (2003) Vitamin K1 supplementation retards bone loss in postmenopausal women between 50 and 60 years of age. Calcif Tissue Int 73:21–26 [DOI] [PubMed]
- 19.Iwamoto J, Takeda T, Sato Y (2004) Effects of vitamin K2 on osteoporosis. Curr Pharmaceut Design 10:2557–2576 [DOI] [PubMed]
- 20.Gundberg CM, Nieman SD, Abrams S, Rosen H (1998) Vitamin K status and bone health: an analysis of methods for determination of undercarboxylated osteocalcin. J Clin Endocrinol Metab 83:3258–3266 [DOI] [PubMed]
- 21.Ducy P, Desbois C, Boyce B, Pinero G, Story B, Dunstan C, Smith E, Bonadio J, Goldstein S, Gundberg C, Bradley A, Karsenty G (1996) Increased bone formation in osteocalcin-deficient mice. Nature 382:448–452 [DOI] [PubMed]
- 22.Crabtree N, Lunt M, Holt G, Kröger H, Burger H, Grazio S, Khaw K-T, Lorenc RS, Nijs J, Stepan J, Falch JA, Miazgowski T, Raptou P, Pols HAP, Dequeker J, Havelka S, Hoszowski K, Jajic I, Czekalski S, Lyritis G, Silman AJ, Reeve J (2000) Hip geometry, bone mineral distribution, and bone strength in European men and women: the EPOS study. Bone 27:151–159 [DOI] [PubMed]
- 23.Alonso CG, Curiel MD, Carranza FH, Cano RP, Pérez AD (2000) Femoral bone mineral density, neck-shaft angle and mean femoral neck width as predictors of hip fracture in men and women. Osteoporos Int 11:714–720 [DOI] [PubMed]
- 24.Bergot C, Bousson V, Meunier A, Laval-Jeantet M, Laredo JD (2002) Hip fracture risk and proximal femur geometry from DXA scans. Osteoporos Int 13:542–550 [DOI] [PubMed]
- 25.Pulkkinen P, Partanen J, Jalovaara P, Jamsa T (2004) Combination of bone mineral density and upper femur geometry improves the prediction of hip fracture. Osteoporos Int 15:274–280 [DOI] [PubMed]
- 26.El-Kaissi S, Pasco JA, Henry MJ, Panahi S, Nicholson JG, Nicholson GC, Kotowicz MA (2005) Femoral neck geometry and hop fracture risk: the Geelong osteoporosis study. Osteoporos Int 16:1299–1303 [DOI] [PubMed]
- 27.Prentice A, Parsons TJ, Cole TJ (1994) Uncritical use of bone mineral density in absorptiometry may lead to size-related artefacts in the identification of bone mineral determinants. Am J Clin Nutr 60:837–842 [DOI] [PubMed]
- 28.Heaney RP (2005) DXA-BMD: the problem. Osteoporos Int 16:1013–1015 [DOI] [PubMed]
- 29.Karlamangla AS, Barrett-Connor E, Young J, Greendale GA (2004) Hip fracture risk assessment using composite indices of femur neck strength: the Rancho Bernardo study. Osteopros Int 15:62–70 [DOI] [PubMed]
- 30.Caraballo PJ, Heit JA, Atkinson EJ, Silverstein MD, O’Fallon WM, Castro MR, Melton LJ III (1999) Long-term usse of oral anticoagulants and the risk of fracture. Arch Intern Med 159:1750–1756 [DOI] [PubMed]
- 31.Gage BF, Birman-Deych E, Radford MJ, Nilasena DS, Binder EF (2006) Risk of osteoporotic fracture in elderly patients taking warfarin. Results from the national registry of atrial fibrillation 2. Arch Int Med 166:241–246 [DOI] [PubMed]
- 32.Barnes C, Newall F, Ignjatovic V, Wong P, Cameron F, Jones G, Monagle P (2005) Reduced bone density in children on long-term warfarin. Pediatr Res 57:578–581 [DOI] [PubMed]
- 33.Pastoureau P, Vergnaud P, Meunier PJ, Delmas PD (1993) Ostopenia and bone-remodeling abnormalities in warfarin-treated lambs. J Bone Miner Res 8:1417–1426 [DOI] [PubMed]
- 34.Bolton-Smith C, Mole PA, McMurdo MET, Paterson CR, Shearer MJ (2001) Two-year intervention study with phylloquinone (vitamin K1), vitamin D and calcium: effect on bone mineral content of older. Ann Nutr Metab 45(suppl 1):604 (Abstract)
- 35.Kaneki M, Hedges SJ, Hosoi T, Fujiwara S, Lyons A, Crean SJ, Ishida N, Nakagawa M, Takechi M, Sano Y, Mizuno Y, Hoshino S, Miyao M, Inoue S, Horiki K, Shiraki M, Ouchi Y, Orimo H (2001) Japanese fermented soybean food as the major determinant of the large geographic difference in circulating levels of vitamin K2: possible implications for hip-fracture risk. Nutrition 17:315–21 [DOI] [PubMed]
- 36.Iwamoto J, Takeda T, Ichimura S (2001) Effect of menatetrenone on bone mineral density and incidence of vertebral fractures in postmenopausal women with osteoporosis: a comparison with the effect of etidronate. J Orthop Sci 6:487–492 [DOI] [PubMed]
- 37.Shiraki M, Shiraki Y, Aoki C, Miura M (2000) Vitamin K2 (menatetrenone) effectively prevents fractures and sustains lumbar bone mineral density in osteoporosis. J Bone Miner Res 15:515–521 [DOI] [PubMed]
- 38.Greenspan SL, Maitland-Ramsey L, Myers E (1996) Classification of osteoporosis in the elderly is dependent on site-specific analysis. Calcif Tissues Int 58:409–414 [DOI] [PubMed]
- 39.Schurgers LJ, Vermeer C (2002) Differential lipoprotein transport pathways of K-vitamins in healthy subjects. Biochim Biophys Acta 1570:27–32 [DOI] [PubMed]