Abstract
The acquisition of lever pressing by rats and the occurrence of unreinforced presses at a location different from that of the reinforced response were studied using different delays of reinforcement. An experimental chamber containing seven identical adjoining levers was used. Only presses on the central (operative) lever produced food pellets. Groups of 3 rats were exposed to one of seven different tandem random-interval (RI) fixed-time (FT) schedules. The average RI duration was the complement of the FT duration such that their sum yielded a nominal 32-s interreinforcement interval on average. Response rate on the operative lever decreased as the FT value was lengthened. The spatial distribution of responses on the seven levers converged on the operative lever when the FT was 0 or 2 s and spread across the seven levers as the FT value was lengthened to 16 or 32 s. Presses on the seven levers were infrequent during the FT schedule. Both operative- and inoperative-lever pressing intertwined in repetitive patterns that were consistent within subjects but differed between subjects. These findings suggest that reinforcer delay determined the response-induction gradient.
Keywords: Response acquisition, response induction, response location, delayed reinforcement, lever pressing, rats
A response is acquired when the rate of responding increases over time above its operant level as a function of the response–reinforcer relation (cf. Sidman, 1960). In acquisition, topographic properties of the response are selected by the reinforcer. For example, if a contingency involving the force, duration, or spatial location of the response is established, only responses that fulfill the contingency are differentially reinforced. As a consequence, the rate of occurrence of the selected response increases (cf. Skinner, 1938). However, reinforcement does not result in complete response stereotypy; response variability is always observed.
The effects of reinforcement are not limited to the reinforced response but extend to responses that share common properties with it (Skinner, 1953). If a response dimension that includes the reinforced response and responses that do not fulfill the contingency is recorded, it is possible to show that responses falling just outside the specific criteria for reinforcement also increase even though they are not reinforced (e.g., Galbicka & Platt, 1989; Hefferline & Keenan, 1963; Herrick, 1964; Hull, 1943; Notterman & Mintz, 1965; Skinner, 1938).
Skinner (1938) first suggested that the increase in responses falling outside the reinforced class could be explained in terms of response induction (response generalization is a synonym, Catania, 1998). Skinner stated that reinforcer delivery not only strengthens the reinforced response but also induces variations of the reinforced response that undershoot or exceed the criterion for reinforcement. Following Skinner, several authors suggested that the induction of response variation is an important property of response shaping (e.g., Catania, 1973, 1998; Keller & Schoenfeld, 1950; Millenson & Leslie, 1979; Segal, 1972).
Hull (1943, pp. 304–306) described an unpublished experiment conducted by Hays and Woodbury who used rats as subjects and reinforced lever presses that exceeded a minimum of 21 g of force. Hays and Woodbury recorded a continuous distribution of responses with different forces and found that responses of 13 to 29 g increased but those of 29 to 41 g decreased. Responses that barely undershot the force criterion were more frequent than less forceful responses in the resultant response-induction gradient (cf. Hefferline & Keenan, 1963; Kuch, 1974). Hays and Woodbury subsequently increased the force requirements to 36 g. Forces ranging from 17 to 51 g were emitted and were distributed in a manner similar to the previous induction gradient with a maximum at 41 g. A notable aspect of Hays and Woodbury's results is that when the minimum required force was set at 21 g the gradient was steeper than when it was set at 36 g. Thus, the shape of the response-induction gradient varied with the force requirement. Notterman and Mintz (1965) replicated Hays and Woodbury's findings using a minimum and a maximum force requirement. They also found that, as the minimum requirement was increased, a broader distribution of response force was induced.
Several authors have reported support for the notion that the shape of the response gradient depends on parameters of reinforcement. For example, Di Lollo, Ensminger, and Notterman (1965) reinforced each lever press that exceeded 8 g of force with 20, 40, 60, 80 or 100 mg of food for different groups of rats. They found that variance in response force increased as reinforcer amount decreased.
Another parameter of reinforcement that affects response induction is reinforcer frequency. Skinner (1938) restricted reinforcement to lever presses with a minimum force or duration. Responses that undershot the requirement were infrequent. When Skinner exposed the rats to extinction, the variance in force or duration markedly increased.
In a study with human subjects, Hefferline and Keenan (1963) used money to reinforce small movements of the thumb on a fixed-ratio (FR) 1 schedule without response shaping. Galvanometer readings were recorded in a procedure with a specific amplitude requirement for reinforcement. The authors found that as the single session progressed, the thumb-movement gradient was centered at the reinforced amplitude. When they introduced extinction, response variability increased, that is, the response gradient became flatter. Other studies have shown that a decrease in reinforcer frequency affects the variability of several response parameters, including location (e.g., Antonitis, 1951; Boren, Moerschbaecher, & Whyte, 1978; Eckerman & Lanson, 1969), duration (e.g., Margulies, 1961; Millenson, Hurwitz, & Nixon, 1961), force (e.g., Notterman & Mintz, 1965) and sequential structure (e.g., Tatham, Wanchisen, & Hineline, 1993).
Given these findings, it is conceivable that the duration of an unsignaled delay of reinforcement—another parameter of reinforcement—may produce systematic effects on response induction. Although the effects of delayed reinforcement on the acquisition and maintenance of responding have been studied extensively (see, e.g., Lattal, 1987; Schneider, 1990; Tarpy & Sawabini, 1974), the effects of delay duration on response induction remain unknown. The present study investigated this relation.
The most common finding in the studies of unsignaled delayed reinforcement is that, as the delay interval is lengthened, responding decreases. This finding, termed a delay-of-reinforcement gradient, has been reported in studies of the acquisition of new responses with delayed reinforcement (e.g., Bruner, Ávila, Acuña, & Gallardo, 1998) as well as with already established responses (e.g., Sizemore & Lattal, 1978).
Two procedures generally used to schedule delay of reinforcement differ in the consequences they provide for responses that occur during the delay interval. In resetting-delay procedures, every response during the delay interval resets the delay timer. Although resetting-delay procedures keep the delay duration between the response and its reinforcer constant, they essentially limit response rate (Sutphin, Byrne, & Poling, 1998). This is not the case with nonresetting delay procedures where responses during the delay interval have no programmed consequences and thus do not impose a limit. Even though the obtained delay duration with non-resetting delayed reinforcement can be shorter than the programmed delay, Wilkenfield, Nickel, Blakely, and Poling (1992) demonstrated that the obtained delay duration closely approximates the programmed delay duration.
The present experiment studied the spatial distribution of unreinforced responses during the acquisition and maintenance of lever pressing using a nonresetting delay-of-reinforcement procedure. A continuum of response locations was provided in order to record unreinforced responses. Two previous studies of the acquisition of a new response with the non-resetting delay-of-reinforcement procedure reported the occurrence of inoperative-lever pressing under different delay durations (Wilkenfield et al., 1992; LeSage, Byrne, & Poling, 1996). Although the researchers found that the rate of inoperative-lever pressing increased when the delay interval was lengthened from 0 to 16 s, the finding was not a focus of their reports. Furthermore, neither study replicated the common finding of a delay-of-reinforcement gradient with the operative lever.
Wilkenfield et al. (1992) suggested that the lack of systematic effects of delayed reinforcement on operative-lever pressing might have been due to differential satiation, as their procedure involved a single 8-hr session in which tandem FR 1 fixed time (FT) schedules of reinforcement operated. Thus, the subjects that were exposed to shorter delays received more food than the subjects exposed to longer delays.
The present study clarified the effects of delayed reinforcement on inoperative-lever pressing by using a procedure more conducive to obtaining a delay-of-reinforcement gradient with the operative lever than the procedure used in the studies by Wilkenfield et al. (1992) and LeSage et al. (1996). A multisession design was used in which tandem random-interval (RI) FT (tand RI FT) schedules were implemented (cf. Bruner et al., 1998) in which the nominal interreinforcement interval was held constant.
Method
Subjects
Twenty-one experimentally naive, male Wistar rats, 3 months old at the beginning of the experiment, were the subjects. Throughout the experiment the rats were kept at 80% of their free-feeding weight and were housed individually with free access to water.
Apparatus
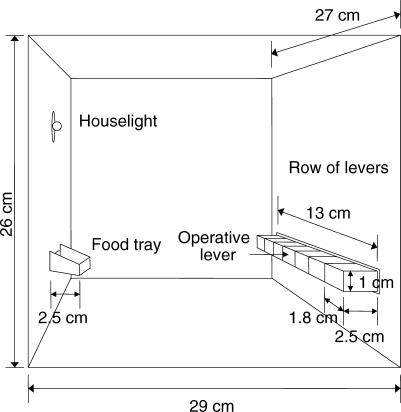
One Plexiglas experimental chamber, 26 cm high by 29 cm long by 27 cm wide, was used. Figure 1 shows the experimental chamber.
Fig 1. A diagram of the experimental chamber containing the seven levers.
The front panel of the chamber was equipped with seven horizontally-aligned levers centered in the panel 5 cm above the grid floor and separated 1 mm from each other. The metal levers were custom-built. Each was 1 cm high and 1.8 cm wide, protruded 2.5 cm into the chamber, and was operated by a downward force of 0.15 N. Centered in the opposite panel was a food tray that was 2 cm wide, protruded 2.5 cm into the chamber, and was located 4.5 cm above the chamber floor. A houselight was located above the food tray, 16 cm above the chamber floor. A BRS/LVE (Model DDH-020) pellet dispenser delivered 25-mg food pellets made by remolding pulverized rat food. The chamber was enclosed within a sound-attenuating wooden box equipped with a fan. Experimental events were controlled and recorded in an adjacent room by an IBM-compatible computer equipped with an Advantech PC-LabCard interface (model PCL-725) using a program written in GW-BASIC.
Procedure
Each subject was magazine-trained by delivering response-independent food pellets until the subject reliably approached the food tray and consumed the pellet on 50 consecutive operations of the pellet dispenser.
The levers were identified as 1 to 7, left to right as viewed when facing the wall on which they were mounted. Without further training the rats were exposed to a tand RI FT schedule on lever 4 (the center or operative lever), where the RI value = T/p. Groups of 3 rats were exposed to FT values of 0, 1, 2, 4, 8, 16, or 32 s. Since increasing the FT schedule while leaving the RI schedule constant would have lengthened the programmed interreinforcement interval (IRI), the RI component was established as the complement of the FT component so that their sum yielded a constant programmed 32-s IRI (cf. Sizemore & Lattal, 1978). The different RI and FT schedules and the values of T and p used to program the RI schedules are shown in Table 1, as are the assignments of subjects to groups. Presses on levers 1, 2, 3, 5, 6, and 7 (the inoperative levers) were recorded but did not have other programmed consequences. Each tandem schedule was in effect for 50 sessions. Previous research in our laboratory suggested that this number of sessions was sufficient to show stable effects of delayed reinforcement on lever pressing. A session ended after either 1 hr or after 50 reinforcers were delivered, whichever occurred first. Sessions were conducted 7 days per week.
Table 1.
Time (T) and probability (p) values used to program the random-interval (RI) schedule, RI values, and fixed-time (FT) values.
| Rat | RI value = T/p |
Tandem schedule values |
||
| T (s) | p | RI | FT | |
| R1, R2, R3 | 4 | 0.125 | 32 | 0 |
| R4, R5, R6 | 4 | 0.129 | 31 | 1 |
| R7, R8, R9 | 4 | 0.133 | 30 | 2 |
| R10, R11, R12 | 4 | 0.142 | 28 | 4 |
| R13, R14, R15 | 4 | 0.166 | 24 | 8 |
| R16, R17, R18 | 4 | 0.250 | 16 | 16 |
| R19, R20, R21 | 0 | 1.000 | 0 | 32 |
Results
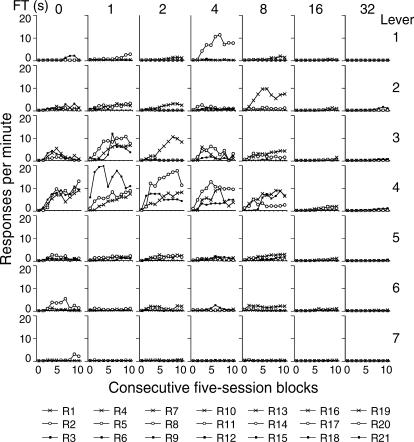
The mean response rate on each lever across both components of the tandem schedule was calculated for each consecutive block of five sessions (a total of 10 blocks). Figure 2 shows the results for the seven levers (rows) and for the 3 rats in each group. The columns correspond to the FT schedules.
Fig 2. Mean rate of lever pressing during 10 consecutive five-session blocks for each subject on each lever (rows) across the different FT schedules (columns).
A doubly multivariate (7 × 10) repeated measures ANOVA was used to analyze the effects of the FT value (between-subjects factor) and length of exposure to the condition or number of sessions (repeated measure) on response rate for each lever (seven different measures). Table 2 shows the results of the ANOVA. The FT duration had a statistically significant effect on response rate for levers 3 and 4 and no effect on the other levers. Post-hoc analyses (polynomial contrast) showed that as the FT value was lengthened there was a gradually lower response rate on levers 3 and 4 (linear relation). The number of sessions had a significant effect on response rate on levers 2, 3, 4, 5 and 6. On levers 1 and 7, response rate did not vary systematically across the 10 five-session blocks. A post-hoc test (polynomial contrast) showed that, across sessions, responding on levers 3, 4, and 5 increased to its maximum and decreased slightly during the last sessions (a quadratic relation). On lever 2, response rate increased gradually across the five-session blocks (linear relation). Although the number of sessions had a significant effect on response rate on lever 6, it was not systematic (a 7th -order relation). It should be noted that, for most of the subjects, responses were concentrated on the operative lever and on the levers to its left.
Table 2.
F coefficients from the doubly multivariate repeated measures ANOVA. The analysis compared average response rate in 10 consecutive five-session blocks across the different FT schedules. Given that response rate was measured on seven different levers, the response rate on each lever was considered as a different measure.
| Doubly multivariate repeated measures ANOVA | |||
| Lever | 1 | 2 | 3 |
| FT | F (6, 14) = 0.92 | F (6, 14) = 0.92 | F (6, 14) = 3.71* |
| Sessions | F (9, 126) = 1.87 | F (9, 126) = 3.65* | F (9, 126) = 7.79** |
| FT × sessions | F (54, 126) = 0.71 | F (54, 126) = 0.69 | F (54, 126) = 2.66* |
| Lever | 4 | 5 | 6 |
| FT | F (6, 14) = 3.38* | F (6, 14) = 2.10 | F (6, 14) = 0.65 |
| Sessions | F (9, 126) = 14.60** | F (9, 126) = 9.61** | F (9, 126) = 2.10* |
| FT × sessions | F (54, 126) = 1.60 | F (54, 126) = 1.28 | F (54, 126) = 1.20 |
| Lever | 7 | ||
| FT | F (6, 14) = 0.99 | ||
| Sessions | F (9, 126) = 1.26 | ||
| FT × sessions | F (54, 126) = 0.85 | ||
| Polynomial contrast | |||
| FT | |||
| Lever | 3 | 4 | |
| Linear | −2.61** | −6.74** | |
| SEM | 0.86 | 1.70 | |
| Sessions | |||
| Lever | 3 | 4 | 5 |
| Quadratic | F (1, 14) = 35.02** | F (1, 14) = 16.69** | F (1, 14) = 11.64** |
| Lever | 2 | ||
| Linear | F (1, 14) = 5.91* | ||
| Lever | 6 | ||
| 7th order | F (1, 14) = 5.40* | ||
* = p < .05 ** = p < .01
Most of the subsequent analyses were performed separately for the data from the first and the last blocks of five sessions to show different aspects of the acquisition of lever pressing.
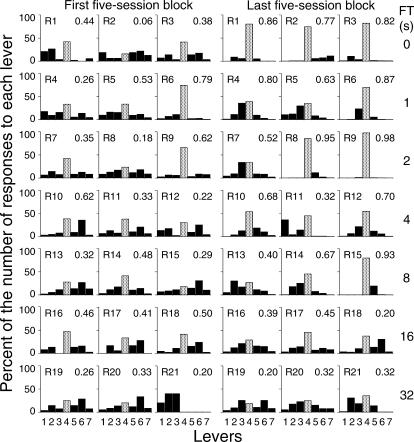
To determine whether the spatial distribution of responses to the seven levers varied according to the number of sessions of exposure to the condition and the FT schedule value, the number of responses on each lever was expressed as a percentage of the overall number of responses on all levers across both components of the tandem schedule. The responses on each lever were expressed as a percentage of overall responding to allow comparisons of the width and the height of the distribution of responses independently of response rate changes. Figure 3 shows these percentages for each lever and each subject over the first and the last five-session blocks. For most of the subjects, during both the first and the last five-session block the percentage of responses on the operative lever (Lever 4) was higher than the percentages on any of the inoperative levers. However, by the last five-session block the percentage of responses on the inoperative levers was usually higher for those levers closer to the operative lever than for the levers that were further away.
Fig 3. Presses on each lever as a percentage of the overall number of responses on the seven levers for the 3 subjects exposed to each FT schedule.
The data are from the first and the last blocks of five sessions. The A coefficient was calculated as a measure of response variability and is shown at the upper-right corner of each panel. The dotted bar represents the operative lever.
The distribution of response location in each panel of Figure 3 was analyzed quantitatively by calculating the A coefficient (cf. Van der Eijk, 2001) that is used to quantify the degree of agreement or, conversely, the dispersion of the elements of a given sample across several discrete categories. In the present study the A coefficient was used as a measure of the spatial variability of responding. It allows quantification on a continuous scale from 1 (total stereotypy) to 0 (maximum variability, i.e., an equal number of responses on each lever) of the spatial distribution of presses on the seven levers. The A coefficient is shown in the upper right corner in each panel of Figure 3. A Spearman correlation between the A coefficient and FT schedule value showed no systematic relation between the two variables during the first five-session block, rs (21) = 0.008, p > .05. In contrast, during the last five-session block a reliable inverse relation between the A coefficient and FT schedule value was found, rs (21) = − 0.69, p < .05.
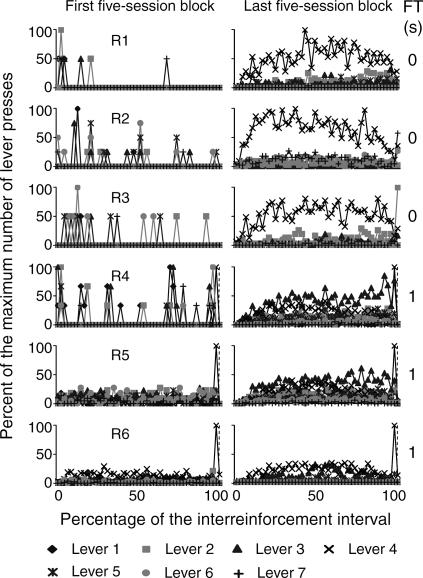
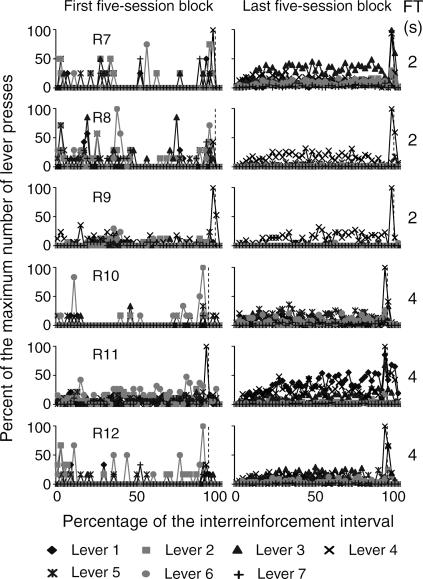
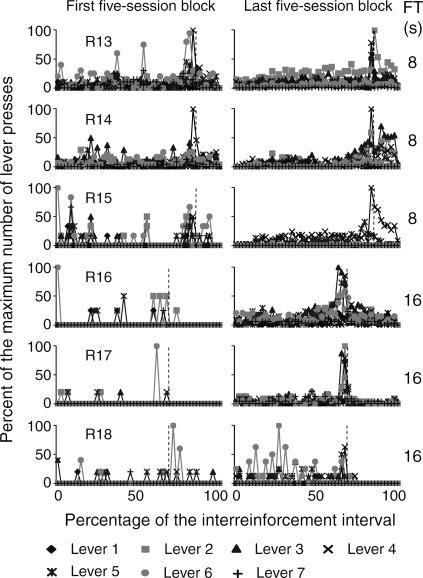
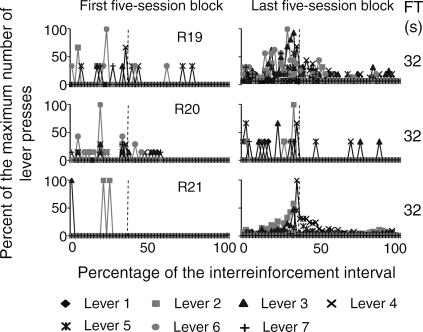
The temporal distribution of the mean number of responses on the seven levers within the obtained interreinforcement interval (IRI) during the first and the last block of five sessions is shown in Figures 4 through 7. In order to illustrate this effect, the abscissa in each panel shows the percentage of time elapsed during the IRI. To differentiate the temporal distribution of lever presses during the delay interval, the FT component is shown within the last subinterval(s) of the IRI. Each second of the FT-schedule duration is represented as a 1% subinterval of the IRI. The beginning of the FT component is marked with a dotted vertical line. Given that this analysis focused on the temporal distribution of responses rather than on the total number of responses per subject, the ordinates show the percentage of the maximum number of responses on each of the seven levers during each subinterval of the IRI.
Fig 4. Temporal distribution of presses on the seven levers as a percentage of the IRI for the two groups of subjects exposed to the FT 0-s and FT 1-s schedules during the first and the last five-session blocks.
The RI distribution was calculated from the preceding reinforcer to the onset of the FT interval. The FT distribution was calculated from the onset of the FT interval to the delivery of the reinforcer. The last response in the RI component was eliminated from the analysis. The beginning of the reinforcer delay (the FT period) is marked with a dashed vertical line. FT schedule values appear at the far right in each panel.
Fig 5. Temporal distribution of presses on the seven levers as a percentage of the IRI for the two groups of subjects exposed to the FT 2-s and FT 4-s schedules during the first and the last five-session blocks.
See the description of Figure 4.
Fig 6. Temporal distribution of presses on the seven levers as a percentage of the IRI for the two groups of subjects exposed to the FT 8-s and FT 16-s schedules during the first and the last five-session blocks.
See the description of Figure 4.
Fig 7. Temporal distribution of presses on the seven levers as a percentage of the IRI for the group of subjects exposed to the FT 32-s schedule during the first and the last five-session blocks.
See the description of Figure 4.
Because the beginning of the FT component was forced to occupy a particular subinterval of the IRI, the last response in each RI component was eliminated from the analysis to avoid an artificial increase in the height of these functions. Therefore, the maximum number of responses could occur during any subinterval of the RI and the FT components. For example, for Rat 1 (see the top panels in Figure 4) during the first block of sessions, few responses occurred immediately after reinforcer delivery and remained at near-zero levels until the subsequent reinforcer delivery. Given that the last response in each RI component was eliminated, different from Figure 3 (see the left top panel of Figure 3), responding was highest on lever 2. During the last block of sessions, responding on lever 4 increased after reinforcer delivery and decreased prior to the subsequent reinforcer delivery. Responding on levers 2, 3, and 5 increased after reinforcer delivery and remained approximately constant until the subsequent reinforcement delivery but was notably lower than responding on lever 4. Responding on levers 1, 6, and 7 remained at near-zero levels at all times. The rate of responding on each lever is congruent with the percentage of the rate of responding shown in Figure 3 (see the top panel in Figure 3 showing the last block of sessions for Rat 1).
During the first block of sessions, the temporal distribution did not vary systematically with the different FT values. During the last block of sessions, for the 3 subjects that were exposed to the FT 0-s schedule, responses usually increased immediately after reinforcer delivery and decreased prior to the subsequent reinforcer delivery (see the top three panels in Figure 4). However, responding on levers 4, 6, and 7 for Rat 2 and on lever 2 for Rat 3 increased during the last subinterval of the IRI.
For FT values from 1 to 4 s (see Figures 4 and 5), response rate on one or more levers increased after reinforcer delivery and then decreased prior to the onset of the FT component. During the FT component, responding was highest during the first second and decreased during the following seconds. For most rats, this decrease reached near-zero levels; for other rats responding remained at a substantial level prior to reinforcer delivery. For Rat 11 response rate increased after reinforcer delivery and remained approximately constant until the subsequent reinforcer delivery.
For all the subjects that were exposed to delays from 8 to 32 s (Figures 6 and 7), responding on the seven levers increased just prior to the onset of the FT component. For Rats 13 and 14, substantial levels of responding on inoperative levers occurred during the 8-s FT interval. For the subjects that were exposed to delays of 16 and 32 s, responding on all levers decreased during the first seconds of the FT component and, in most cases, remained low until the subsequent reinforcer delivery.
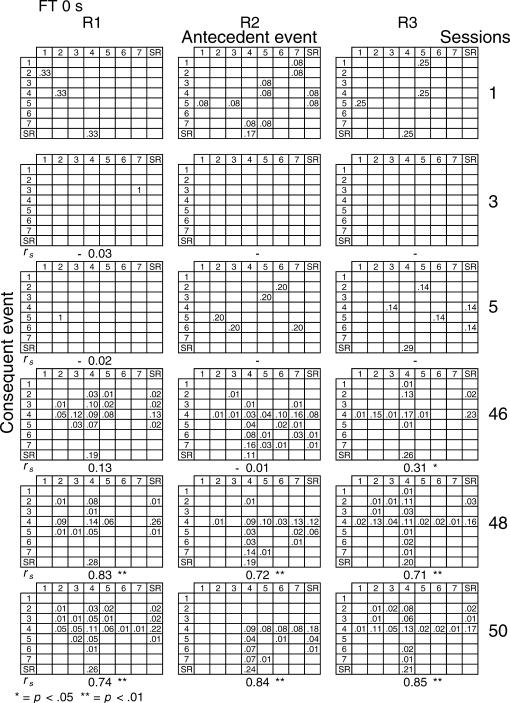
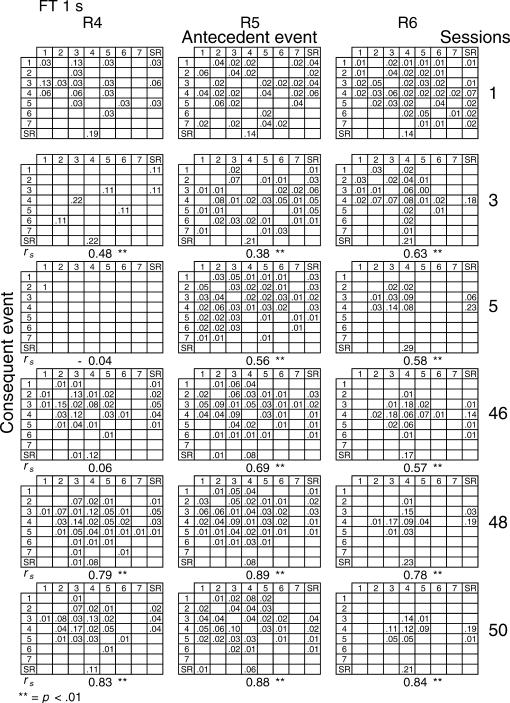
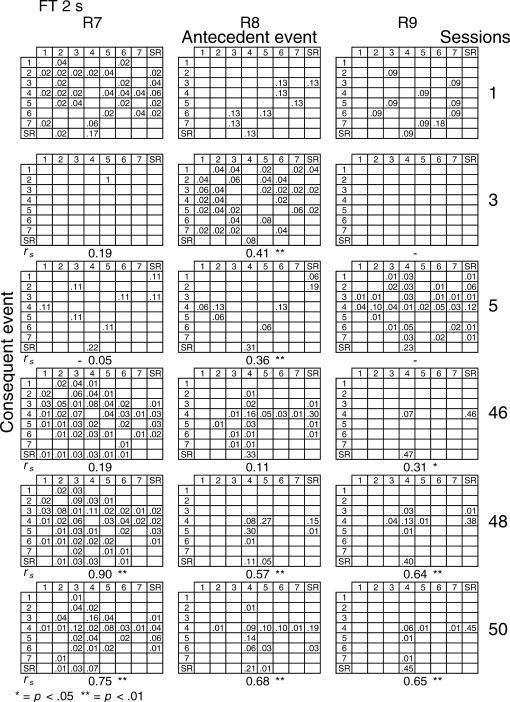
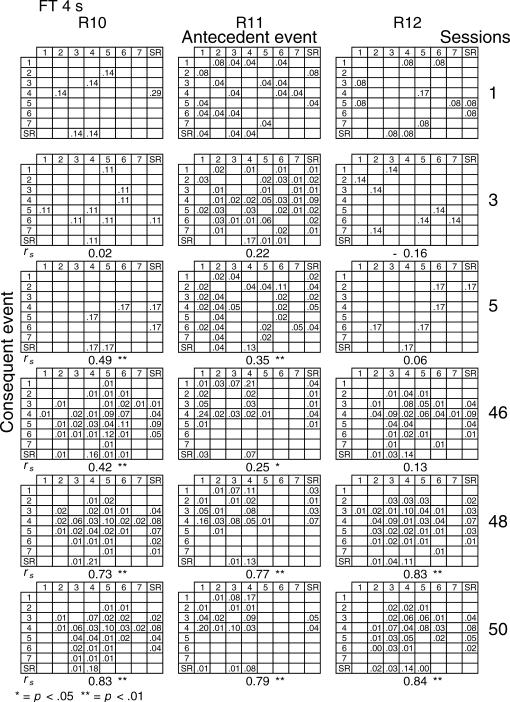
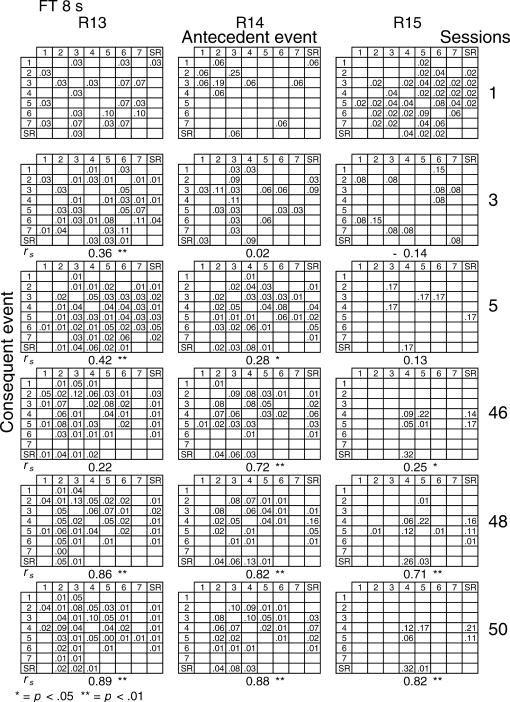
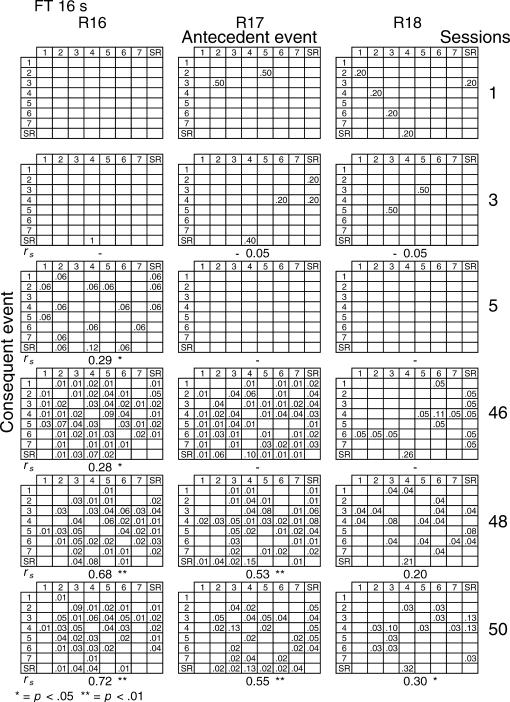
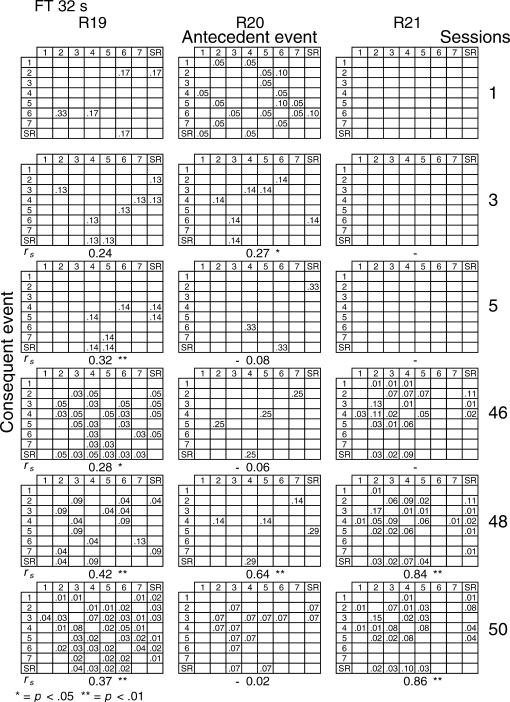
Given that spatial and temporal patterns of responding appeared in both the RI and FT components, a further analysis was performed. The probability of sequences of two events during both components [specifically, a pair of responses to different levers or a response–reinforcer (a response before or after a reinforcer)] was calculated for all subjects (see McIntire, Lundervold, Calmes, Jones, & Allard, 1983, for a similar analysis). To determine if the patterns were consistent within subjects these probabilities were calculated for the three nonconsecutive sessions of the first and the last five blocks of sessions (i.e., for sessions 1, 3, 5, 46, 48, and 50) for all subjects and for each different FT schedule. The probabilities are shown in Figures 8 through 14. The data for each subject in one session are shown in a data matrix in which the antecedent and the consequent events are located in the columns and rows, respectively. The intersection between the antecedent and the consequent event corresponds to the probability of occurrence of a particular sequence of two events relative to the total number of two-event sequences. The sessions appear sequentially in the columns.
Fig 8. Probability of sequences of two consecutive events for the 3 subjects exposed to the FT 0-s schedule during sessions 1, 3, 5, 46, 48, and 50.
Sequences could be either two responses to different levers, a response followed by a reinforcer, or a reinforcer followed by a response. Events numbered 1 to 7 correspond to presses on levers 1 to 7; SR represents the reinforcer.
Fig 9. Probability of sequences of two consecutive events for the 3 subjects exposed to the FT 1-s schedule during sessions 1, 3, 5, 46, 48, and 50.
See the description of Figure 8.
Fig 10. Probability of sequences of two consecutive events for the 3 subjects exposed to the FT 2-s schedule during sessions 1, 3, 5, 46, 48, and 50.
See the description of Figure 8.
Fig 11. Probability of sequences of two consecutive events for the 3 subjects exposed to the FT 4-s schedule during sessions 1, 3, 5, 46, 48, and 50.
See the description of Figure 8.
Fig 12. Probability of sequences of two consecutive events for the 3 subjects exposed to the FT 8-s schedule during sessions 1, 3, 5, 46, 48, and 50.
See the description of Figure 8.
Fig 13. Probability of sequences of two consecutive events for the 3 subjects exposed to the FT 16-s schedule during sessions 1, 3, 5, 46, 48, and 50.
See the description of Figure 8.
Fig 14. Probability of sequences of two consecutive events for the 3 subjects exposed to the FT 32-s schedule during sessions 1, 3, 5, 46, 48, and 50.
See the description of Figure 8.
In the FT 0-s schedule (Figure 8), no sequence was strongly dominant for the three rats during the first trio of sessions (1, 3, 5). During the last trio of sessions (46, 48, 50), the combinations of an operative lever press (lever 4) followed by a reinforcer (SR) or a reinforcer followed by a response on the operative lever were more likely to occur than any other combination of events (e.g., for Rat 1, probabilities of .28 and .26, respectively, in session 48). When the FT value was longer, during the earlier sessions the frequency of pairwise combinations increased for most rats across the FT values of 1 to 8, but was again infrequent for values of 16 and 32 s. During the later sessions, lengthening the FT value tended to increase the number of sequences that involved the inoperative levers for most rats relative to combinations that included the operative lever.
A Spearman correlation was used to compare the patterns of events during each session with the pattern found during the previous session for all subjects (i.e., sessions 1 with 3, 3 with 5, 5 with 46, 46 with 48, and 48 with 50). For most rats, the correlations between patterns in sessions 46, 48, and 50 were statistically significant (p < .01). The coefficients tended to decrease once the FT schedule exceeded 8 s. Considerable between-subjects variance was also found with the longer FT schedules. The correlations for sessions 5 and 46, as well as those for sessions 1 and 2, and 2 and 3, did not vary systematically with delay duration. The coefficients appear below each matrix.
To determine the correspondence between the programmed and obtained values of the IRI and the response–reinforcer interval, Table 3 shows the mean obtained delay between the last response and the delivery of the reinforcer for each lever, as well as the obtained reinforcement rate (reinforcers/min) for the 3 rats in each FT condition over the last five sessions. The obtained delay was calculated independently for each lever, and thus obtained delay represents the interval between the last response on every lever before reinforcer delivery.
Table 3.
Obtained delay of reinforcement per lever and overall rate of reinforcement for each rat and each FT schedule. The data are averages over the last five sessions.
| Rat | FT value | Obtained reinforcement delay (s) |
Reinforcement rate (reinf/min) | ||||||
| Levers | |||||||||
| 1 | 2 | 3 | 4 | 5 | 6 | 7 | |||
| 1 | 0 | – | 13.0 | 13.7 | 0.0 | 23.4 | 12.0 | 14.2 | 1.7 |
| 2 | 0 | 14.7 | 23.0 | 19.7 | 0.0 | 20.9 | 24.8 | 19.6 | 1.7 |
| 3 | 0 | 19.7 | 12.3 | 18.9 | 0.0 | 18.2 | 26.4 | 37.7 | 1.7 |
| 4 | 1 | 26.1 | 14.9 | 7.2 | 0.9 | 11.0 | 21.4 | 16.7 | 1.4 |
| 5 | 1 | 15.2 | 13.1 | 6.7 | 0.9 | 15.9 | 20.8 | 21.9 | 1.5 |
| 6 | 1 | 11.9 | 9.8 | 13.2 | 1.0 | 18.1 | 33.3 | 22.3 | 1.7 |
| 7 | 2 | 18.7 | 14.2 | 6.1 | 1.5 | 14.5 | 14.4 | 19.8 | 1.5 |
| 8 | 2 | – | 22.7 | 9.5 | 1.2 | 21.8 | 20.8 | 20.4 | 1.4 |
| 9 | 2 | 0.8 | 7.2 | 72.2 | 1.9 | 19.4 | 16.9 | 11.9 | 1.5 |
| 10 | 4 | 25.7 | 32.9 | 23.5 | 3.4 | 24.3 | 31.9 | 32.2 | 1.0 |
| 11 | 4 | 6.6 | 17.6 | 10.2 | 2.9 | 24.9 | 22.9 | 32.7 | 1.6 |
| 12 | 4 | 23.1 | 22.4 | 19.5 | 3.3 | 24.2 | 34.0 | 19.1 | 1.1 |
| 13 | 8 | 12.0 | 5.9 | 8.6 | 5.6 | 9.7 | 18.0 | 20.3 | 1.3 |
| 14 | 8 | 15.3 | 15.7 | 6.6 | 6.2 | 28.4 | 13.8 | 10.0 | 0.7 |
| 15 | 8 | – | 34.5 | – | 5.4 | 17.1 | 30.8 | – | 1.3 |
| 16 | 16 | 23.9 | 28.8 | 20.3 | 13.0 | 21.8 | 30.1 | 30.5 | 0.6 |
| 17 | 16 | 140.0 | 59.9 | 37.2 | 15.1 | 45.8 | 35.1 | 69.5 | 0.4 |
| 18 | 16 | 189.9 | 272.9 | 332.3 | 15.7 | 169.0 | 313.6 | 303.2 | 0.1 |
| 19 | 32 | 116.9 | 82.7 | 141.5 | 25.2 | 26.9 | 155.8 | 151.5 | 0.2 |
| 20 | 32 | 82.7 | 643.1 | 251.2 | 29.9 | 1225.7 | 1102.1 | 1291.2 | 0.0 |
| 21 | 32 | 33.0 | 29.9 | 45.4 | 25.3 | 45.1 | 34.1 | 32.2 | 0.4 |
Obtained delay to reinforcement on the operative lever increased as the FT schedule was lengthened, r (21) = .99, p < .01. Obtained delay on the inoperative levers was, in most cases, higher than the FT value. A one-way ANOVA showed that the effects of FT value on obtained reinforcement rate were significant, F (1, 6) = 19.42, p < .01. Multiple comparisons (Tukey) of the obtained reinforcement rate for the different FT values showed that obtained reinforcement rate did not vary systematically for FT values of 0 to 8 s (Ms = 1.68, 1.52, 1.47, 1.22, 1.07, respectively). Although the obtained reinforcement rate for FT values of 16 and 32 s were not significantly different from each other (Ms = 0.39 and 0.19, respectively), both were notably lower than those obtained with the smaller FT values.
Discussion
Response rate on the operative lever generally increased toward an asymptote across sessions (see Figure 2). The asymptote tended to be lower as the FT value increased, that is, there was a delay-of-reinforcement gradient. This finding is consistent with those reported in previous studies on response acquisition with delayed reinforcement (e.g., Bruner et al., 1998; Bruner, Ávila, & Gallardo, 1994). For example, Bruner et al. (1998) determined the effects of different delays on the acquisition of lever pressing by rats that were exposed to tandem schedules in which the first component could be either a FR 1 schedule or RI 15, 30, 60 or 120 s, and the second component was an FT schedule. They showed that lengthening the FT value from 0 to 24 s resulted in a gradual decrease in response rate in both components.
The ANOVA results from the present study showed that response rate on inoperative levers 2, 3, and 5 increased across sessions for the different FT schedules. The fact that both operative and inoperative lever pressing increased across sessions (see Figure 2) is consistent with the demonstration that the establishment of an arbitrary operant is accompanied by an increase of unreinforced variations of the reinforcer-producing response (e.g., Galbicka & Platt, 1989; Hefferline & Keenan, 1963; Herrick, 1964; Hull, 1943; Notterman & Mintz, 1965; Skinner, 1938). As previously described, Hefferline and Keenan demonstrated clearly the acquisition of an arbitrary operant and the occurrence of unreinfoced variations of the reinforced response. Without response shaping, they exposed human subjects to an FR 1 schedule that provided monetary reinforcers for small movements of the thumb. They found that as the single session progressed, the frequency of the reinforced responses increased. For 3 of 4 subjects, the induced responses that were closest to the reinforced response also increased.
The present study extends the previous findings using a procedure for response acquisition with delayed reinforcement. We conclude that induced variations of the reinforced response can be acquired even when the reinforcer is delayed. Furthermore, at least for Lever 3, the rate of unreinforced responses decreased as delay duration was lengthened in a manner similar to the delay-of-reinforcement gradient found with the operative lever.
Recording presses on seven adjacent levers allowed observation of the spatial distribution of responses as the sessions progressed and the FT value was varied. During the first block of five sessions, the number of responses on the operative lever was generally only slightly higher than the number of responses on the inoperative levers for all FT values (see the left panels of Figure 3). During the last block of five sessions, the difference became more pronounced, especially at shorter FT values. Generally, for all FT values the rate of inoperative lever pressing decreased as a function of the distance between the inoperative levers from the operative lever, that is, there was a response-induction gradient. Therefore, the duration of reinforcer delay controlled not only the operant response but also determined the induction of responding along a continuum of spatial location. When the FT schedule was 0 to 2 s, the spatial distribution of responding was narrower than with higher values of the FT schedule. In other words, reinforcer delay effected a wider distribution of responses along the spatially defined continuum of responses as FT schedule value increased.
Although this latter finding has no precedent in the literature on delayed reinforcement, it is consistent with the results of previous studies in which a response-induction gradient was reported using differential reinforcement (e.g., Hefferline & Keenan, 1963; Herrick, 1964; Hull, 1943; Kuch, 1974; Notterman & Mintz, 1965). In these studies the unreinforced responses formed a response-induction gradient along a continuum of lever displacement, force, amplitude, or duration of lever presses that was centered on the reinforced response.
Hefferline and Keenan's (1963) study provided not only evidence for the acquisition of an arbitrary operant and the occurrence of unreinforced, induced variations of the operant but also demonstrated the emergence of a response-induction gradient during continuous reinforcement. During the first minutes of the single session in which only small thumb movements within a specific range were reinforced, the distribution of responses along the amplitude continuum was skewed towards the larger amplitudes, and unreinforced responses were more frequent than reinforced responses. As the session progressed, the distribution of responses became centered on the reinforced response; thus the reinforced response occurred more frequently than the unreinforced responses.
Consistent with Catania (1973, 1998), the spatial distribution of lever presses across sessions in the present study might be explained in terms of the reinforcement of responses that satisfied the reinforcement contingency and the induction of responses closely related to the reinforced responses. During the first block of five sessions the number of responses on the inoperative levers did not differ substantially from the number of responses on the operative lever. As the sessions progressed, the spatial distribution of responses narrowed, especially with shorter FT values.
When Hefferline and Keenan (1963) exposed their subjects to extinction, response variation increased for 3 out of 4 subjects. These findings are related to others showing that variability of response location increases as reinforcement frequency decreases (see, e.g., Antonitis, 1951; Boren et al., 1978; Eckerman & Lanson, 1969). The present study extends these previous findings by showing that, in an experimental design in which different groups of subjects were exposed to different delay durations, the duration of the reinforcer delay determined the shape of the response-induction gradient during the last block of sessions. Specifically, lengthening the delay produced a wider distribution of responses across the inoperative levers.
As noted earlier, two previous studies (LeSage et al., 1996; Wilkenfield et al., 1992) reported the occurrence of unreinforced lever presses during the acquisition of lever pressing with nonresetting delayed reinforcement. The authors suggested that inoperative-lever presses increased due to an unspecific effect of reinforcer delivery (e.g., an increase in general activity). The results of the present study suggest a more comprehensive explanation for inoperative-lever pressing based on induced response variations. In two-lever procedures, pressing the inoperative lever can occur during the delay interval whether the delay is nonresetting or resetting. For example, Sutphin et al. (1998) reported that inoperative-lever pressing under resetting delay durations from 8 to 64 s accompanied the acquisition of responding to the operative lever. The authors suggested that inoperative-lever pressing was strengthened by the temporal contiguity of the response and the reinforcer but did not provide evidence to support their suggestion. The present study used a nonresetting delay procedure and found that presses on the seven levers decreased during the fixed delay (see Figures 4 through 7); for the most part they occurred early in the delay interval. Thus, although lengthening the FT value resulted in a wider distribution of responses on the inoperative levers, the temporal distribution of responding on those levers resembled the temporal distribution of the reinforced response on the operative lever. Therefore, delayed reinforcement controlled not only the spatial distribution of responding but also the temporal patterns of responding on the operative and inoperative levers.
In nonresetting delay procedures, the actual delays between responses on the operative lever and reinforcer delivery can be shorter than the programmed delay. In the present study, the obtained reinforcement delay on the operative lever varied systematically with programmed FT values and was close to the programmed delay for all FT values. Therefore, although resetting delays is the more common procedure for studying delay-of-reinforcement effects (because it matches programmed with obtained delay), in the present study responding during the delay interval was infrequent. However, in cases like that for Rat 15 (see Figure 6), although responses sometimes occurred in temporal proximity to reinforcer delivery, at other times they occurred early in the delay interval. Thus, response–reinforcer contiguity did not occur systematically. The fact that responding on the inoperative levers decreased during the delay interval, in combination with the observation that obtained delays were longer on the inoperative levers than on the operative lever, suggests that adventitious reinforcement does not account for responding on the inoperative levers.
Another possible explanation is an increase in general activity (see Wilkenfield et al., 1992). The activity of food-deprived rats may increase when food is delivered, thus resulting in an increase in the number of lever presses even in the absence of reinforcement. Were this the case, however, it seems reasonable to assume that similar rates of responding should have been found for all the levers (cf. Sutphin et al., 1998). The finding that responding on the seven levers often emerged in a distinctive pattern that took several sessions to establish makes an explanation in terms of enhanced general activity alone unlikely.
In addition to the spatial and temporal distribution of lever pressing, responses to both operative and inoperative levers were intertwined in repetitive patterns (see Figures 8 to 14) that remained stable across the last block of five sessions. Although the patterns were consistent within subjects, they differed between subjects. This result is congruent with the findings of A. Bruner and Revusky (1961), who studied temporal patterns of telegraph-key pressing in humans. They reinforced presses on one of six keys using a differential-reinforcement-of-low-rates schedule and recorded presses without programmed consequences on the adjacent keys. They showed that presses of the inoperative keys occurred in repetitive patterns with the responses to the operative key. As in the present study, these patterns were consistent within subjects but differed between subjects.
In addition, the present study found a tendency for the correlation between patterns of bi-event probabilities to decrease at the higher FT values. Tatham et al. (1993) reported a comparable finding when reinforcer frequency was varied. Tatham et al. used different ratio schedules of reinforcement and recorded left and right button presses in humans. Increases in the ratio values (i.e., decreases in reinforcer frequency) reduced the probability that a response sequence would be repeated. In other words, response variability increased. Varying the duration of reinforcer delay has a similar effect on the probability of response sequences. We conclude that, as reinforcer delay increases, responding becomes more variable not only in spatial location and temporal distribution but also in sequential structure.
An inherent problem in studies of delayed reinforcement has been the decrease in reinforcer rate as the delay interval increases. In studies of response acquisition with delayed reinforcement (e.g., LeSage et al., 1996; Sutphin et al., 1998; Wilkenfield et al., 1992) either tand FR 1 FT or tand FR 1 DRO schedules were used. Under these procedures both the programmed and the obtained reinforcement rates covaried with the delay interval. In the present study an attempt was made to keep the programmed reinforcement rate constant while the fixed delay was lengthened between groups. Therefore, the average RI duration was the complement of the FT duration such that their sum yielded a nominal 32-s IRI on average (cf. Sizemore & Lattal, 1978). We found that obtained reinforcement rate remained relatively constant with reinforcer delays ranging from 0 to 8 s; however, reinforcement rate was considerably lower with delays of 16 and 32 s. Given that previous studies of delayed reinforcement showed the familiar delay-of-reinforcement gradient even when the obtained reinforcer rate remained constant across the different programmed delay durations (e.g., Bruner, Pulido, & Escobar, 1999; Sizemore & Lattal, 1978), it is improbable that the results of the present study can be attributed to changes in obtained reinforcer rate. Another fact that rules out the explanation of the present data in terms of variations in reinforcer rate is that the delay interval was systematically related not only to response rate but also to the temporal distribution of presses on the seven levers within the interreinforcement interval.
Acknowledgments
This research was supported by a grant (35011-H) from the Mexican Council for Research and Technology (CONACYT) to the second author. The reported data were part of the undergraduate honor thesis of the first author. The authors thank Alicia Roca for her continuing contribution to the preparation of this paper.
References
- Antonitis J.J. Response variability in the white rat during conditioning, extinction, and reconditioning. Journal of Experimental Psychology. 1951;42:273–281. doi: 10.1037/h0060407. [DOI] [PubMed] [Google Scholar]
- Boren J.J, Moerschbaecher J.M, Whyte A.A. Variability of response location on fixed-ratio and fixed-interval schedules of reinforcement. Journal of the Experimental Analysis of Behavior. 1978;30:63–67. doi: 10.1901/jeab.1978.30-63. [DOI] [PMC free article] [PubMed] [Google Scholar]
- Bruner A, Revusky S.H. Collateral behavior in humans. Journal of the Experimental Analysis of Behavior. 1961;4:349–350. doi: 10.1901/jeab.1961.4-349. [DOI] [PMC free article] [PubMed] [Google Scholar]
- Bruner C.A, Ávila S.R, Acuña L, Gallardo L.M. Effects of reinforcement rate and delay on the acquisition of lever pressing by rats. Journal of the Experimental Analysis of Behavior. 1998;69:59–75. doi: 10.1901/jeab.1998.69-59. [DOI] [PMC free article] [PubMed] [Google Scholar]
- Bruner C.A, Ávila S.R, Gallardo L.M. Acquisition of lever pressing in rats under an intermittent schedule of delayed reinforcement. Mexican Journal of Behavior Analysis. 1994;20:119–129. [Google Scholar]
- Bruner C.A, Pulido M.A, Escobar R. Response acquisition and maintenance with a temporally defined schedule of delayed reinforcement. Mexican Journal of Behavior Analysis. 1999;25:379–391. [Google Scholar]
- Catania A.C. The nature of learning. In: Nevin J.A, editor. The study of behavior: Learning, motivation, emotion, and instinct. Glenview IL: Scott, Foresman and Co; 1973. pp. 30–68. [Google Scholar]
- Catania A.C. Learning (4th ed.) Englewood Cliffs, NJ: Prentice Hall; 1998. [Google Scholar]
- Di Lollo V, Ensminger W.D, Notterman J.M. Response force as a function of amount of reinforcement. Journal of Experimental Psychology. 1965;70:27–31. doi: 10.1037/h0022062. [DOI] [PubMed] [Google Scholar]
- Eckerman D.A, Lanson R.N. Variability of response location for pigeons responding under continuous reinforcement, intermittent reinforcement, and extinction. Journal of the Experimental Analysis of Behavior. 1969;12:73–80. doi: 10.1901/jeab.1969.12-73. [DOI] [PMC free article] [PubMed] [Google Scholar]
- Galbicka G, Platt J.R. Response-reinforcer contingency and spatially defined operants: Testing an invariance property of phi. Journal of the Experimental Analysis of Behavior. 1989;51:145–162. doi: 10.1901/jeab.1989.51-145. [DOI] [PMC free article] [PubMed] [Google Scholar]
- Hefferline R.F, Keenan B. Amplitude-induction gradient of a small-scale (covert) operant. Journal of the Experimental Analysis of Behavior. 1963;6:307–315. doi: 10.1901/jeab.1963.6-307. [DOI] [PMC free article] [PubMed] [Google Scholar]
- Herrick R.M. The successive differentiation of a lever displacement response. Journal of the Experimental Analysis of Behavior. 1964;7:211–215. doi: 10.1901/jeab.1964.7-211. [DOI] [PMC free article] [PubMed] [Google Scholar]
- Hull C.L. Principles of behavior. New York: Appleton-Century-Crofts; 1943. [Google Scholar]
- Keller F.S, Schoenfeld W.N. Principles of psychology. New York: Appleton-Century-Crofts; 1950. [Google Scholar]
- Kuch D.O. Differentiation of press durations with upper and lower limits on reinforced values. Journal of the Experimental Analysis of Behavior. 1974;22:275–283. doi: 10.1901/jeab.1974.22-275. [DOI] [PMC free article] [PubMed] [Google Scholar]
- Lattal K.A. Considerations in the experimental analysis of reinforcement delay. In: Commons M.L, Mazur J.E, Nevin J.A, Rachlin H, editors. Quantitative analyses of behavior: Vol. 5. The effect of delay and of intervening events on reinforcement value. Hillsdale, NJ: Erlbaum; 1987. pp. 107–123. [Google Scholar]
- LeSage M.G, Byrne T, Poling A. Effects of d amphetamine on response acquisition with immediate and delayed reinforcement. Journal of the Experimental Analysis of Behavior. 1996;66:349–367. doi: 10.1901/jeab.1996.66-349. [DOI] [PMC free article] [PubMed] [Google Scholar]
- Margulies S. Response duration in operant level, regular reinforcement, and extinction. Journal of the Experimental Analysis of Behavior. 1961;4:317–321. doi: 10.1901/jeab.1961.4-317. [DOI] [PMC free article] [PubMed] [Google Scholar]
- McIntire K, Lundervold D, Calmes H, Jones C, Allard S. Temporal control in a complex environment: An analysis of schedule-related behavior. Journal of the Experimental Analysis of Behavior. 1983;39:465–478. doi: 10.1901/jeab.1983.39-465. [DOI] [PMC free article] [PubMed] [Google Scholar]
- Millenson J.R, Hurwitz H.M.B, Nixon W.L.B. Influence of reinforcement schedules on response duration. Journal of the Experimental Analysis of Behavior. 1961;4:243–250. doi: 10.1901/jeab.1961.4-243. [DOI] [PMC free article] [PubMed] [Google Scholar]
- Millenson J.R, Leslie J.C. Principles of behavioral analysis (2nd ed.) New York: Mcmillan; 1979. [Google Scholar]
- Notterman J.M, Mintz D.E. Dynamics of response. New York: Wiley; 1965. [Google Scholar]
- Schneider S.M. The role of contiguity in free-operant unsignaled delay of positive reinforcement: A brief review. The Psychological Record. 1990;40:239–257. [Google Scholar]
- Segal E.F. Induction and the provenance of operants. In: Gilbert R.M, Millenson J.R, editors. Reinforcement: Behavioral analyses. New York: Academic Press; 1972. pp. 1–34. [Google Scholar]
- Sidman M. Tactics of scientific research: Evaluating experimental data in psychology. New York: Basic Books; 1960. [Google Scholar]
- Sizemore O.J, Lattal K.A. Unsignaled delay of reinforcement in variable-interval schedules. Journal of the Experimental Analysis of Behavior. 1978;30:169–175. doi: 10.1901/jeab.1978.30-169. [DOI] [PMC free article] [PubMed] [Google Scholar]
- Skinner B.F. The behavior of organisms: An experimental analysis. New York: Appleton-Century-Crofts; 1938. [Google Scholar]
- Skinner B.F. Science and human behavior. New York: Macmillan; 1953. [Google Scholar]
- Sutphin G, Byrne T, Poling A. Response acquisition with delayed reinforcement: A comparison of two-lever procedures. Journal of the Experimental Analysis of Behavior. 1998;69:17–28. doi: 10.1901/jeab.1998.69-17. [DOI] [PMC free article] [PubMed] [Google Scholar]
- Tarpy R.M, Sawabini F.L. Reinforcement delay: A selective review of the last decade. Psychological Bulletin. 1974;81:984–997. [Google Scholar]
- Tatham T.A, Wanchisen B.A, Hineline P.N. Effects of fixed and variable ratios on human behavioral variability. Journal of the Experimental Analysis of Behavior. 1993;59:349–359. doi: 10.1901/jeab.1993.59-349. [DOI] [PMC free article] [PubMed] [Google Scholar]
- Van der Eijk C. Measuring agreement in ordered rating scales. Quality and Quantity. 2001;35:325–341. [Google Scholar]
- Wilkenfield J, Nickel M, Blakely E, Poling A. Acquisition of lever-press responding in rats with delayed reinforcement: A comparison of three procedures. Journal of the Experimental Analysis of Behavior. 1992;58:431–443. doi: 10.1901/jeab.1992.58-431. [DOI] [PMC free article] [PubMed] [Google Scholar]


