Abstract
The genetic alterations and molecular events mediating human prostate cancer development and progression remain to be defined. Rapid expression cloning and differential RNA display detect a putative oncogene, prostate tumor-inducing gene 1 (PTI-1), that is differentially expressed in human prostate (as well as breast, colon, and small cell lung) cancer cell lines, patient-derived prostate carcinomas, and blood from patients with metastatic prostate cancer. PTI-1 consists of a unique 5′ untranslated region (5′ UTR) with significant sequence homology to Mycoplasma hyopneumoniae 23S ribosomal RNA juxtaposed to a sequence that encodes a truncated and mutated human elongation factor 1α (Trun-EF). Stable expression of a nearly full-length 1.9-kb PTI-1 gene, but not the separate PTI-1 5′ UTR or Trun-EF region, in normal rat embryo fibroblast cells, CREF-Trans 6, induces an aggressive tumorigenic phenotype in athymic nude mice. Blocking PTI-1 expression with antisense PTI-1 results in reversion of transformed PTI-1-expressing cells to a more normal cellular morphology with suppression in both anchorage-independent growth and tumorigenic potential in athymic nude mice. These findings document that PTI-1 is indeed an oncogene, and directly blocking PTI-1 expression can nullify cancer phenotypes. In these contexts, PTI-1 not only represents a gene with discriminating diagnostic properties but also may serve as a target for the gene-based therapy of human prostate and other cancers.
Keywords: DNA transfection, RNase protection, nuclear run-on, protein translational infidelity, cancer suppression
Prostate cancer is the most frequently diagnosed internal cancer of men in the United States and the second leading reason for cancer-related deaths of men (1–3). These statistics underscore the need for improved molecular staging of and therapeutic approaches for this prevalent neoplastic disease. Current procedures for detecting prostate cancer rely on physical examinations, monitoring serum prostate-specific antigen (PSA) levels, ultrasound, bone scans, and tissue biopsy (1–3). Recent studies indicate that reverse transcriptase–PCR approaches using PSA-specific primers and RNA isolated from blood may provide an early indicator of prostate cancer progression (4, 5). However, all of these strategies are limited in both their sensitivity and specificity. In addition, they do not provide the discriminatory power necessary to distinguish between cancers that will remain localized and pose no imminent health threat and aggressive cancers resulting in progressive disease culminating in metastasis and death.
A rapid expression cloning strategy coupled with differential RNA display, screening of a human LNCaP cDNA expression library, and the rapid amplification of cDNA ends (RACE) approaches identified a putative prostate carcinoma tumor-inducing oncogene, PTI-1 (6–8). Expression of PTI-1 occurs in human prostate, breast, colon, and lung carcinoma cell lines and patient-derived prostate carcinoma tissues, but not in normal prostate or benign hypertrophic prostate (BPH) tissues (7, 8). The full-length PTI-1 cDNA is 2,123 bp, consisting of a unique 630-bp 5′ untranslated region (UTR) with significant homology to Mycoplasma hyopneumoniae 23S ribosomal RNA fused to a sequence that is a truncated and mutated human elongation factor 1 α (EF-1α) (Trun-EF) (7). PCR with human genomic DNAs from normal human brain and kidneys, using PTI-1-specific 5′ UTR primers, provides evidence that this sequence is present in the human genome (8). Support for this conclusion comes from Southern blotting of genomic DNAs. Moreover, reverse transcriptase–PCR, using one primer specific for the 5′ UTR and the other for the EF-1α coding region, amplifies PTI-1 transcripts from total RNAs of prostate, breast, and colon carcinoma cell lines and blood samples from patients with metastatic prostate cancer (8). Taken together, these data suggest that the identification of PTI-1 was unlikely to be due to a contamination of samples with bacteria or cloning artifacts. Serial-dilution experiments indicate that PTI-1 can detect 1 prostate carcinoma cell in 108 cells not expressing PTI-1 (8). The exquisite sensitivity of PTI-1 in detecting carcinoma cells in the bloodstream of patients with metastatic prostate cancer suggests that this gene will prove extremely valuable as a sensitive and specific monitor of prostate cancer progression as reflected by the presence of cancer cells in a patient’s bloodstream.
The objective of the present study was to resolve if PTI-1 expression simply correlates with or actually controls neoplastic transformation in the CREF-Trans 6 cell line. To define the role of PTI-1 in eliciting transformation of CREF-Trans 6 cells, both ectopic sense (S) expression and antisense (AS) strategies were used. Expression constructs were produced that result in S or AS expression of specific components of the PTI-1 gene—i.e., the 5′ UTR, Trun-EF, and the 1.9-kb region of PTI-1 (including part of the 5′ UTR and the Trun-EF). Pooled PTI-1 S-expressing CREF-Trans 6 cells are tumorigenic in nude mice, whereas no tumors form when pooled 5′ UTR- or Trun-EF-expressing CREF-Trans 6 cells are injected subcutaneously into nude mice. Transient transfection assays demonstrate that only the complete PTI-1 AS construct can inhibit colony formation in PTI-1-expressing cells, including LNCaP DNA-transfected nude mouse tumor-derived CREF-Trans 6:4 NMT and human DU-145 cells. Stable PTI-1 AS expression in CREF-Trans 6:4 NMT cells results in a reversion in morphology to that of untransformed CREF-Trans 6 cells, an elimination of PTI-1 sense RNA, a reduction in anchorage independence, and a suppression in oncogenic potential in athymic nude mice. These results provide definitive evidence that PTI-1 is an oncogene and its expression is directly involved in controlling growth and maintaining the transformed phenotype. On the basis of the restricted expression of PTI-1 to carcinoma cells and the ability of AS molecules to directly inhibit expression of PTI-1 and the neoplastic phenotype, intervention in PTI-1 expression may represent an effective approach for the therapy of human prostate and other PTI-1-expressing cancers.
MATERIALS AND METHODS
Cell Lines, Culture Conditions, and Anchorage-Independence Assays.
The CREF-Trans 6 cell line and nude mouse tumor-derived CREF-Trans 6 cells transfected with LNCaP DNA, CREF-Trans 6:4 NMT, have been described previously (6). Human cell lines used in this study include the following: prostate carcinoma (DU-145 and LNCaP), breast carcinoma (MCF-7 and T47D), and colon carcinoma (SW480 and WiDr) (7, 8). Rodent cells were grown in Dulbecco’s modified Eagle’s medium (DMEM) supplemented with 5% fetal bovine serum (DMEM-5) at 37°C in a 95% air/5% CO2 humidified incubator. Human cells were grown in DMEM supplemented with 10% fetal bovine serum (DMEM-10). Early passage (<5) normal human prostate epithelial (NHPE) cells were obtained from Clonetics (San Diego, CA) and grown in serum-free medium supplied by the supplier. All cell lines used in the present study were tested for Mycoplasma contamination by using the Gen-Probe Mycoplasma test kit (Gaithersburg, MD) and were found to be Mycoplasma free.
Expression Vector Constructs and DNA Transfection Assays.
A 1.9-kb PTI-1 cDNA, containing an ≈500-bp region from the 5′ UTR, the Trun-EF coding region, and the 3′ UTR, was cloned in S and AS orientation into a pZeoSV vector as previously described (9, 10). Additionally, a 500-bp region of the 5′ UTR of PTI-1 and the Trun-EF of PTI-1 were also cloned in a S and AS orientation into a pZeoSV vector. To study the effects of these constructs on monolayer colony formation the vector (pZeoSV) containing no insert, PTI-1 S, PTI-1 AS, 5′ UTR S, 5′ UTR AS, Trun-EF S, or Trun-EF AS expression constructs was transfected into the various cell types by the Lipofectin method (GIBCO/BRL), and zeocin-resistant colony formation or tumorigenic potential in nude mice was determined (10–12).
Anchorage-Independence and Tumorigenicity Assays.
Anchorage-independence assays were performed by seeding various cell densities in 0.4% Noble agar on a 0.8% agar base layer, both of which contained growth medium (13). Colonies ≥0.1 mm in diameter were identified with a calibrated grid under an Olympus inverted phase-contrast microscope after 21 days. Tumorigenesis assays were performed as described by injecting 1 × 10⁶ cells subcutaneously into athymic BALB/c nude mice and monitoring animals for tumor development twice per week (11–13).
RNA Preparation and Northern Blotting, Nuclear Run-on, and RNase Protection Assays.
Total cellular RNA was isolated by the guanidinium/phenol extraction method and Northern blotting was performed as described (9, 10). Fifteen micrograms of RNA was denatured with glyoxal/dimethyl sulfoxide and electrophoresed in 1% agarose gels, transferred to nylon membranes, and hybridized sequentially with 32P-labeled PTI-1 5′ UTR (500-bp region), Zeocin-resistance, and glyceraldehyde-3-phosphate dehydrogenase (GAPDH) cDNA probes (9, 10). After hybridization, the filters were washed and exposed for autoradiography. The transcription rates of PTI-1 5′ UTR, Trun-EF, pBR322, and GAPDH in CREF-Trans 6, CREF-Trans 6:4 NMT, 4NMT-Vector cl 1, 4NMT-PTI-1-AS cl 1, 4NMT-PTI-1-AS cl 8, and 4NMT-PTI-1-AS cl 10 was determined by nuclear run-on assays as described (12). Changes in RNA transcription were quantitated by densitometric analysis using a Molecular Dynamics densitometer. RNase protection assays were performed using the Ribonuclease Protection Assay Kit from Ambion (Austin, TX). Briefly, antisense and sense RNA probes were made by in vitro transcription and labeled with [32P]UTP, hybridized with total cellular RNA, and digested with a mixture of RNase A and RNase T1. After electrophoresis in 6% polyacrylamide gels and autoradiography the protected RNA fragments appeared as distinct bands of predicted molecular size (14, 15).
RESULTS AND DISCUSSION
PTI-1 Is a Dominant-Acting Oncogene.
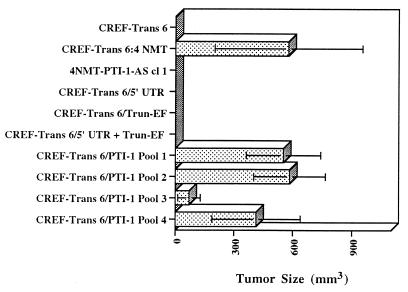
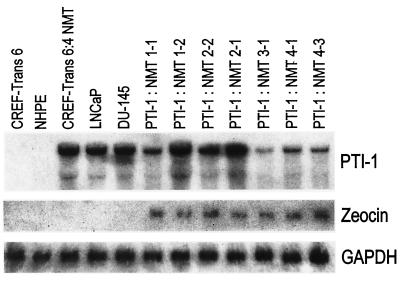
To determine if PTI-1 has oncogenic properties, a 1.9-kb PTI-1 clone, missing ≈215 bp from the 5′ UTR of the original predicted PTI-1 cDNA, isolated from a human prostate LNCaP cDNA library, was cloned into a pZeoSV vector and transfected into CREF-Trans 6 cells. Transfectants were selected for zeocin resistance, and pooled colonies from four separate plates were each injected into 4 athymic nude mice, total 16 nude mice. Within 10 days of injection, tumors were apparent in all animals (Fig. 1). As anticipated, nude mice injected with CREF-Trans 6:4 NMT cells, resulting from transfection with high molecular weight DNA from LNCaP cells and expressing PTI-1, also induced rapidly growing tumors (Fig. 1). Seven independent tumors derived from animals injected with pooled PTI-1-transfected CREF-Trans 6 cells were excised and established in cell culture. All of these tumor-derived cell lines exhibited a transformed morphology and expressed PTI-1 and the Zeocin-resistance gene (Fig. 2 and data not shown). No tumors developed when animals were injected with CREF-Trans 6 cells or CREF-Trans 6 cells transfected with an empty pZeoSV expression vector or pZeoSV expression vectors containing a 500-bp region of the 5′ UTR of PTI-1, the Trun-EF of PTI-1, or a combination of the separated 500-bp 5′ UTR and the Trun-EF regions of PTI-1 (Fig. 1). These results document that PTI-1 is a dominant-acting oncogene and the intact gene is required to elicit a biological effect.
Figure 1.
Induction of tumors in nude mice by PTI-1. Pooled zeocin-resistant CREF-Trans 6 cells transfected with a pZeoSV vector or a 1.9-kb PTI-1 S cDNA, a 5′ UTR PTI-1 S DNA, or a Trun-EF PTI-1 S DNA cloned into a pZeoSV vector were injected at 1 × 10⁶ cells per nude mouse (n = 4). Animals were also injected with untransfected CREF-Trans 6 cells, CREF-Trans 6:4 NMT cells (NMT; tumor-derived CREF-Trans 6 cells transfected with LNCaP high molecular weight DNA), and pooled CREF-Trans 6 cells transfected with the combination of a separate 5′ UTR PTI-1 S and a Trun-EF S DNA cloned into pZeoSV vectors. Tumors developed in the majority of 1.9-kb PTI-1 S cDNA and 4NMT injected animals by 7 days, and in all 1.9-kb PTI-1 S cDNA and 4NMT-injected animals by 10 days.
Figure 2.
Expression of PTI-1 in nude mouse tumor-derived CREF-Trans 6 cells. Tumors were isolated from animals and established in culture in the presence of zeocin, and total RNA was isolated and analyzed by Northern blotting. Northern blots were sequentially hybridized with a PTI-1, a zeocin-resistance, and then a GAPDH cDNA probe. NHPE, normal human prostate epithelial cells; PTI-1: NMT 1-1, 1-2, 2-2, 2-1, 3-1, 4-1, and 4-3 represent independent tumors isolated from different animals.
Expression of an Intact AS PTI-1 Gene Inhibits Monolayer Colony Formation in PTI-1-Expressing Cells.
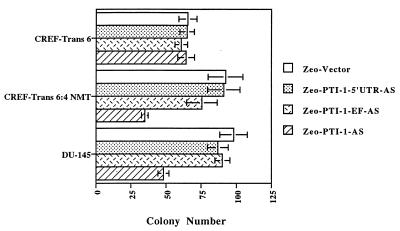
To scrutinize the role of PTI-1 in maintenance of transformation and the tumorigenic phenotype, an AS approach was used to selectively suppress expression of this gene. Transfection of PTI-1 AS (cloned in a pZeoSV vector permitting selection in Zeocin) into PTI-1-expressing cells, including CREF-Trans 6:4 NMT and DU-145, results in a >50% suppression in monolayer colony formation (average of three independent experiments; Fig. 3). Transfection of PTI-1 AS into T47D human breast carcinoma and SW480 human colon carcinoma cells that express PTI-1 also inhibits colony formation by >50% (data not shown). In contrast, only ≤10% inhibition in colony formation occurs after PTI-1 AS transfection of CREF-Trans 6 cells, which do not express PTI-1. Similarly, PTI-1 AS inhibits colony formation by only ≈20% in WiDr human colon carcinoma cells, which do not contain PTI-1 mRNA (data not shown).
Figure 3.
Inhibition of colony formation in PTI-1-expressing cells by antisense PT1–1. The indicated cell line was transfected with a pZeoSV plasmid containing or lacking an AS 0 to 500 PTI-1 5′ UTR, an AS Trun-EF region of PTI-1, or an AS PTI-1 1.9-kb sequence. Transfected cells were selected in zeocin and colony formation was determined. Results are the mean ± SD from four test plates per experimental condition. Similar results were obtained ±10% in two additional experiments.
The PTI-1 cDNA consists of a unique 5′ UTR with sequence homology to 23S rRNA from Mycoplasma hyopneumoniae adjacent to a Trun-EF (7, 8). It was considered essential to determine if the effects on colony formation observed with the 1.9-kb AS PTI-1 gene were specific for this molecule or if a phenotypic response could also be induced with the AS 5′ UTR or AS Trun-EF regions of PTI-1. This was of particular relevance because the Trun-EF might alter the expression or functionality of endogenous EF-1α, thereby causing a nonspecific negative effect on protein synthesis and cell growth in cells not expressing PTI-1 (16–21). To approach this question, a 500-bp region of the 5′ UTR and the Trun-EF of PTI-1 were subcloned in an AS orientation into the pZeoSV vector and transfected into CREF-Trans 6, CREF-Trans 6:4 NMT, and DU-145 cells. In the case of CREF-Trans 6:4 NMT and DU-145, a maximum ≈20% reduction in colony formation, three separate experiments, occurred after transfection with the AS 5′ UTR or AS Trun-EF region of PTI-1 (Fig. 3). In CREF-Trans 6, transfection with AS 5′UTR or AS Trun-EF of PTI-1 inhibited colony formation by only ≤10% (three independent experiments) (Fig. 3). These findings illustrate that AS expression of an intact PTI-1 gene, but not an AS 5′ UTR or AS Trun-EF, can specifically suppress growth in transformed cells expressing this gene. This result suggests that inactivation of the specific fusion gene product, containing the 5′ UTR and Trun-EF transcript, is mandatory for evoking the biological response described above.
It is noteworthy that only AS expression of an intact PTI-1 gene, not an AS 5′ UTR or Trun-EF construct, can revert the transformed phenotype and suppress colony formation in transformed rodent and human cancer cells expressing PTI-1. As previously discussed, the PTI-1 5′ UTR shares significant homology with prokaryotic rRNA, and its coding region is 97% homologous to human EF-1α. A possible explanation for the lack of activity of the incomplete PTI-1 AS gene constructs may involve competitive interactions of the AS 5′ UTR or AS Trun-EF PTI-1 molecules with endogenous ribosomal and EF-1α RNA messages, respectively. This competitive interaction with endogenous transcripts would predictably reduce the concentration of AS molecules to subthreshold levels that are unable to modify PTI-1 activity and alter cellular phenotypes. Alternatively, the differential effect of the intact PTI-1 AS versus the 5′ UTR AS and Trun-EF AS regions of PTI-1 may reflect the complex interactions between AS and their cellular target molecules that are necessary for inhibiting gene expression and eliciting a biological response. For example, there may be conformational requirements for the AS molecules that are mandatory for appropriate interaction with their cognate S counterparts. There are precedents indicating that not all AS oligonucleotides, even with comparable structures, exhibit predicted effects on expression of their target gene. Experiments are in progress to define small regions of the PTI-1 gene, such as the bridge region consisting of 5′ UTR and Trun-EF nucleotides, that may provide useful targets for AS applications. Further research addressing these issues will be crucial for designing appropriate AS PTI-1 molecules for cancer therapy.
AS Inhibition of PTI-1 Expression Suppresses Transformation in Vitro.
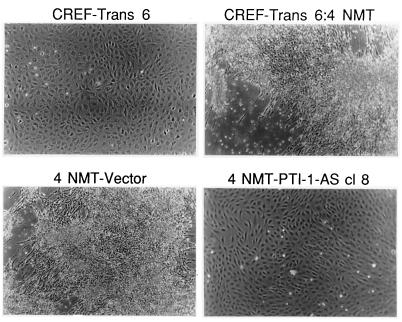
PTI-1-expressing CREF-Trans 6:4 NMT cells display a transformed morphology that easily distinguishes them from untransformed CREF-Trans 6 cells (Fig. 4). Transfection of these cells with an intact AS PTI-1 results in the formation of colonies morphologically resembling untransformed CREF-Trans 6 (Fig. 4). This morphology change is not apparent in CREF-Trans 6:4 NMT cells transfected with the pZeoSV vector (Fig. 4). Similarly, the morphology of CREF-Trans 6:4 NMT cells is unaltered after transfection with an AS 500-bp PTI-1 5′ UTR, an AS PTI-1 Trun-EF, or a combination of the separate AS 500-bp PTI-1 5′ UTR and an AS PTI-1 Trun-EF (data not shown).
Figure 4.
Effect of stable AS expression of PTI-1 on morphology of PTI-1-expressing CREF-Trans 6:4 NMT cells. Phase-contrast photograph of CREF-Trans 6, CREF-Trans 6:4 NMT, 4 NMT-Vector (CREF-Trans 6:4 NMT cells transfected with the pZeoSV vector), and 4 NMT-PTI-1-AS cl 8 (CREF-Trans 6:4 NMT cells transfected with an AS PTI-1 gene cloned in a pZeoSV vector). (≈×60.)
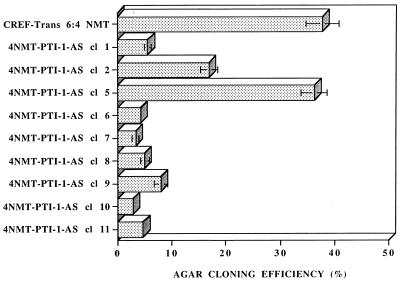
Studies were performed to determine if the morphological reversion of AS PTI-1-expressing CREF-Trans 6:4 NMT cells correlates with specific changes in cellular phenotype. Eleven morphologically reverted Zeocin-resistant colonies of CREF-Trans 6:4 NMT cells transfected with AS PTI-1 were isolated and maintained as independent clonal cell lines. The majority of clones, 7 of 11, retained their CREF-Trans 6-like morphology even after repeated subculture (>20 passages). When tested for anchorage-independent growth, CREF-Trans 6:4 NMT and six independent CREF-Trans 6:4 NMT pZeoSV vector-transformed clones grew in agar with an ≈40% efficiency (Fig. 5 and data not shown). In contrast, the majority of AS PTI-1-transfected CREF-Trans 6 clones exhibited a reduction in agar growth to ≤10% (Fig. 5). Repeated passage in monolayer culture of two originally CREF-Trans 6-like PTI-1 transfected CREF-Trans 6:4 NMT clones, 4NMT-PTI-1-AS cl 2 and cl 5, resulted in reappearance of cells with transformed morphology, and these cells grew in agar with an intermediate efficiency or an efficiency similar to that of CREF-Trans 6:4 NMT and CREF-Trans 6:4 NMT pZeoSV vector-transformed clones (Fig. 5). RNase protection assays document that 4NMT-PTI-1-AS cl 2 and cl 5 cells do not contain PTI-1 AS mRNA (data not shown). These results confirm that stable expression of AS PTI-1 can induce a reversion in the transformed properties of CREF-Trans 6:4 NMT cells as established by altered morphology and suppression of anchorage independence.
Figure 5.
Effect of stable AS expression of PTI-1 on growth in agar of CREF-Trans 6:4 NMT cells. A series of independent morphologically reverted CREF-Trans 6:4 NMT clones transfected with a PTI-1 AS gene were analyzed for anchorage-independent growth. With passage in culture, clones 4 NMT-PTI-AS cl 2 and cl 5 reverted to an altered phenotype similar to CREF-Trans 6:4 NMT cells.
Stable Expression of AS PTI-1 Inhibits Oncogenesis.
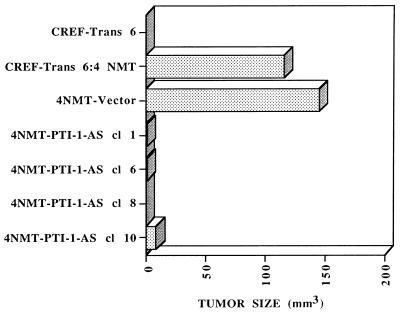
On the basis of the in vitro suppression of transformation by AS PTI-1, studies were performed to determine if stable AS PTI-1 expression in CREF-Trans 6:4 NMT modifies oncogenic potential. CREF-Trans 6:4 NMT cells form rapidly growing tumors when injected subcutaneously into athymic nude mice (Fig. 6). Transfection with the pZeoSV vector does not alter the tumorigenic potential of CREF-Trans 6:4 NMT cells. In contrast, AS PTI-1-transformed CREF-Trans 6:4 NMT cl 1, cl 6, cl 8, and cl 10 display a dramatic inhibition in tumor formation. In all cases, the majority of animals inoculated with the AS construct remained tumor-free during the course of the study, a minimum of 60 days. These results illustrate that AS PTI-1 also suppresses the oncogenic phenotype in vivo. In this context, gene targeting strategies using AS PTI-1 may prove amenable for the therapy of prostate and other cancers.
Figure 6.
Stable AS expression of PTI-1 inhibits the tumorigenic potential of CREF-Trans 6:4 NMT cells. Athymic nude mice were injected with 1 × 10⁶ CREF-Trans 6, CREF-Trans 6:4 NMT, 4 NMT-Vector, and clones of 4 NMT PTI-1 AS cells. Results are the average tumor size of four animals per experimental condition 3 weeks after injection. The majority of animals injected with 4 NMT PTI-1 AS clones remained tumor free for the duration of the assay, a minimum of 60 days. Similar results were obtained in two additional studies.
Mechanism by Which Antisense PTI-1 Reverses Cancer Phenotypes.
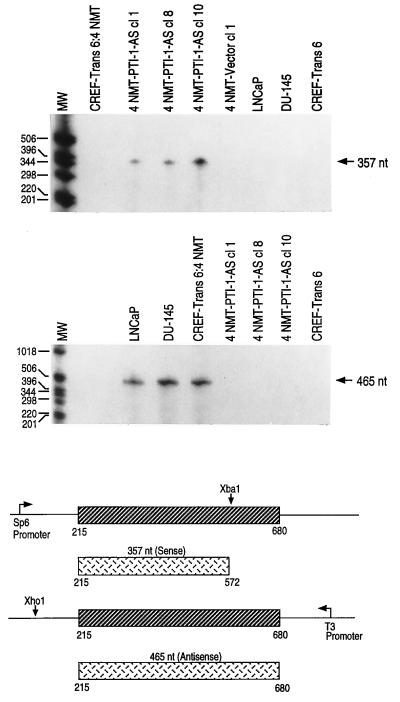
The ability of AS PTI-1 to alter the phenotype of CREF-Trans 6:4 NMT cells could result from a specific effect of the AS on PTI-1 expression or it could involve a trivial nonspecific effect occurring independent of alterations in PTI-1 RNA. To confirm that AS PTI-1 is expressed and is altering PTI-1 RNA levels in morphologically reverted CREF-Trans 6:4 NMT cells, RNase protection assays were conducted (Fig. 7). A PTI-1 S transcript of 357 nt and a PTI-1 AS transcript of 465 nt were synthesized and the ability of these probes to protect in vivo produced RNA species was determined (14, 15). In the case of the 357-nt PTI-1 sense transcript, protection is observed only in the AS PTI-1-expressing CREF-Trans 6:4 NMT clones—i.e., 4NMT-PTI-1-AS cl 1, cl 8, and cl 10 (Fig. 7). As anticipated, the 357-nt protected fragment was not apparent in CREF-Trans 6:4 NMT, 4NMT-Vector cl 1, LNCaP, DU-145, or CREF-Trans 6 cells lacking the AS PTI-1 transcripts. When the RNase protection assay was performed with a 465-nt AS transcript, protection is observed in LNCaP, DU-145, and CREF-Trans 6:4 NMT cells that contain PTI-1 sense transcripts. Absence of PTI-1 RNA results in no protection of the 465-nt AS probe. As predicted, the 465-nt AS-protected band is not present in the three PTI-1 AS-expressing CREF-Trans 6:4 NMT clones or in control CREF-Trans 6 cells. These results establish that expression of AS PTI-1 in morphologically reverted CREF-Trans 6:4 NMT cells correlates with absence of the PTI-1 message.
Figure 7.
Expression of AS PTI-1 and the absence of S PTI-1 in morphologically reverted PTI-1 AS CREF-Trans 6:4 NMT clones. RNase protection assays using a 357-nt S PTI-1 probe demonstrate the presence of PTI-1 AS transcripts in phenotypically reverted 4 NMT-PTI-1-AS-expressing CREF-Trans 6:4 NMT clones. RNase protection assays using a 465-nt AS PTI-1 probe demonstrate the absence of PTI-1 S transcripts in phenotypically reverted 4 NMT-PTI-1-AS-expressing CREF-Trans 6:4 NMT clones.
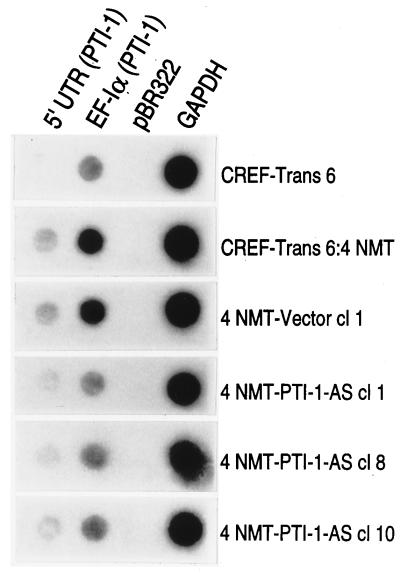
AS inhibition of gene expression can work at multiple levels, including altering transcription of a target gene, facilitating the degradation of targeted double-stranded mRNA, and/or inhibiting binding of the mRNA to the ribosome, preventing translation into protein (22–24). As demonstrated by using RNase protection assays, AS PTI-1 prevents the appearance of PTI-1 mRNA in reverted clones. To determine if the stable expression of AS PTI-1 can also modify transcription of the PTI-1 gene, nuclear run-on assays were performed (Fig. 8). The relative rate of RNA transcription from the 5′ UTR of PTI-1 is inhibited ≈2- to 3-fold in AS PTI-1-expressing CREF-Trans 6:4 NMT cl 1, cl 8, and cl 10 in comparison with vector-transformed and parental CREF-Trans 6:4 NMT cells. No transcription of the 5′ UTR is detected in CREF-Trans 6 cells. A similar ≈2- to 3-fold reduction in transcription is also apparent in the AS PTI-1-expressing clones when hybridized with the Trun-EF gene sequence (Fig. 8). Because of high sequence homology between the Trun-EF of PTI-1 and endogenous rat EF-1α (≈91–94% homologous with different rat species) cross-hybridization can be anticipated. Therefore, the apparent decrease in transcription of the Trun-EF region of PTI-1 does not definitively prove that transcription of this gene is suppressed in these cells. These results confirm that only small changes in the transcription of PTI-1 occur in the AS PTI-1-expressing cells, suggesting that the predominant effect of AS PTI-1 is on steady-state mRNA levels. These changes could include alterations in transcriptional initiation, transcriptional attenuation, and/or message stability.
Figure 8.
Transcription of the 5′ UTR of PTI-1, EF-1α, and GAPDH in CREF-Trans 6:4 NMT, 4NMT-Vector, and 4NMT-PTI-1-AS cells. Nuclear run-on assays were performed using the indicated cell types. DNA probes immobilized on filters include 5′ UTR (0–500 bp region of PTI-1), Trun-EF (EF-1α isolated from PTI-1), pBR322, and GAPDH. Similar results were obtained in two additional assays.
Proposed Model of Action of PTI-1 as an Oncogene.
Cancer is a progressive disease characterized by the appearance of new traits or the further elaboration of existing transformation-related properties in the evolving tumor cells (25–27). Recent data provide compelling evidence for a potential link between alterations in the translational machinery of cells, including both eukaryotic initiation and elongation factors, and oncogenesis (28, 29). Overexpression of the eukaryotic protein synthesis initiation factor eIF-4E can profoundly affect cellular physiology; effects include cooperating with viral oncogenes (such as v-myc and adenovirus E1A) to transform primary rodent cells (30), eliciting a tumorigenic phenotype in established rodent cells (31), and cooperating with MAX to produce a tumorigenic and metastatic phenotype in Chinese hamster ovary (CHO) cells (32). Elevated expression of EF-1α, which normally functions to ensure proper codon–anticodon binding interactions at the A site of the ribosome (28, 29), also modifies cellular properties, rendering both mouse and Syrian hamster cells susceptible to carcinogen- and ultraviolet light-induced transformation (33). Enhanced levels of EF-1α are also found in tumors of the pancreas, colon, breast, lung, and stomach relative to adjacent normal tissue (34). Moreover, the data in the present paper provide direct experimental support for an association between the expression of a truncated and mutated EF-1α, encoded by PTI-1, and expression of cancer phenotypes.
On the basis of studies in bacteria (elongation factor Tu) and yeast (EF-1α), a model of action of EF-Tu/EF-1α has been proposed (16–21, 35). These molecules are perceived to mediate the process of kinetic protein proofreading that controls appropriate codon–anticodon binding interactions (16). Specific mutations in EF-Tu elicit dominant-negative inhibition of protein synthesis and increase missense error rates in bacteria (16–19). Similarly, mutations (specific amino acid and altered expression) in EF-1α in yeast directly affect frequencies of frameshifting and amino acid misincorporation, proofreading of codon–anticodon interactions, and suppression of nonsense mutations (20, 21). These findings support a potential hypothesis for the action of PTI-1 that involves a process we have termed “translational infidelity” (7). In this model, PTI-1 modifies EF-1α activity to introduce distinct amino acid mistakes generating mutant transforming proteins and/or preventing cancer cells from correcting specific protein mutations that promote cancer progression (7). Studies are now being conducted using Saccharomyces cerevisiae and genetically engineered mammalian cells as experimental model systems to resolve the role of PTI-1 in regulating protein translation and cellular phenotype.
The mechanism by which PTI-1 functions as an oncogene requires clarification. However, this observation provides additional support for an association between protein translational control and the neoplastic process (7, 28–34). As discussed above, on the basis of structure, PTI-1 may mediate carcinoma formation from epithelial precursor cells by modifying normal EF-1α function in a dominant-negative manner, thereby resulting in decreased protein translational fidelity and an inability to repress specific mutations in cancer cells (28, 29). If the “translational infidelity” hypothesis is proven accurate, PTI-1 may represent a novel class of genes that can directly effect “genomic stability” and function as an important contributor to the mutator phenotype of cancer cells and tumor progression by altering the accuracy of protein translation. At present this possibility is only hypothetical. The PTI-1 oncogene may have developed as a consequence of specific mutations in EF-1α, including a fusion with 5′ UTR sequences with homology to bacterial 23S rRNA (7, 8). Because the unique 5′ UTR of PTI-1 is found in the genomes of both normal and cancer cells, it will be important to isolate these genes and compare their genomic structures. An evaluation and analysis of these genetic elements should provide important insights into the potential origin and role of PTI-1 in cancer.
Conclusion.
The PTI-1 gene represents a significant advance in monitoring prostate carcinoma progression as indicated by the occurrence of prostate carcinoma cells in a patients’ circulatory system (8). We presently provide compelling evidence that the PTI-1 gene is a dominant-acting oncogene and it can serve as a direct target for intervening in the cancer phenotype. On the basis of structure—i.e., encoding a truncated and mutated human EF-1α—the PTI-1 gene is a member of a previously unknown class of oncogenes. These data provide support for the hypothesis that PTI-1 is a functionally relevant genetic component of prostate (and possibly breast, colon, and lung) cancer development and progression and targeting this gene for inactivation may be a novel strategy for intervening in the cancer process.
Acknowledgments
We thank Dr. Yilong Sun for valuable discussions. This research was supported by National Institutes of Health Grant CA35675, the Chernow Endowment, and the Samuel Waxman Cancer Foundation. P.B.F. is a Chernow Research Scientist in the Departments of Pathology and Urology.
ABBREVIATIONS
- PTI-1
prostate tumor-inducing gene 1
- AS
antisense
- S
sense
- UTR
untranslated region
- EF-1α
elongation factor 1 α
- Trun-EF
mutated and truncated EF-1α
- GAPDH
glyceraldehyde-3-phosphate dehydrogenase
References
- 1.Epstein J I, Pizov G, Walsh P C. Cancer. 1993;71:3582–3593. doi: 10.1002/1097-0142(19930601)71:11<3582::aid-cncr2820711120>3.0.co;2-y. [DOI] [PubMed] [Google Scholar]
- 2.Mukamel E, Hanna J, deKernion J B. Urology. 1987;30:318–323. doi: 10.1016/0090-4295(87)90292-5. [DOI] [PubMed] [Google Scholar]
- 3.Salo J O, Kivisaari L, Rannikko S, Lehtonen T J. J Urol. 1987;137:435–438. doi: 10.1016/s0022-5347(17)44059-6. [DOI] [PubMed] [Google Scholar]
- 4.Katz A E, Olsson C A, Raffo A J, Cama C, Pelman H, Seaman E, O’Toole K M, McMahon D, Benson M C, Buttyan R. Urology. 1994;43:765–775. doi: 10.1016/0090-4295(94)90132-5. [DOI] [PubMed] [Google Scholar]
- 5.Israeli R S, Miller W H, Jr, Su S L, Powell T, Fair W R, Samadi S D, Huryk R F, DeBlasio A, Edwards E T, Wise G J, Heston W D W. Cancer Res. 1994;54:6306–6310. [PubMed] [Google Scholar]
- 6.Su Z-z, Olsson C A, Zimmer S G, Fisher P B. Anticancer Res. 1992;12:297–304. [PubMed] [Google Scholar]
- 7.Shen R, Su Z-z, Olsson C A, Fisher P B. Proc Natl Acad Sci USA. 1995;92:6778–6782. doi: 10.1073/pnas.92.15.6778. [DOI] [PMC free article] [PubMed] [Google Scholar]
- 8.Sun Y, Lin J, Katz A E, Fisher P B. Cancer Res. 1997;57:18–23. [PubMed] [Google Scholar]
- 9.Jiang H, Lin J, Su Z-z, Kerbel R S, Herlyn M, Weissman R B, Welch D, Fisher P B. Oncogene. 1995;10:1855–1864. [PubMed] [Google Scholar]
- 10.Jiang H, Su Z-z, Lin J J, Goldstein N I, Young C S H, Fisher P B. Proc Natl Acad Sci USA. 1996;93:9160–9165. doi: 10.1073/pnas.93.17.9160. [DOI] [PMC free article] [PubMed] [Google Scholar]
- 11.Babiss L E, Zimmer S G, Fisher P B. Science. 1985;228:1099–1101. doi: 10.1126/science.2581317. [DOI] [PubMed] [Google Scholar]
- 12.Su Z-z, Austin V N, Zimmer S G, Fisher P B. Oncogene. 1993;8:1211–1219. [PubMed] [Google Scholar]
- 13.Fisher P B, Bozzone J, Weinstein I B. Cell. 1979;18:695–705. doi: 10.1016/0092-8674(79)90124-7. [DOI] [PubMed] [Google Scholar]
- 14.Duigou G J, Babiss L E, Iman D S, Shay J W, Fisher P B. Mol Cell Biol. 1990;10:2027–2034. doi: 10.1128/mcb.10.5.2027. [DOI] [PMC free article] [PubMed] [Google Scholar]
- 15.Duigou G J, Su Z-z, Babiss L E, Driscoll B, Fung Y K, Fisher P B. Oncogene. 1991;6:1813–1824. [PubMed] [Google Scholar]
- 16.Merrick W C. Microbiol Rev. 1992;60:291–315. doi: 10.1128/mr.56.2.291-315.1992. [DOI] [PMC free article] [PubMed] [Google Scholar]
- 17.Hwang Y W, Sanchez A, Miller D L. J Biol Chem. 1989;264:8304–8309. [PubMed] [Google Scholar]
- 18.Tapio S, Kurland C G. Mol Gen Genet. 1986;205:186–188. doi: 10.1007/BF02428051. [DOI] [PubMed] [Google Scholar]
- 19.Hughes D, Atkins J F, Thompson S. EMBO J. 1987;6:4235–4239. doi: 10.1002/j.1460-2075.1987.tb02772.x. [DOI] [PMC free article] [PubMed] [Google Scholar]
- 20.Sandbaken M G, Culbertson M R. Genetics. 1988;120:923–934. doi: 10.1093/genetics/120.4.923. [DOI] [PMC free article] [PubMed] [Google Scholar]
- 21.Song J M, Picologlou S, Grant C M, Firoozan M, Truite M F, Liebman S. Mol Cell Biol. 1989;9:4571–4575. doi: 10.1128/mcb.9.10.4571. [DOI] [PMC free article] [PubMed] [Google Scholar]
- 22.Neckers L, Whitesell L, Rosolen A, Geselowitz D A. Crit Rev Oncogen. 1992;3:175–231. [PubMed] [Google Scholar]
- 23.Toulme J-J, Helene C. Gene. 1988;72:51–58. doi: 10.1016/0378-1119(88)90127-8. [DOI] [PubMed] [Google Scholar]
- 24.Stein C A, Cheng Y-C. Science. 1993;261:1004–1012. doi: 10.1126/science.8351515. [DOI] [PubMed] [Google Scholar]
- 25.Fisher P B. In: Tumor Promotion and Cocarcinogenesis In Vitro: Mechanisms of Tumor Promotion. Slaga T J, editor. Boca Raton, FL: CRC; 1984. pp. 57–123. [Google Scholar]
- 26.Loeb L A. Cancer Res. 1994;54:420–424. [PubMed] [Google Scholar]
- 27.Rabbitts T H. Nature (London) 1994;372:143–149. doi: 10.1038/372143a0. [DOI] [PubMed] [Google Scholar]
- 28.Riis B, Rattan S I S, Clark B F C, Merrick W C. Trends Biochem Sci. 1990;15:420–424. doi: 10.1016/0968-0004(90)90279-k. [DOI] [PubMed] [Google Scholar]
- 29.Sonnenberg N. Curr Biol. 1993;5:955–960. doi: 10.1016/0955-0674(93)90076-3. [DOI] [PubMed] [Google Scholar]
- 30.Lazaris-Karatzas A, Sonenberg N. Mol Cell Biol. 1992;12:1234–1238. doi: 10.1128/mcb.12.3.1234. [DOI] [PMC free article] [PubMed] [Google Scholar]
- 31.Lazaris-Karatzas A, Montine K S, Sonenberg N. Nature (London) 1990;345:544–547. doi: 10.1038/345544a0. [DOI] [PubMed] [Google Scholar]
- 32.De Benedetti A, Joshi B, Graff J R, Zimmer S G. Mol Cell Diff. 1994;2:309–334. [Google Scholar]
- 33.Tatsuka M, Mitsui H, Wada M, Nagata A, Nojima H, Okayama H. Nature (London) 1992;359:333–336. doi: 10.1038/359333a0. [DOI] [PubMed] [Google Scholar]
- 34.Grant A G, Flomen R M, Tizard M L V, Grant D A W. Int J Cancer. 1992;51:740–745. doi: 10.1002/ijc.2910500513. [DOI] [PubMed] [Google Scholar]
- 35.Bourne H R, Sanders D A, McCormick F. Nature (London) 1991;349:117–127. doi: 10.1038/349117a0. [DOI] [PubMed] [Google Scholar]


