

Abstract
Virtual reality locomotion simulators are a promising tool for evaluating the effectiveness of vision aids to mobility for people with low vision. This study examined two factors to gain insight into the verisimilitude requirements of the test environment: the effects of treadmill walking and the suitability of using controls as surrogate patients. Ten “tunnel vision” patients with retinitis pigmentosa (RP) were tasked with identifying which side of a clearly visible obstacle their heading through the virtual environment would lead them, and were scored both on accuracy and on their distance from the obstacle when they responded. They were tested both while walking on a treadmill and while standing, as they viewed a scene representing progress through a shopping mall. Control subjects, each wearing a head-mounted field restriction to simulate the vision of a paired patient, were also tested. At wide angles of approach, controls and patients performed with a comparably high degree of accuracy, and made their choices at comparable distances from the obstacle. At narrow angles of approach, patients’ accuracy increased when walking, while controls’ accuracy decreased. When walking, both patients and controls delayed their decisions until closer to the obstacle. We conclude that a head-mounted field restriction is not sufficient for simulating tunnel vision, but that the improved performance observed for walking compared to standing suggests that a walking interface (such as a treadmill) may be essential for eliciting natural perceptually-guided behavior in virtual reality locomotion simulators.
General Terms: Experimentation, Human Factors, Measurement
Additional Key Words and Phrases: collision, glaucoma, locomotion, low vision, rehabilitation, treadmill, retinitis pigmentosa (RP)
1. INTRODUCTION
1.1 Objectives
Since their inception nearly a decade ago [Pelah, et al. 1998], treadmill-based walking simulators with projected displays have been finding increasing use in a range of applications, from basic studies on visuomotor interactions (e.g., [Mohler, et al. 2007]) to clinical studies on mobility rehabilitation [Fung, et al. 2006]. Along with its convenience as a stationary walker, its wide availability, and relatively low cost, the treadmill interface is used because of its presumed verisimilitude to the natural walking experience. Treadmills are routinely used in locomotion simulators, with or without virtual displays, despite perceptual anomalies not normally present in natural walking [Pelah and Barlow 1996], and biomechanical and other differences [Anstis 1995; Durgin and Pelah 1999; Durgin, et al. 2005; 2007; Pelah and Barlow 1996], yet no quantifiable performance advantage of using treadmills in a visuomotor task has yet been reported. In this study we investigated whether walking on a treadmill can indeed make a positive contribution to performance in a virtual-reality locomotion simulator, using an important measure of human navigation, heading assessment. As a secondary purpose, we examined whether the performance of tunnel-vision patients in the heading assessment task would be adequately simulated by normally-sighted controls wearing head-mounted patient-matched field and acuity restrictions.
1.2 Motivation
Retinitis pigmentosa (RP) refers to a group of hereditary disorders that often lead to progressive visual field loss. RP presents with a number of visual deficits, including night blindness, reduced contrast sensitivity, and a progressive constriction from the periphery in the size of the visual field (VF), leading to so-called “tunnel vision”. RP patients, and other patients with peripheral field loss (PFL) including some glaucoma sufferers, find everyday mobility tasks like crossing the street exceedingly perilous, and are prone to bumping into things or tripping over low-lying obstacles and uneven terrain [Lovie-Kitchin, et al. 1990; Marron and Bailey 1982]. No other sensory or motor deficits are normally associated with the more common forms of RP, and of the visual manifestations, the PFL is likely to affect patient mobility most severely [Pelli 1987].
Several types of devices have been introduced over recent years to assist the mobility of individuals with reduced peripheral vision, with some currently being developed and tested in our laboratory. The aim of such devices is to augment or enhance the visual information available to the patient to help avoid mobility mishaps like falls and collisions. These visual aids range from optical devices, based on prisms fixed to eye glasses which direct the image from near-peripheral to the residual functioning central areas of the visual field [Peli 2000; Woods and Peli 2002], to head-worn electronic displays [Luo, et al. 2005; Vargas-Martin and Peli 2002], which apply real-time image processing such as edge detection and use image minification to expand the visual field [Bowers, et al. 2004; Luo and Peli 2006a; Vargas-Martin and Peli 2002]. However, although patients happily volunteer subjective reports on their usefulness, it is difficult to obtain an objective and quantitative assessment that can predict the benefits or problems a device would introduce in normal everyday use. Patients are also a scarce resource, often finding that travel makes it difficult for them to participate. Field tests are difficult to run, hard to control and reproduce accurately, and potentially dangerous, while laboratory tests often omit potentially important aspects of real mobility experience. In addition, the development of new devices is crucially hindered by insufficient knowledge of how patients use their available sensory information during active mobility, and therefore how best to enhance or supplement this information with a low-vision aid [Luo and Peli 2004; 2006a; 2006b; Vargas-Martin and Peli 2001; 2006].
1.3 Heading assessment and peripheral vision
A peripheral visual field is important for collision avoidance, and there are several reasons why RP patients with none or little of it (including co-author HA) are at greater risk of collisions and falls. In the trivial case (not considered in this paper), a restricted visual field could increase collisions simply because the capture area for potential obstacles is much smaller than it is for normally-sighted people, and thus the person with PFL may fail to even see an obstacle before colliding with it. In addition, RP patients preferentially direct their fixations to guiding features along their path, suggesting that their restricted field also affects their ability to guide their self-movement, and that scanning is done to obtain needed navigation information [Turano, et al. 2001]. In navigation, walkers need to perceive their heading, in order to know where they are going, and to avoid collisions by judging their ego-position [Rushton, et al. 1998] with respect to a seen obstacle. Heading information is available from optic flow [Gibson 1950; 1983; Warren and Hannon 1988], with performance generally reduced for smaller optic flow stimuli [Crowell and Banks 1993; Warren and Kurtz 1992], and RP patients indeed require longer stimulus exposure times to match the control-level performance [Li, et al. 2002]. Parallactic retinal image displacement, registered from a fixated stationary obstacle and its surroundings during movement of the observer is an additional effective source for both heading detection and collision avoidance information [Cutting, et al. 1992]. Thus, because fewer objects and relative retinal image movements would generally appear in a smaller field, patients with restricted peripheral fields would have compromised access to this information in heading assessment and collision avoidance tasks [Cornelissen and van den Dobbelsteen 1999].
1.4 Effects of walking
The act of walking while performing a characteristic locomotion-related task like heading assessment may be expected to enhance performance. Indeed, investigating natural mobility tasks without actual walking, while very widespread [Cutting, et al. 1992; 1995; Li, et al. 2002], is arguably anomalous, since its absence from the integrated multisensory experience of natural locomotion may represent a sensory conflict, being contrary to sensory expectations from everyday living [Pelah and Barlow 1996]. Walking can profoundly affect visual motion perception, as it is adaptively related to expected visual flow [Pelah and Barlow 1996]. Walking speed linearly reduces visual speed perception, selectively for optic flow and matched to motor activity in a manner that preserves environmental constancy [Pelah and Thurrell 2001; Thurrell, et al. 1998; Thurrell and Pelah 2002], while walking and physical movement through space separately and additively reduce linear speed perception [Durgin, et al. 2005]. Furthermore, the proprioceptive cues associated with walking can improve navigation efficiency within a virtual environment [Ruddle and Lessels 2006], and can increase the sense of immersion, even when walking in place on a stationary surface, although not to the same extent as true walking [Usoh, et al. 1999]. A walking interface in VR has also been shown to have certain training benefits [Grant and Magee 1998]. On the other hand, walking may arguably hinder collision detection – even when mollified by visual and vestibular reflexes [Berthoz and Jones 1985] – by increasing the degree of visual instability from retinal slip due to the jittery movements of the head. Finally, walking may turn out to have no effect on performance, perhaps on the argument that non-visual signals neither contribute nor detract from the task of assessing heading visually. Certainly, experimental testing without walking is technically easier, suggesting that unless it has been shown to make a positive difference, a walking interface need not be included.
1.5 The investigation
The present study is an extension of a published abstract [Pelah, et al. 2002]. A key aspect of our VR locomotion simulator, based on [Pelah, et al. 1998], is that it permits an approximation of natural walking through the use of a treadmill, and this dimension is included for its perceptual influence and possible benefits in improving the realism of mobility in VR. The difficulties and dangers of testing in a real-world environment make it hard to directly determine the degree to which a virtual environment can be used as an alternative. We chose instead to probe how changes within the virtual environment affect the test outcomes, reasoning that differences would reveal dimensions needing further investigation, while any lack of differences could collapse the number of issues to address. We thus investigated differences caused by walking, with implications toward a future assessment of whether any differences found would bring the VR results closer to real-world experience. The virtual environment models the main corridor of the Arsenal Mall in Watertown, Massachusetts, where we are conducting mobility studies leading to direct comparison of the virtual and real-world experiences. Achieving a better understanding of the sensory processing strategies used by RP and other PFL patients to avoid collisions will guide the development of new visual aids.
In addition to examining the effect of including walking, we also investigated the degree to which artificially restricting the vision of normally-sighted control subjects reproduced the results of patients with advanced PFL due to RP. We measured how well subjects identified whether their advance (in the virtual environment) towards an impending stationary obstacle would take them to the right or left of it. A group of 10 patients (ages 31 to 66), diagnosed with various degrees of advanced RP, was compared to a group of 10 normal-vision control subjects (ages 22 to 60). The methods were psychophysical, using a testing paradigm similar to Cutting et al. [1992; 1995], except with the potentially important parameter of actual walking on an exercise treadmill, and the requirement to respond as soon as they felt confident. Control subjects were tested with their normal visual fields as well as while wearing a head-mounted visual field restriction, to assess the degree to which their performance mirrored that of the patients. Each control was paired methodologically with a patient, and used a field restriction (and blur filter, when appropriate) that approximated the patient’s field (and visual acuity). Both groups of subjects were tested with and without walking, and in each case the controls were tested with and without restricted vision. We studied the accuracy of their responses and how near they approached the virtual obstacle before giving their response.
2. METHODS
2.1 The Experimental Setup
The simulator (Figure 1) consisted of a projection screen (1.7 m × 1.25 m) upon which motion through the VR environment was rear-projected at a resolution of 1024x768 pixels. A Woodway Desmo-S treadmill, in which the belt is conveyed on bearings that reduce friction significantly compared with conventional exercise treadmills, faced the screen. Subjects were able to walk on the treadmill by pushing onto the crossbar positioned in front and advancing the treadmill belt by foot power in its non-motorized mode, thus allowing the subject to walk at a self-selected and variable velocity (as opposed to a constant speed imposed by a motor), as well as providing for a high degree of head and visual stability under normal viewing conditions. Moving in this way is equivalent to pushing a shopping cart; the important difference being that the subject remains in one place.
Fig. 1.
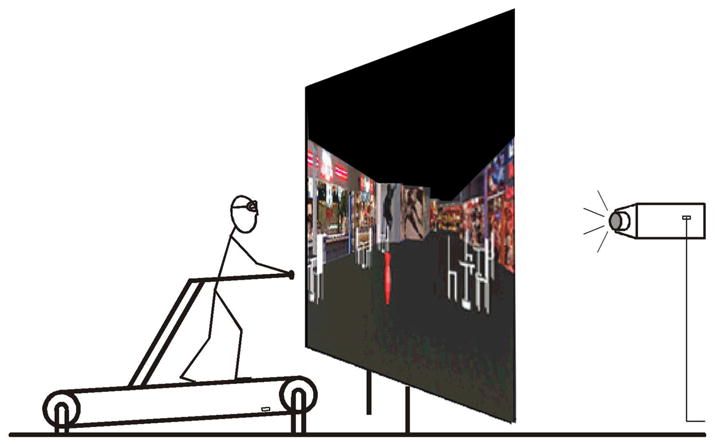
The locomotion simulator. The subject walks on a non-motorized treadmill facing a large rear-projected screen that displays a dynamic virtual reality reconstruction of a walkway within an actual shopping mall. The treadmill front was tilted slightly to facilitate self-propelled walking.
Control subjects and patients viewed short motion segments derived from a virtual reconstruction of the shopping mall. Store-front images were grafted onto the mall physical database, and distances were assigned in the virtual world to match the real measurements of the mall, derived from architectural maps and drawings. The data for the virtual environment and its presentation in experiments were handled by the SENSE8 World Toolkit software package.
Each video segment simulated the view that would occur with observer movement at a constant speed – not yoked to the treadmill speed when the subject was walking – and consisted of a maximum of 7 s of visual motion. Not yoking the visual display to the treadmill (which was technically possible) enabled exact repetition of the visual stimulus at each trial, rather than it depending on the subject’s speed variation, while ‘perceptual yoking’ was ensured by subjects initiating walking prior to the onset of the visual stimulus. The sequence represented the perspective of an observer walking from a fixed point in the mall and advancing smoothly in the general direction of a clearly viewed obstacle, a large red vase measuring approximately 0.6 m high by 0.23 m at its widest diameter. Viewing distance was 0.75 m from the screen, varying slightly while subjects walked during the course of a trial. The angle subtended at the eye by the vase’s full height varied smoothly from approximately 4° to 20°. The total length of the mall walkway from the starting point to the vase was 8.6 m, and thus the simulated visual speed was 1.23 m/s, independent of treadmill speed. Subjects either remained standing or walked at their chosen speeds. Six different trajectories were presented; three passing to the left and three to the right of the vase (Figure 2), at 1.15, 1.91, 3.43, −1.15, −1.91, and −3.43° visual angle of approach with respect to the center of the vase. Pilot runs that also included 0° angle of approach trials showed no directional bias for either left or right responses. Trials at 0° were thus not included in the main experiment.
Fig. 2.
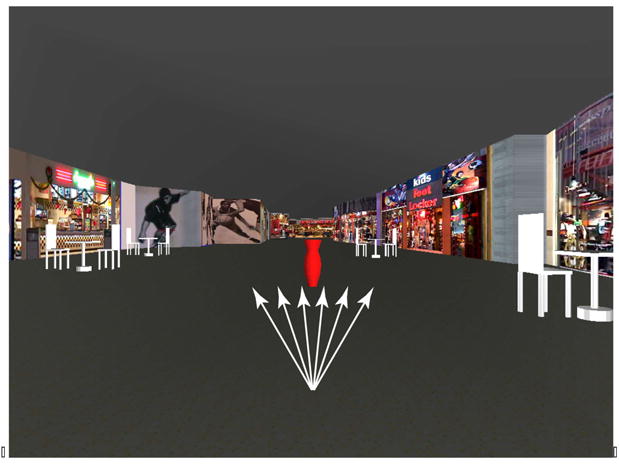
Motion trajectories in the virtual environment. The subject’s visual path passes to one side or the other of a central vase placed as an obstacle. Equal numbers of trials were presented at each of six angles, three heading to either side of the central red vase. The angles represented by arrows are exaggerated and for illustration only, and did not appear in the stimulus display. The vase in the figure is at a simulated distance of 3.6m, where it spans approximately 10° visual angle in height and 4° in width. Although not visible here, the floor had a faint mottled gray texture to augment optic flow cues when viewed in our darkened laboratory.
The mall environment, with different shops on either side and near to a food court, is intended to simulate an arbitrary realistic environment in which RP patients might actually need to walk, in order to induce, it is hoped, more natural behavior. The environment is therefore complex, asymmetrical, and relatively rich with objects such as tables and chairs, with these other objects not appearing as obstacles in the path of the subject (Figure 2). The individual motion clips are correspondingly rich with visual motion cues that would be used by subjects for their psychophysical response, including the predominant cue of (monocular) motion parallax. The method chosen for this study was a comparison between the responses of control subjects and patients to the same stimuli, and between different conditions for the same group of subjects.
2.2 Subjects
Ten patients (2 women) with advanced retinitis pigmentosa (RP), presenting with various (severe) degrees of PFL, referred to henceforth as ‘patients’ (Table 1) participated. A patient’s visual field size is listed as the horizontal extent at the horizontal meridian through the fovea, measured with an Autoplot perimeter (Bausch and Lomb, Rochester, NY) using a white target of 6 mm presented from a distance of 1m. One additional patient (not listed) was unable to perform above chance level in the experiments, owing to extremely poor visual acuity, and was thus excluded from the study. All included subjects were able to perform well above chance in at least some of the trials, despite, in some cases, extreme vision limitations. A second group of 10 individuals (4 women), emmetropes or with corrected-to-normal visual acuity and with no visual field loss, acted as control subjects. They are henceforth referred to as ‘controls’ or ‘control subjects’. Controls were recruited from members of our laboratory. Age range was similar, but not precisely matched, between the two groups.
2.3 Procedures
Patients and control subjects were briefed on the overall, but not the specific, purposes of the experiments, explained their rights with respect to their voluntary participation, and allowed to read (or were read) the consent forms they were asked to sign. All protocols used in this study were approved by the Schepens institutional review board.
Patients’ visual field, visual acuity, and refraction were measured, and the visual acuity of control subjects was confirmed. Patients viewed the stimulus monocularly during experiments with the eye of their choice, by wearing a patch over the other eye, and wearing prescribed glasses. We used monocular viewing to mitigate the lack of stereo images, but no attempt was made to track viewpoint changes and adjust for parallax due to head movement.
Control subjects always used their right eye. Goggles were worn by the controls during restricted-viewing trials to approximate the vision of a randomly-paired patient (Figure 3). Controls paired with patients whose visual acuity was worse than 20/40 were additionally outfitted with blur filters that approximated their paired patient’s acuity. For unrestricted trials, the filter was worn in similar goggles without the tube. Those goggles did not quite permit the entire screen to be viewed from a single fixation in unrestricted trials, but this was not seen as a significant limitation compared to the blur effect and the need to concentrate on the center of the screen. During unrestricted trials, the subset of control subjects who did not use the goggles wore an eye patch on their left eye1.
Fig. 3.
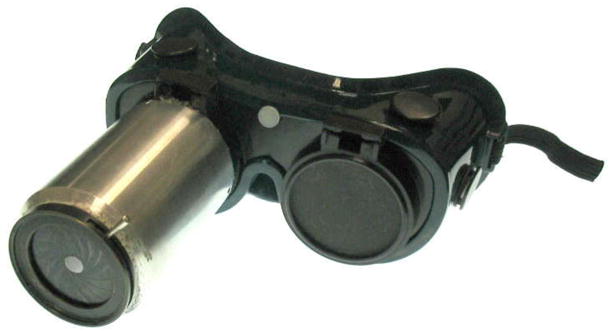
Goggles used by control subjects in restricted vision trials. The adjustable iris on the extension tube was used to match the field size of each patient. Control subjects paired with patients with acuity 20/40 or worse had their vision blurred by layers of sandwich-bag-like plastic added until their vision was within one line of their patient’s on a Snellen chart viewed at one meter (to approximate the distance they would be viewing the VR screen). An opaque disc in the left eyepiece obscured vision by that eye. The iris opening in the photograph is set for the control subject with a 5° restricted field of view. The extension tube was necessary to avoid a pinhole magnification (diffraction) effect at the smallest settings.
An experimental session lasted between 30 and 45 minutes. Patients were tested in six runs; three walking and three stationary, with their order varied arbitrarily from subject to subject. Control subjects were tested in eight runs, two each for the four condition combinations of walking and not walking, with and without field restriction. To minimize fatigue, walking and non-walking runs were alternated, with half of the controls starting with walking. To minimize the need to take goggles on and off, while balancing the condition order, two runs without field restriction were followed by four runs with, and then two more runs without. Each run contained 24 short trials consisting of four presentations of each of the six angle-of-approach paths. The presentation order of the angles of approach during each run was randomized. In a trial, subjects viewed a motion clip representing their visual self-motion through the same section of a shopping mall walkway (Figure 2), and were asked to concentrate on the vase obstacle, which started at the same screen location each time so that obstacle detection would not be a problem.
Subjects were asked to judge, based on the visual scene, their approach with respect to the vase obstacle. Specifically, they were asked to call out “right” or “left”, as soon as they could determine if their path would pass to the right or left, respectively, of the vase, and were instructed to do that as quickly and accurately as possible. A decision was required in all trials (2AFC). They were given practice trials to familiarize them with the task and check that they were interpreting right and left correctly. Subjects were encouraged to rest between runs, although none found the tasks physically arduous. As soon as the subject called out a response (‘left’ or ‘right’) the experimenter would register it by pressing one of two computer mouse buttons, recording the time and position in the motion segment, and thus including the effect of a small delay due to the experimenter’s response time. A trial would terminate as soon as a mouse button was pressed, a dark blank screen was displayed, and the next trial would begin after a 1 s delay. For the walking runs, subjects continued to walk between the trials.
2.4 Measures
Two measures were derived from trials. The first measure, accuracy, is based on the percentage of correct responses averaged over trials for a given condition, group or subject. The conditions noted included angle of approach, whether walking or standing still, whether patient or control, and, in the case of controls, whether with full-field or restricted vision. The second measure, decision distance, is the virtual distance of the subject from the obstacle at the point that the subject’s response is recorded. It can have a theoretical maximum value of 8.6m – which is the distance from the starting point to the vase obstacle. Thus, a smaller decision distance value represents a longer delay in response, after getting closer to the obstacle, and consequently a poorer performance in this measure.
2.5 Statistical analyses
Although subjects were tested at six starting angles of approach, data from positive and negative angles were combined. In addition, since performance at the larger approach angles was high and clearly different from that at the smallest angle of approach, data from the two larger angles were combined. To simplify notation, results are reported as 1° for angles 1.15° and −1.15°, and 2 & 3° for angles 1.91°, 3.43°, and their left-side negatives.
A p value less than α = 0.05 was used as the basis for rejecting the null hypothesis that samples were drawn from equivalent populations or that test conditions were equivalent. All tests are two-tailed. Unless otherwise noted, all data for controls are with field restriction in place.
3. RESULTS
3.1 Effect of walking
The primary question addressed by this study was: What effect did walking have on performance? As shown on the upper-front edge of the left cube in Figure 4, at 1° angles of approach patients were more accurate in their responses when walking vs. not walking (p = 0.031). At 2 & 3° approaches, we found no significant accuracy difference between walking and not walking (p = 0.297). The difference in the distance from the vase at which judgments were made did vary significantly between patients walking and not walking, at all angles of approach, as the patients made their decisions at a closer position to the obstacle when walking. (p = 0.004 and p = 0.002, for 1° and 2 & 3° approaches, respectively). Figure 5 plots the distribution of data for each measure used in these comparisons.
Fig. 4.
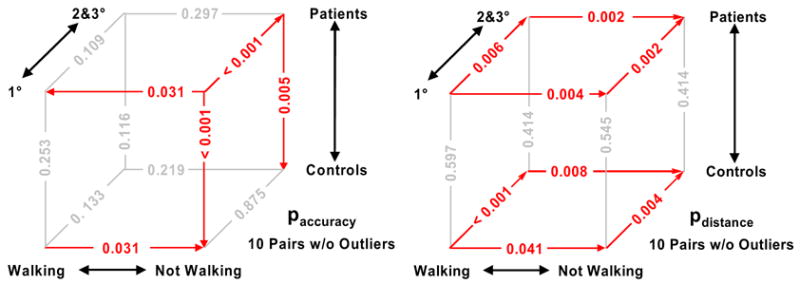
Significance diagrams for comparisons of decision accuracy (left) and decision distance (right). The cube axes represent the condition alternatives of walking vs. not walking, patients vs. restricted controls, and narrow vs. wider angles of approach. Significance (p) values for the comparison of the conditions at pairs of vertices are shown on the connecting edge. An edge is colored red for results significant at p ≤ 0.05, and an arrowhead points to the condition with higher median. Comparisons between patients and restricted controls were performed via Kruskal-Wallis nonparametric ANOVA (n=10 per condition) [Hollander and Wolfe 1973], while comparisons within a group (patients or controls) used the more powerful Friedman test for paired replicates (n=10 pairs per comparison) [Siegel and Castellan 1988]. The outliers identified in Figure 5 are excluded from these comparisons.
Fig. 5.
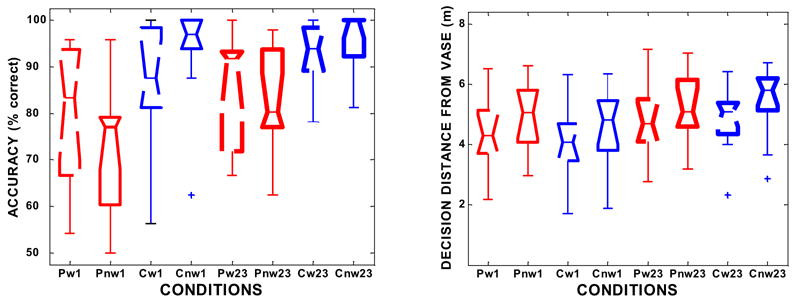
Box plots showing the distribution of data for each condition. Red plots represent patients (P), while blue plots represent controls (C).The boxes are dashed if the subjects were walking (w) and solid if stationary (nw). The label for each plot reflects those conditions as well as whether the trials were at a narrow angle of approach (1°, shown as 1) or the wider angles (2 & 3°, shown as 23). The left figure plots accuracy data, while the right plots decision distance from the obstacle. Box limits are at the 25th and 75th percentiles. Medians are shown at the box “waists”, and “whiskers” extend to the minimum and maximum values after 3 outliers beyond 1.5 times the interquartile range are excluded (and plotted with a + symbol). It can be seen that the data do not meet the distribution and variance constraints that would have permitted us to use more powerful parametric tests such as repeated measures ANOVAs in our comparisons.
3.2 Controls as surrogates
The secondary question addressed patients’ performance compared to that of the control subjects. When controls were tested with vision restricted by the mechanical iris and, in some cases, with blur filters so that their vision approximated that of a paired patient, there were differences and similarities. Controls were more accurate than the patients at all angles when not walking (p < 0.001 and p = 0.005 for 1 and 2 & 3° angles, respectively). When walking, no significant accuracy differences were found between patients and controls at any angle (p = 0.253 at 1° and p = 0.116 at 2 & 3°). No significant difference in patient vs. control decision distance was found under any of the conditions (p ≥ 0.414).
Walking had a significant effect on restricted controls’ accuracy at narrow angles of approach (p = 0.031), but, unlike the patients, their accuracy decreased when walking. No significant effect on controls’ accuracy was found at the larger angles or when not walking (p ≥ 0.133). Restricted controls showed a pattern similar to patients for decision distance, with walking and narrow-angle approaches separately and together decreasing decision distance from the obstacle (p ≤ 0.041).
3.3 Effect of pairing
Matching patients with controls with comparable field restrictions was done to permit pairwise analyses that would support the hypothesis that restricted controls could serve as surrogates for patients. However we found no significant pairwise correlation in essentially all comparisons between patients and controls. At the wide angles of approach, there were at best mild correlations when not walking (R2 = 0.456 and 0.178, for accuracy and decision distance, respectively), and that was likely an artifact of clustering at near-perfect scores for that easiest of conditions. All other correlations were in the R2 range of 0.003 to 0.04. As a consequence, we switched from the Friedman test to Kruskal-Wallis when comparing patients and controls, as the pairings that would form the basis of the Friedman test were moot. The results of these tests are summarized in the cube diagrams of Figure 5.
While it might be expected that performance would decrease with decreasing visual field size, we found essentially no significant correlation of field size with accuracy or decision distance at any angle. There was a weak correlation of patients’ field size with judgment distance at 2 & 3° of R2 = 0.40, but this essentially disappeared if patient HA was excluded (R2 = 0.10). HA’s VF of 12° was the only one larger than 8°. All other R2 values were in the range of 0.025 to 0.225.
We found even less correlation between patient performance and age, with all R2 values less than 0.015.
We did, however, find an effect of acuity. Patients with poorer acuity tended to delay their decisions until closer to the obstacle (R2 > 0.53), but we found no such correlation between acuity and accuracy (R2 < 0.2 in all but the walking at wide angles condition, where R2 = 0.3. See Figure 6). Given the lack of correlation between patient performance and VF size, it is not surprising that patient and paired control often performed differently (see Figure 7). No significant correlation between restricted VF and control performance was found, with R2 values between 0.01 and 0.28 across the various conditions, averaging 0.10. There was also no significant correlation found between restricted acuity and decision distance (R2 < 0.08 under all conditions). There was, however, possibly an effect of restricted acuity on accuracy, with R2 = 0.42 for walking 1° approaches, but R2 < 0.16 for all other conditions.
Fig. 6.
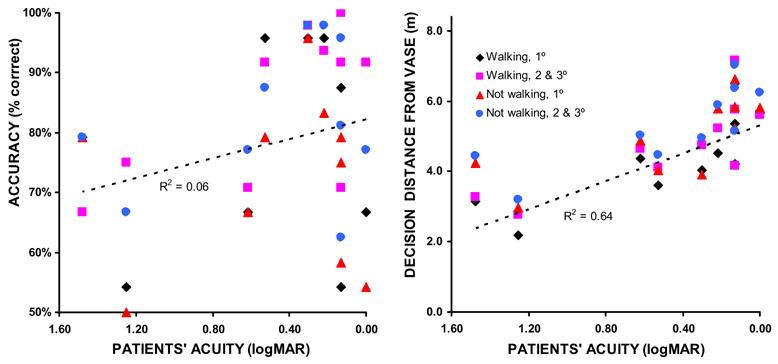
Performance as a function of patient acuity. Patients with poor acuity delayed their decisions until closer to the obstacle, but there was no effect found of acuity on accuracy. Regression lines are only shown for the most challenging condition; walking at 1° approaches. No significant correlations were found between artificially-restricted acuity and either performance measure for controls (not shown).
Fig. 7.
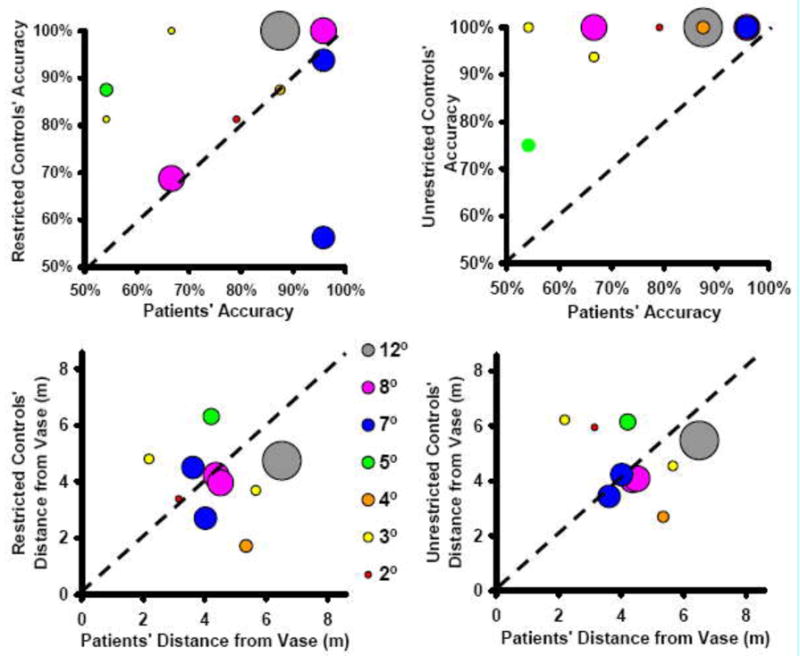
Patient vs. control pairings, walking at 1° approach: Accuracy when control subject’s vision was restricted vs. unrestricted, and decision distance (in meters) with restricted and unrestricted vision. The dots are proportional to VF size, and the dashed lines represent equal performance. While the pairings by field size aren’t particularly good, due to the lack of correlation of field with performance, the patients and restricted controls covered comparable ranges. The effect of vision restrictions on the control subjects’ accuracy is evident.
Although not well correlated, the vision restrictions overall did impact control subjects’ accuracy, as all but one performed near 100% accuracy when not restricted. Thus the restrictions did tend to move control subjects’ performance into the same range as patients’, even though field size was not predictive and acuity was at best slightly predictive under controls’ most challenging condition.
4. DISCUSSION
Our primary interest, motivated by a desire to assess locomotor activity by tunnel vision patients to guide development of visual mobility aids, was to discover whether physical walking in a treadmill-based, projected-display locomotion simulator would result in a performance improvement in a heading assessment task. The question is an important one. If there were no differences, or differences that only degraded performance, it could be argued that a passive-display-only simulation of walking, as done in similar experiments (e.g.[Cornelissen and van den Dobbelsteen 1999]) or commercial (e.g. desktop-based) applications, is sufficient to produce a valid simulation of the locomotor experience that elicits natural perceptually-guided behavior. Our results suggest, however, that this is not the case for the patients and conditions we tested in that, at the most challenging angles of approach, patients were more accurate while treadmill walking compared with standing. The finding that walking movements can affect visual speed perception [Durgin, et al. 2005; Pelah and Thurrell 2001; Thurrell, et al. 1998; Thurrell and Pelah 2002; 2005] does not directly predict performance in the present task, but our findings remain consistent with it in showing that walking can also influence another aspect of visual perception, namely the assessment of heading.
Patients’ increase in accuracy when walking was somewhat offset by a decrease in the distance from the obstacle at which they responded. Indeed, in all cases, walking and narrower angles of approach separately and together delayed decision making, so it is not likely that the offset in decision distance can account for the increase in accuracy when walking. And while decision distances varied over a relatively small range, accuracies were much more widely distributed, suggesting a relatively more robust effect of walking on accuracy than the reduction in decision distance.
While it was not one of our study goals, the lack of any significant correlation between patients’ VF size and performance can be puzzling. It may be a matter of their increased concentration in more difficult circumstances, or that patients with smaller field sizes have, over time, developed adaptations that help them locate relevant cues more readily. Indeed, it is quite likely that different subjects (patients and controls as well) employed different strategies when assessing their heading, given the richness of available cues. For some, optic flow may have been more important, while for others the apparent motion of the vase with respect to the background may have provided their cues. Acuity loss seems to have played a more important role than VF, and may have confounded attempts to examine the effects of field loss.
Cornelissen and van den Dobbelsteen [1999], on the other hand, found significant correlations between field size and performance, but their results are not directly comparable with ours for several reasons. In their study, they tracked eye movements and restricted the virtual display instantaneously to the small area around the point of regard, thus obviating the need for head movement. In fact, there was no appreciable head movement, as their subjects’ heads were restrained to keep the position of primary gaze (i.e., where the nose pointed) fixed. They did not test actual patients; their comparisons were strictly between restricted and unrestricted normally-sighted subjects. They sampled four restricted field sizes in the range of 5 to 20.5°, while we had eight samples in the 2 to 12° range. While they only tested four subjects, they included many more trials per subject. Their simulated environment used random dots rather than a real-world model as stimulus, and importantly, they did not test walking. We are developing the ability to track eye and head movements simultaneously [Barabas, et al. 2004; 2005], to address the field restriction question in the manner of Cornelissen and van den Dobbelsteen while still permitting actual locomotion.
The secondary aim of the study was to determine if normal-vision controls with vision artificially restricted to approximate that of the patients could serve as patient surrogates in PFL studies of this kind. While we found that the vision restrictions did place control accuracy and decision distances in ranges reasonably comparable to those of the patients, there was no significant correlation between patient and paired control. In fact, like the patients, performance of controls did not correlate with visual field size in the range tested. And while patient accuracy at narrow angles increased when walking, control accuracy decreased.
Patients, of course, have years of experience with their restricted vision, while the imposed field restriction was new for the controls. By virtue of their condition, patients are practiced and arguably more skilled at using available internal and external signals in performing difficult tasks. When comparable restrictions are placed on controls, they would not have an equivalent level of experience to draw upon and would thus perform relatively more poorly. This factor may similarly explain why, unlike the patients, walking did not improve performance for controls (rather, it reduced it). However, it is quite likely as well that controls’ decrease in performance when walking with the field restriction may have been due to the head-mounted nature of the restriction. The head-mounted goggles and iris required the controls to make scanning head movements in lieu of eye movements, whereas patients could simply move their eyes. That effect would have been exacerbated by the bobbing motions of walking. Vestibular reflexes would automatically stabilize gaze for the patients during head motion, but no such correction would occur for the field-restricted controls.
There is other evidence suggestive that the performance differences between patients and control were qualitative, not just quantitative. Reduced acuity did not affect patient accuracy, but did affect decision distance. For controls, the situation reversed, as acuity impacted accuracy under the critical conditions of walking at narrow angles of approach, while we found no such effect on their decision distances.
In the present study we used relatively parsimonious first approximations to simulating field restriction and reduced acuity, and perhaps a more sophisticated head- and eye-tracking system would help better relate control subjects’ performance to that of PFL patients. In the design of future studies, it would also be valuable to vary VF size and acuity independently. Thus, though leaving unresolved the question of the suitability of normally-sighted controls as surrogates for patients with PFL, the performance improvements we found for walking patients is evidence for the importance of using combined visual and locomotor interfaces in virtual reality simulations of locomotion. The non-visual sensory signals associated with walking apparently contribute to the experience of walking in a virtual environment. While walking is often presumed to be a desirable feature towards verisimilitude in a virtual reality system, this may be the first instance where an artificial walking interface, in this case a treadmill, is shown to have a measurable advantage in performing a realistic perceptual task.
5. CONCLUSIONS
We set out to see if treadmill walking had an effect on tunnel-vision patients’ ability to assess their path though a virtual environment. We found that a sample of ten patients significantly improved their accuracy in heading assessment while walking, compared to standing, in a treadmill-based virtual display environment. Other results suggest that using normally sighted control subjects to study PFL in patients would at a minimum likely require head-tracking and gaze-contingent considerations. The patients’ experience with restricted fields, as compared with that of controls, may have also played a role. Our findings support the use of treadmill walking interfaces for virtual reality locomotion simulators, and support the need for developing and evaluating future walking interface devices using realistic perceptual tasks.
TABLE I.
PATIENT DEMOGRAPHICS
| Patient ID | Field Size* | Visual Acuity |
Age | Sex | Eye Used | |
|---|---|---|---|---|---|---|
| Snellen | logMAR | |||||
| DN1 | 2 | 20/600 | 1.48 | 44 | M | Right |
| YR | 3 | 20/357 | 1.25 | 54 | M | Right |
| NK | 3 | 20/20 | 0.0 | 55 | M | Right |
| HC | 4 | 20/27 | 0.13 | 33 | M | Right |
| LS | 5 | 20/27 | 0.13 | 66 | M | Left |
| DN2 | 7 | 20/67 | 0.53 | 43 | M | Right |
| NS | 7 | 20/40 | 0.30 | 63 | M | Right |
| AN | 8 | 20/83 | 0.62 | 31 | F | Right |
| NE | 8 | 20/33 | 0.22 | 61 | F | Left |
| HA | 12 | 20/27 | 0.13 | 60 | M | Left |
Defined as the maximum horizontal extent of the field in degrees measured in the eye with the wider field, which is also the eye used in the experiments.
Acknowledgments
We are grateful for extensive technical and experimental support from Reed Hedges, Jennifer Shieh, Bob Goldstein, James Barabas and Lee Lichtenstein of Schepens, and Melinda Turner and Rachel Hucknall, formerly of the Physiology Department, University of Cambridge, England. We also thank Adrian Thurrell (Cambridge) for Figure 1, Russell L. Woods of Schepens for his help in experiment design and analysis, and Marshall Doane of Schepens for help in fabricating the field-restriction goggles. We especially want to thank the anonymous reviewers for the considerable effort they put into their comments. Their suggestions led us to a deeper analysis of the results and helped produce a much clearer manuscript. Supported in part by NIH grant EY12890.
Footnotes
Permission to make digital/hard copy of part of this work for personal or classroom use is granted without fee provided that the copies are not made or distributed for profit or commercial advantage, the copyright notice, the title of the publication, and its date of appear, and notice is given that copying is by permission of the ACM, Inc. To copy otherwise, to republish, to post on servers, or to redistribute to lists, requires prior specific permission and/or a fee. Permissions may be requested from Publications Dept., ACM, Inc., 2 Penn Plaza, Suite 701, New York, NY 10121-0701 USA, fax + 1 (212) 869-0481, or permissions@acm.org.
The control subject assigned a 5° iris setting was inadvertently tested on two of unrestricted trials without the eye patch. This is not likely to have biased the data, as that control has an esotropic left eye. In addition, results for those trials were essentially the same as the two trials of that type when the patch was worn.
This work was supported in part by NIH grant EY12890 to E. Peli.
Contributor Information
HENRY APFELBAUM, Schepens Eye Research Institute, Harvard Medical School.
ADAR PELAH, University of York, Schepens Eye Research Institute, Harvard Medical School, University of Cambridge.
ELI PELI, Schepens Eye Research Institute, Harvard Medical School.
References
- Anstis S. Aftereffects from jogging. Experimental Brain Research. 1995;103(3):476–478. doi: 10.1007/BF00241507. [DOI] [PubMed] [Google Scholar]
- Barabas J, Woods RL, Goldstein RB, Peli E. Perception of collisions while walking in a virtual environment with simulated peripheral vision loss (abstract) Journal of Vision. 2004;4(8):806a. [Google Scholar]
- Barabas J, Woods RL, Peli E. Walking simulator for evaluation of ophthalmic devices. In: Rogowitz BE, Pappas TN, Daly SJ, editors. Proceedings of the SPIE -IS&T Electronic Imaging. SPIE Vol. 5666. SPIE; Bellingham, WA: 2005. Jan, 2005. pp. 424–433. [Google Scholar]
- Berthoz A, Jones M, editors. Adaptive Mechanisms in Gaze Control: Facts and Theories. Elsevier; Amsterdam, New York, Oxford: 1985. [Google Scholar]
- Bowers AR, Luo G, Rensing NM, Peli E. Evaluation of a prototype minified augmented-view device for patients with impaired night vision. Ophthalmic Physiological Optics. 2004;24(7):296–312. doi: 10.1111/j.1475-1313.2004.00228.x. [DOI] [PubMed] [Google Scholar]
- Cornelissen FW, van den Dobbelsteen JJ. Heading detection with simulated visual field defects. Visual Impairment Research I. 1999 1999 August;2:71–84. [Google Scholar]
- Crowell JA, Banks MS. Perceiving heading with different retinal regions and types of optic flow. Perception & Psychophysics. 1993;53(3):325–337. doi: 10.3758/bf03205187. [DOI] [PubMed] [Google Scholar]
- Cutting JE, Springer K, Braren PA, Johnson SH. Wayfinding on foot from information in retinal, not optical, flow. Journal of Experimental Psychology: General. 1992;121(1):41–72. doi: 10.1037//0096-3445.121.1.41. [DOI] [PubMed] [Google Scholar]
- Cutting JE, Vishton PM, Braren PA. How we avoid collisions with stationary and moving obstacles. Psychological Review. 1995;102(4):627–651. [Google Scholar]
- Durgin FH, Pelah A. Visuomotor adaptation without vision? Experimental Brain Research. 1999;127(1):12–18. doi: 10.1007/s002210050769. [DOI] [PubMed] [Google Scholar]
- Durgin FH, Gigone K, Scott R. Perception of visual speed while moving. Journal of Experimental Psychology: Human Perception and Performance. 2005;31(2):339–353. doi: 10.1037/0096-1523.31.2.339. [DOI] [PubMed] [Google Scholar]
- Durgin FH, Reed C, Tigue C. Step frequency, near space and perceived self-motion. ACM Transactions on Applied Perception. 2007;4:1. [Google Scholar]
- Fung J, Richards CL, Malouin F, McFadyen BJ, Lamontagne A. A treadmill and motion coupled virtual reality system for gait training post-stroke. CyberPsychology & behavior. 2006;9(2):157–162. doi: 10.1089/cpb.2006.9.157. [DOI] [PubMed] [Google Scholar]
- Gibson JJ. The perception of the visual world. Houghton Mifflin; Boston: 1950. [Google Scholar]
- Gibson JJ. The Senses Considered as Perceptual Systems. Greenwood Press; Westport, Connecticut: 1983. [Google Scholar]
- Grant SC, Magee LE. Contributions of proprioception to navigation in virtual environments. Human Factors. 1998;40(3):489–497. doi: 10.1518/001872098779591296. [DOI] [PubMed] [Google Scholar]
- Hollander M, Wolfe DA. Nonparametric Statistical Methods. Wiley; New York: 1973. [Google Scholar]
- Li L, Peli E, Warren WH. Heading perception in patients with advanced retinitis pigmentosa. Optometry and Vision Science. 2002;79(9):581–589. doi: 10.1097/00006324-200209000-00009. [DOI] [PubMed] [Google Scholar]
- Lovie-Kitchin J, Mainstone J, Robinson J, Brown B. What areas of the visual field are important for mobility in low vision patients? Clinical Vision Sciences. 1990;5(3):249–263. [Google Scholar]
- Luo G, Peli E. Digest of Technical Papers. Society for Information Display; 2004. 2004. Kinematics of visual search by tunnel vision patients with augmented vision see-through HMD; pp. 1578–1581. [Google Scholar]
- Luo G, Rensing NM, Weststrate E, Peli E. Registration of an on-axis see-through head mounted display and camera system. Optical Engineering. 2005;44:2. [Google Scholar]
- Luo G, Peli E. Use of an augmented-vision device for visual search by patients with tunnel vision. Investigative Ophthalmology & Visual Science. 2006a;47(9):4152–4159. doi: 10.1167/iovs.05-1672. [DOI] [PMC free article] [PubMed] [Google Scholar]
- Luo G, Peli E. Patients with tunnel vision frequently saccade to outside their visual fields in visual search (abstract) Journal of Vision. 2006b;6(6):505–505. [Google Scholar]
- Marron JA, Bailey IL. Visual factors and orientation-mobility performance. American Journal of Optometry & Physiological Optics. 1982;59(5):413–426. doi: 10.1097/00006324-198205000-00009. [DOI] [PubMed] [Google Scholar]
- Mohler BJ, Thompson WB, Creem-Regehr SH, Willemsen P, Pick HL, Rieser JJ. Calibration of locomotion due to visual motion in a treadmill-based virtual environment. ACM Transactions on Applied Perception. 2007;4:1. [Google Scholar]
- Pelah A, Barlow HB. Visual illusion from running. Nature. 1996;381(6580):283. doi: 10.1038/381283a0. [DOI] [PubMed] [Google Scholar]
- Pelah A, Secker B, Bishop A, Askham C. A wide-field simulator for studying the visuo-motor interactions in locomotion. Journal of Physiology. 1998;506:P13–P14. [Google Scholar]
- Pelah A, Thurrell AEI. Reduction of perceived visual speed during locomotion: Evidence for quadrupedal perceptual pathways in human? (Abstract) Journal of Vision. 2001;1(3):307a. [Google Scholar]
- Pelah A, Hucknall R, Hedges R, Turner M, Shieh J, Apfelbaum H, Peli E. Measures of obstacle avoidance while walking in a virtual environment by patients with retinitis pigmentosa (abstract), Association for Research in Vision and Ophthalmology (ARVO CD) Item . 2002:3913. [Google Scholar]
- Peli E. Field expansion for homonymous hemianopia by optically-induced peripheral exotropia. Optometry and Visual Science. 2000;77(9):453–464. doi: 10.1097/00006324-200009000-00006. [DOI] [PubMed] [Google Scholar]
- Pelli D. The visual requirements of mobility. In: Woo GC, editor. Low Vision: Principles and Applications. Springer-Verlag; New York: 1987. [Google Scholar]
- Ruddle RA, Lessels S. For efficient navigational search, humans require full physical movement, but not a rich visual scene. Psychological Science. 2006;17(6):460–465. doi: 10.1111/j.1467-9280.2006.01728.x. [DOI] [PubMed] [Google Scholar]
- Rushton SK, Harris JM, Lloyd MR, Wann JP. Guidance of locomotion on foot uses perceived target location rather than optic flow. Current Biology. 1998;8(21):1191–1194. doi: 10.1016/s0960-9822(07)00492-7. [DOI] [PubMed] [Google Scholar]
- Siegel S, Castellan NJ., Jr . Nonparametric Statistics for the Behavioral Sciences (2e) McGraw-Hill; New York: 1988. [Google Scholar]
- Thurrell AEI, Pelah A, Distler HK. The influence of non-visual signals of walking on the perceived speed of optic flow (abstract) Perception. 1998;27:147. [Google Scholar]
- Thurrell AEI, Pelah A. Reduction of perceived visual speed during walking: Effect dependent upon stimulus similarity to the visual consequences of locomotion (abstract) 2002 Available at: http://www.journalofvision.org/1/3/307/index.html.
- Thurrell AEI, Pelah A. Matching visual and non-visual signals: Evidence for a mechanism to discount optic flow during locomotion. In: Rogowitz BE, Pappas TN, Daly SJ, editors. Proceedings of the SPIE -IS&T Electronic Imaging. SPIE Vol. 5666. SPIE; Bellingham, WA: 2005. Jan, 2005. pp. 434–448. [Google Scholar]
- Turano KA, Geruschat DR, Baker FH, Stahl JW, Shapiro MD. Direction of gaze while walking a simple route: persons with normal vision and persons with retinitis pigmentosa. Optometry and Vision Science. 2001;78(9):667–675. doi: 10.1097/00006324-200109000-00012. [DOI] [PubMed] [Google Scholar]
- Usoh M, Arthur K, Whitton MC, Bastos R, Steed A, Slater M, Brooks FP., Jr . Walking > walking-in-place > flying, in virtual environments. ACM Press; Addison-Wesley Publishing Co: 1999. pp. 359–364. [Google Scholar]
- Vargas-Martin F, Peli E. Eye movements with peripheral visual field loss while walking (abstract) Investigative Ophthalmology and Visual Science. 2001;42(ARVO Supplement):s858. [Google Scholar]
- Vargas-Martin F, Peli E. Augmented-view for restricted visual field: multiple device implementations. Optometry and Vision Science. 2002;79(11):715–723. doi: 10.1097/00006324-200211000-00009. [DOI] [PubMed] [Google Scholar]
- Vargas-Martin F, Peli E. Eye movements of patients with tunnel vision while walking. Investigative Ophthalmology & Visual Science. 2006;47(12):5295–5302. doi: 10.1167/iovs.05-1043. [DOI] [PMC free article] [PubMed] [Google Scholar]
- Warren WH, Hannon DJ. Direction of self-motion is perceived from optic flow. Nature. 1988;336:162–163. [Google Scholar]
- Warren WH, Kurtz KJ. The role of central and peripheral vision in perceiving the direction of self-motion. Perception & Psychophysics. 1992;51(5):443–454. doi: 10.3758/bf03211640. [DOI] [PubMed] [Google Scholar]
- Woods RL, Peli E. Development of a novel optical aid for people with severely restricted visual fields (abstract), Association for Research in Vision and Ophthalmology (ARVO CD) Item . 2002:3799. [Google Scholar]