


Abstract
The interferon regulatory transcription factor (IRF-3) is activated by phosphorylation of Ser/Thr residues clustered in its C-terminal domain. Phosphorylation of these residues, which increases the negative charge of IRF-3, results in its dimerization and association with DNA, despite the increase in repulsive electrostatic interactions. To investigate this surprising effect, the dimerization of IRF-3 and two phosphomimetic mutants, 2D (S396D, S398D) and 5D (S396D, S398D, S402D, T404D and S405D), and their binding to single-site PRDI and double-site PRDIII–PRDI DNA sequences from the IFN-β enhancer have been studied. It was found that: (a) the mutations in the C-terminal domain do not affect the state of the DNA-binding N-terminal domain or its ability to bind target DNA; (b) in the 5D-mutant, the local increase of negative charge in the C-terminal domain induces restructuring, resulting in the formation of a stable dimer; (c) dimerization of IRF-3 is the basis of its strong binding to PRDIII–PRDI sites since binding of 5D to the single PRDI site is similar to that of inactivated IRF-3. Analysis of the binding characteristics leads to the conclusion that binding of dimeric IRF-3 to the DNA with two tandem-binding sites, which are twisted by ∼100° relative to each other, requires considerable work to untwist and/or bend the DNA.
INTRODUCTION
The interferon regulatory transcription factor (IRF) family plays a critical role in the activation of interferon genes upon virus infection (1–3). One of the most studied members of this family, IRF-3, is normally in a latent state but upon virus infection is activated by phosphorylation of certain Ser and Thr residues. Phosphorylated IRF-3 translocates to the nucleus and binds to its target DNA sequences as a dimer. According to structural studies, IRF-3 has two compact domains (Figure 1a): the N-terminal DNA-binding domain (NTD) and the C-terminal transactivation domain (CTD), responsible for their dimerization upon virus-induced phosphorylation (4–10). In IRF-3, these domains are connected by a 70-residue Pro-rich linker containing a nuclear export signal (NES) sequence (11,12). The conformational state of this linker is unclear but since it is Pro-rich, it has been predicted to be unfolded. However, our analysis of its sequence showed that the 15-residue segment of the linker that includes the NES, has a very high helix propensity (Figure 1b). Moreover, we have found a definite repeat of the apolar residues which in the helical conformation would form the apolar face specific for the polypeptides forming coiled-coils, e.g. leucine-zippers.
Figure 1.

(a) Structures of the DNA-binding N-terminal domain [1T2K (7)] and C-terminal transactivation (dimerization) domain [1QWT (8)] of IRF-3 connected by the hypothetical 75-residue linker. (b) Sequence of the linker (first row) and its helix propensity (second row, index ‘h’ denotes residue with high helix propensity). The segment responsible for NES has high helix propensity. This sequence is given in capital blue and red letters showing regular arrangement of apolar residues (red) specific for the polypeptides forming coiled-coils (e.g. leucine-zippers).
Mimicking phosphorylation of Ser/Thr residues by substitution with phosphomimetic Asp (11–13) demonstrated the essential role in activation played by these residues grouped on a short loop (residues 383–410) in the C-terminal domain: the 5D mutant (S396D, S398D, S402D, T404 and S405D) dimerizes, translocates into the nucleus and activates the target genes (11). The key question is how phosphorylation of these residues activates IRF-3. Specifically, how does phosphorylation of the C-terminal domain lead to dimerization of IRF-3 and how do changes in this domain increase the ability of its N-terminal domain to bind DNA?
Phosphorylation of five Ser/Thr residues substantially increases the negative charge of the C-terminal domain, which must increase repulsive electrostatic interactions between these domains and also between the complete, intact IRF and the negatively charged DNA (Figure 2). It has so far been assumed that in the latent inactive state, the C-terminal domain masks the N-terminal domain from DNA and virus-induced phosphorylation relieves their association, thereby activating IRF-3 (8,12). The N-terminal domain is however positively charged; so increasing the negative charge of the C-terminal domain might be expected to strengthen its association with the N-terminal domain, as well as decrease C-terminal domain interactions in the dimer. The molecular mechanism of IRF activation is thus far from clear.
Figure 2.

Cartoons showing: (a) binding of monomeric IRF-3 to the PRDI and PRDIII major groove-binding sites, which are twisted by ∼100° relative to each other (1 turn +3 bp) in undistorted B-form DNA; (b) binding of the phosphorylated, i.e. activated dimeric IRF-3 5D to the PRDI and PRDIII sites with consequent DNA twisting and perhaps bending. The spacer DNA between the binding sites is shown in green.
MATERIALS AND METHODS
Proteins
In this study, we used the NTD of IRF-3, the full-length wild-type IRF-3 and two phosphomimetic mutants, 5D (S396D, S398D, S402D, T404 and S405) and 2D (S396D and S398D). A plasmid encoding the 113-residue NTD was kindly provided by Dr C. Escalante. It was expressed in Escherichia coli BL21(DE3)pLysS cells and purified as described (14,15). The expression plasmid encoding a full-length glutathione S-transferase (GST)–IRF-3 fusion was kindly provided by Dr J. Hiscott. Modified versions with substitutions S396D and S398D (2D IRF-3) and substitutions S396D, S398D, S402D, T404D and S405D (5D IRF-3) were made by mutagenesis in our group. GST–IRF-3 (1–427) was isolated from BL21 DE3 pLysS following a 3 h induction with 1 mM IPTG at 20°C. Bacterial extracts in PBS containing 1% Triton X-100 were incubated with glutathione-agarose beads for 30 min at room temperature. After three washes with PBS, the fusion proteins were stored on the beads with the addition of protease inhibitors. Resuspended beads were incubated with glutathione (50 mM Tris, 10 mM reduced glutathione) and released fusion protein was incubated with thrombin for 48 h at room temperature to cleave the GST tag. The solution was then dialyzed against a buffer containing 100 mM NaCl, 20 mM Tris, pH 7.3, 1 mM DTT, 0.1 mM EDTA, and the sample was loaded onto a DEAE column to separate IRF-3 from GST and degradation products. IRF-3 was concentrated and dialyzed against the appropriate buffer. The same procedure was used for expression and purification of the IRF-3 2D and 5D mutants. Concentrations of NTD and IRF-3 proteins were determined using extinction coefficients of: ε280 = 31 010 and 90 620 M-1cm-1, respectively. The purity and integrity of all the proteins used were checked by PAGE and MALDI mass-spectrometry and found to be better than 95%.
DNA duplexes
Binding studies used a 26-bp DNA containing the two IRF-binding sites, PRDI and PRDIII from the human interferon-β enhanceosome and a 13-bp DNA containing a single PRDI binding site:
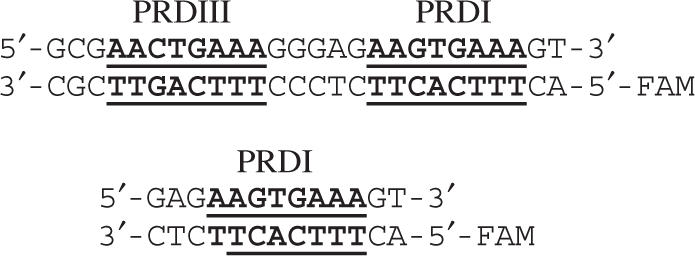
All oligonucleotides were purchased from Integrated DNA Technologies, Inc. and additionally purified by anion exchange FPLC on a Mono-Q column, using a linear 0.1–1.0 M NaCl gradient in 10 mM Tris-HCl buffer (pH 7.0), 1 mM EDTA, 20% acetonitrile. The DNA was precipitated with ethanol, pelleted and air dried. Concentrations of single strands and duplexes were determined from the A260 of the nucleotides after complete digestion by phosphodiesterase I (Sigma) in 100 mM Tris-HCl (pH 8.0). To determine the concentration of labeled single strands, the additional contribution of FAM absorption at 260 nm (E260 = 28 000 M-1cm-1) was taken into account.
DNA duplexes were prepared by mixing the complementary oligonucleotides in equimolar amounts, heating to 70°C and cooling slowly to room temperature. Solutions of duplex DNA for the experiments were prepared by extensive dialysis against the required buffer.
Spectrofluorimetry
Fluorescence spectra of the proteins and the fluorescence anisotropy of DNA, corrected for the G-factor, were measured on a SPEX FluoroMax-3 spectrofluorimeter under control of DataMax software (version 2.10). The intrinsic fluorescence of the proteins was excited at 280 nm and monitored over the wavelength range from 290 to 400 nm. The instrument has a thermostated cell holder and software-controlled water bath. A 0.4-cm path-length quartz Suprasil cell was used. All measurements were conducted in 30 mM sodium phosphate buffer (pH 7.4), 100 mM NaCl, 1 mM DTT. Association constants of the monomeric WT IRF-3 and the 5D mutant with the 13-bp PRDI and 26-bp PRDIII–PRDI DNA duplexes labeled with FAM were evaluated by direct fitting of the measured binding isotherms as described (16).
In the case of dimeric IRF-3 5D binding to the double-site DNA, the dimer↔monomer equilibrium was taken into account and the association constant of this dimer was evaluated by fitting the experimental data to the equation:
| 1 |
where 
 is the concentration of free dimer; Po is the total concentration of protein;
  is the dissociation constant of the 5D dimer;
 is the dissociation constant of the 5D dimer–DNA complex; [DNA] is the total concentration of the DNA; A is the fluorescence anisotropy of DNA observed in the course of titration, whilst Af and Ab are the anisotropies of the free and bound DNA, respectively. The fluorescence of FAM was excited at 490 nm and registered at 520 nm. The association constants (Ka) were measured at 20°C and provided the Gibbs energies of association, ΔGa = RTln(Ka).
GdmCl denaturation
The free energy of unfolding by guanidinium hydrochloride (GdmCl) was determined by monitoring changes in the intrinsic fluorescence of the IRF-3 protein, as described in (15,17). For direct fitting of the denaturation plots, the following equation was used:
| 2 |
where A = exp[(ΔGunf – munf × [GdmCl])/RT], ΔGunf and munf are the fitted parameters representing the Gibbs energy of unfolding at 0 M GdmCl and the parameter munf indicating the increase of denaturant-accessible protein surface upon unfolding.
The free energy of the IRF-3 5D dimer dissociation by GdmCl was obtained by measuring changes of its ellipticity at 220 nm and fitting to the following equation:
| 3 |
where ΔGo is a standard Gibbs energy of the 5D dimer dissociation at 0 M GdmCl.
Native page
Native PAGE was performed using the PhastSystem (Pharmacia). For analysis of IRF-3 monomers and dimers, PhastGel Gradient 4–12% gels were used. The concentration of proteins in loading buffer (30 mM Na-phosphate, 100 mM NaCl, 1% β-mercaptoethanol, pH 7.4) was varied from 0.2 to 0.6 mg/ml. Stained gels were scanned and the volumes of bands (Vm and Vd), corresponding to the monomer and the dimer of IRF-3 (5D), were calculated using ImageQuant TL software. Estimation of dimerization constants used the following equation:
| 4 |
where Po is the total concentration of protein.
Light scattering
Dynamic light scattering experiments were carried out using a DynaPro Molecular Sizing Instrument equipped with a Peltier thermostated cell holder and operated under Dynamics 4.0 data acquisition and analysis software control. This instrument measures the intensity of scattered light and estimates the apparent hydrodynamic radius of the averaged scattering macromolecules. A special 12-μl quartz micro-cuvette was used. All solutions were filtered using a MicroFilter system equipped with 0.1 and 0.02 μm Anodisc filters. The observed hydrodynamic radius (RH) of the proteins studied, the radius of the hypothetical sphere ( ) and the frictional ratio (f/fo) were calculated using DynaPro software. The light scattering was recorded at 20°C in solutions containing 100 mM NaCl, 30 mM Na-phosphate, pH 7.4 (for the full-length IRF-3 proteins, 1 mM DTT was added). Concentrations of the IRF-3 DBD used were ∼1 mg/ml and those of IRF-3 WT, 2D and 5D mutants were ∼0.5 mg/ml.
RESULTS AND DISCUSSION
Formation of dimer
Figure 3 shows the results of native PAGE of IRF-3 WT and its 2D and 5D mutants. One can see that the mobilities of the 2D and 5D monomers are greater than that of the wild type, as expected for proteins differing in their net overall charges: IRF-3 WT, 9; the 2D mutant –11, and the 5D mutant –14 (Figure 3). It can also be seen that only the IRF-3 5D mutant forms dimers. Analysis of the electrophoregrams obtained at several concentrations of the 5D mutant (not shown) indicated that the dissociation constant of the dimer is on the order of 10 nM, i.e. the dimerization Gibbs energy is −(45 ± 3) kJ/mol.
Figure 3.

Analysis of the dimerization of IRF-3 WT and its two phosphomimetic mutants (2D and 5D) by native PAGE, showing that only IRF-3 5D mutant is in the dimeric form.
Stability of the IRF-3 domains
IRF-3 contains 14 tryptophans, 5 of which are in the NTD, 9 in the CTD (114–189), while the linker has none (Figure 1b). Structural changes in the NTD and CTD can thus be monitored using their intrinsic fluorescence.
Figure 4a and b shows fluorescence spectra of the isolated NTD and the full-length wild-type IRF-3, respectively. Increasing concentrations of GdmCl result in a decrease of fluorescence intensity and in a red shift of the maximum to 356 nm that is characteristic for fully solvent-exposed tryptophan. Plotting the wavelength of the fluorescence maximum, λmax, versus GdmCl concentration (Figure 4c) shows that the NTD unfolds in one stage at ∼2 M GdmCl, while unfolding of the full-length IRF-3 WT proceeds in two stages: one at ∼2 M, the other above 3 M GdmCl. Clearly the first stage is associated with unfolding of the NTD and the second with unfolding of the CTD.
Figure 4.

(a) Fluorescence spectra of the isolated N-terminal domain of IRF-3 (DBD) in the presence of different concentrations of GdmCl. (b) Fluorescence spectra of full-length IRF-3 (WT) in the presence of different concentrations of GdmCl. (c) Dependence of the maximum of fluorescence intensity on the concentration of GdmCl for the isolated N-terminal domain (NTD) and IRF-3 (WT). (d) Dependence of the maximum of fluorescence intensity on the concentration of GdmCl for the 2D and 5D mutants.
In the 2D mutant (Figure 4d), the first stage of unfolding is little changed by the Ser/Asp substitutions in the CTD. That is, pseudo-phosphorylation at these sites does not affect the stability of the NTD: the position of the fluorescence maximum at low concentrations of GdmCl (<1.5 M) is invariant and similar to that of IRF-3 WT, and their mid-transitions are at the same concentration of GdmCl (2.2 M). In the case of the 5D mutant, the fluorescence spectrum in the absence of GdmCl is blue-shifted by 2 nm relative to the spectra of the IRF-3 WT and 2D monomers (Figure 4d). This shift in the initial λmax indicates an increased screening of tryptophans from the solvent, which could be caused by dimerization of the 5D monomers. Thus, the gradual rise of λmax to the value specific for the monomeric proteins (346 nm) shows that the 5D dimers dissociate upon increasing GdmCl concentration up to 1.5 M. Unfolding of the NTD in 5D takes place at the same concentrations of GdmCl as in the 2D and WT IRF-3 proteins, but unfolding of the CTD becomes less cooperative and occurs at lower GdmCl concentrations than in the wild-type protein, indicating some reduction in stability of this domain.
Another specificity of the GdmCl-induced changes in the fluorescence spectra of WT IRF-3, containing two structural domains, the NTD and CTD, is the presence of two isobestic points at ∼388 and 341 nm (Figure 4b). The first, at 388 nm, appears at GdmCl concentrations <3 M. The characteristic changes in spectra in this range of GdmCl and the long-wavelength position of the isobestic point clearly demonstrate similarity with that of the isolated NTD (Figure 4a) and show that unfolding of this domain proceeds in a highly cooperative manner. The shorter wavelength isobestic point, at ∼341 nm, which occurs at GdmCl concentrations above 3 M, can thus be assigned to the cooperative unfolding of the remainder of the molecule, the CTD. Plotting the fluorescence intensities at the isobestic points allows one to separate the two transitions in the WT IRF-3 (Figure 5a and b), and thereby determine the GdmCl dependence of the folded fraction for the N-terminal and C-terminal domains (Figure 6a). This yielded the m-factor that specifies the change in solvent-accessible surface area upon unfolding and the Gibbs energy of unfolding that characterizes the stability of the domains (17–19) (Figure 6b, Table 1). An important aspect of this analysis is that the 5D mutant is monomeric at GdmCl concentrations above 1.5 M.
Figure 5.

Plots of the fluorescence intensity of the WT IRF-3 at (a) the 341-nm isobestic point, where the signal from the C-terminal domain is essentially constant, and (b) at the 388-nm isobestic point, where the signal from the N-terminal DBD is essentially constant.
Figure 6.

(a) The dependence of the folded fractions of the N- and C-terminal domains on the concentration of GdmCl for full-length IRF-3 WT and its 2D and 5D mutants. The N-terminal domain unfolds at lower GdmCl concentration than the C-terminal domain. (b) Plots of the Gibbs energies of unfolding of the NTD and CTD domains in the WT, 2D and 5D IRF-3 versus the GdmCl concentration, which yield the standard Gibbs energies and m-factors of unfolding these domains.
Table 1.
The Gibbs energy of stabilization and the m-factor of the isolated N-terminal domain of IRF-3 (DBD) and both domains in full-length IRF-3 and its 2D and 5D mutants, determined from analysis of the first and second transitions resulting from increasing GdmCl concentration at 20°C
| First transition, N-terminal domain | Second transition, C-terminal domain | |||
|---|---|---|---|---|
| Protein | ΔGunf | munf | ΔGunf | munf |
| NTD | 28 ± 1 | 15 ± 1 | – | – |
| IRF-3 WT | 21 ± 1 | 11 ± 0.6 | 50 ± 5 | 14 ± 1.6 |
| IRF-3 2D | 20 ± 1 | 11 ± 0.4 | 34 ± 6 | 11 ± 2 |
| IRF-3 5D | 19 ± 2 | 10 ± 1 | 24 ± 6 | 7 ± 2 |
ΔGobs and ΔGunf in kJ mol-1; munf in kJ mol-1 M-1. The data were fitted to the equation ΔGobs = ΔGunf – munf × [GdmCl], where ΔGobs is the free energy of unfolding measured at different GdmCl concentrations; ΔGunf is the free energy of protein unfolding in the absence of denaturant; the munf parameter reflects the change of denaturant accessible surface area upon unfolding.
Table 1 shows that (a) the WT CTD is twice as stable as the NTD; (b) the stability of both domains decreases with increasing negative charge on the CTD, but this effect is much more pronounced for the CTD; (c) the m-factor of the CTD in the 5D mutant is only about half that of the WT protein.
A decrease in the stability of the NTD upon increase in the number of charges on the CTD is somewhat surprising since, if the 75-residue hinge connecting these two domains is unfolded, the CTD should not be close to the NTD. Thus, the influence of C-terminal charges on the stability of the N-terminal domain raises doubts that the linker is completely unfolded and the two domains widely separated.
Much less surprising is the observed strong influence of (Ser, Thr)/Asp substitutions (i.e. an increase of negative charge) in the CTD on its stability. However, the 2-fold drop in stability on adding five charges suggests that this might be associated with substantial changes in its structure, a conclusion borne out by the substantial drop in the m-factor. Decrease in the m-factor indicates an increase in exposed surface area of the initial state. This implies that substitution of multiple residues (S396D, S398D, S402D, T404D and S405D) in the 5D mutant results in partial unfolding of this domain. However, CD studies showed that the overall effect of this substitution is not so simple.
Formation of dimer
Figure 7a presents CD spectra of the wild-type IRF-3, 2D and 5D mutants at 20°C. The substitutions S396D and S398D (2D) increase the negative value of the ellipticity at 207 nm, showing that the two extra negative charges lead to partial unfolding of the protein. One would expect that appearance of five extra negative charges would result in further unfolding of the protein. In fact, the three additional charges in 5D protein result in an increase of its helicity: the ellipticity at 207 nm decreases with simultaneous increase of negative ellipticity at ∼220 nm. Since this 5D substitution is made in the C-terminal domain, the observed structural changes should be attributed to this domain. The increase of order in this domain with increased negative charge is surprising and can be explained only by its dimerization.
Figure 7.

(a) The CD spectra of the WT, 2D and 5D IRF-3. (b) The dependence of the ellipticity at 220 nm on GdmCl concentration for the WT and 5D IRF-3. Inset: plot of the Gibbs energy of dissociation of the 5D mutant versus GdmCl concentration, which yields the standard Gibbs energy and m-factor of dissociation of the 5D dimer.
According to the above fluorescent measurements, dissociation of the 5D dimer occurs at ∼1.5 M GdmCl (Figure 4c). CD titration of the IRF-3 5D at 220 nm (Figure 7b) shows that its negative ellipticity drops sigmoidally upon increasing the GdmCl concentration up to 1.5 M, while the ellipticity of the wild-type protein does not significantly change in this range of GdmCl concentrations. It appears that dimerization and ordering are two conjugate effects specific for the 5D mutant: the increase of negative charge in the CTD induces its restructuring resulting in the formation of the stable dimer.
Analysis of the dissociation isotherm of the 5D dimer with increase of GdmCl concentration (Figure 7b, inset) gives –18 kJ/(mol M) for the m-factor and for the standard Gibbs energy of dimerization in the absence of GdmCl, ΔGdimer = –(44 ± 1) kJ/mol, i.e. the dimerization constant Kd = 8 × 10⁷ mol-l. This value of the Gibbs energy of dimerization is in accord with that estimated above by native PAGE analysis, –(45 ± 3) kJ/mol.
The large dimerization energy observed for the 5D mutant assumes the formation of quite extended contacts between the interacting CTDs. The extended contact surface is formed upon phosphorylation of S396, S398, S402, T404 and S405, so the appearance of negative charges might cause displacement of the ‘phosphorylation’ loop containing these residues (Figure 1). This would result in the exposure of a substantial surface: ∼590 Å2 of polar area and 1060 Å2 of apolar area (Table 2). Since the larger part of the exposed surface is apolar, hydrophobic interactions would play a significant role in the dimerization of the C-terminal domains. It remains unclear, however, how much the linker might participate in this dimerization process, in particular its NES segment. The high helix propensity of this segment suggests that the observed increase of helicity upon dimer formation might be due to refolding of this segment. Moreover, the regular repeat of the apolar residues (Figure 1b) suggests that two NES segments from two IRFs could form the coiled-coil, i.e. the leucine-zipper. It is tempting then to ask if this might be important for IRF-3 translocation.
Table 2.
Polar and apolar water accessible surface areas (ASAs) of the IRF-3 C-terminal domain in a closed state and in a simulated open state in which the loop (residues 384–405) is deflected away from the globular part as a result of multiple phosphorylations
| Polarity of ASA | ASA of the closed state | ASA of the open state | ΔASA |
|---|---|---|---|
| Polar + apolar | 11 175 | 12 820 | 1645 |
| Polar | 4857 | 5443 | 586 |
| Apolar | 6316 | 7376 | 1060 |
ASA in Å2/mol; ASA values were calculated using the program ‘Mole’.
DNA binding
IRF-3 binding to DNA was studied by fluorescence anisotropy titration of 5′ fluorescein (FAM)-labeled DNA. Figure 8a and b shows the results of titrating the PRDIII–PRDI 26-bp DNA and the PRDI 13-bp DNA with IRF-3 WT and its 2D and 5D mutants. It is seen (Table 3) that binding of the WT protein and the 2D and 5D mutants to the 13-bp single-site DNA (PRDI) do not differ substantially, although the isolated N-terminal domain binds somewhat stronger, probably because of its greater net positive charge. The increase in negative charge in the 2D and 5D mutants decreases their affinity for DNA (Figure 9), indicating that the C-terminal domain is not very remote from the DNA. If the linker region were fully unfolded, the charge increases in the C-terminal domain would not affect the affinity of the N-terminal domain for DNA. The reduced affinities of the 2D and 5D mutants for the 13-bp DNA thus suggest that the linker is not unfolded. Furthermore, since substitutions mimicking phosphorylation in the C-terminal domain do not substantially increase the DNA-binding ability of the N-terminal domain to the single-site duplex, one can conclude that phosphorylation of the C-terminal domain does not lead to unmasking of the DNA-binding site on the N-terminal domain.
Figure 8.

Fluorescence anisotropy titration of PRDIII–PRDI 26-bp DNA and PRDI 13-bp DNA with: (a) IRF-3 WT; (b) the IRF-3 2D mutant and (c) the IRF-3 5D mutant at 20°C. Titrations were performed in 100 mM NaCl, 1 mM DTT, 30 mM Na-phosphate buffer, pH 7.4. Concentrations of DNA were 1 μM in titrations with IRF-3 WT and the 2D mutant, and 25 nM for titrations with the 5D mutant.
Table 3.
Binding characteristics of the IRF-3 N-terminal domain (NTD), full-length IRF-3 WT and its 2D and 5D mutants with the 26-bp DNA containing the PRDIII- and PRDI-binding sites, and with the 13-bp DNA containing the single PRDI site
| Protein | 26-bp DNA containing the PRDIII-PRDI-binding sites | 13-bp DNA containing the PRDI-binding site | ||
|---|---|---|---|---|
| Kd (nM) | ΔGa (kJ/mol) | Kd (nM) | ΔGa (kJ/mol) | |
| NTD | – | – | 280 ± 15 | 36.7 ± 0.2 |
| IRF-3 WT | 1226 ± 15 | 33.1 ± 0.1 | 800 ± 17 | 34.1 ± 0.1 |
| IRF-3 2D | 1300 ± 15 | 33.0 ± 0.1 | 900 ± 15 | 33.8 ± 0.1 |
| IRF-3 5D, dimer | 5.8 ± 0.8 | 46.1 ± 0.3 | 1200 ± 20 | 33.1 ± 0.1 |
Binding buffer: 100 mM NaCl, 30 mM Na-phosphate buffer, pH 7.4. 2D and 5D are the phosphomimetic mutants of WT IRF-3 in which two residues, S396 and S398, and five residues, S396, S398, S402, T404 and S405, respectively are substituted by Asp residues. IRF-3 NTD is the N-terminal DNA-binding domain of the IRF-3 protein. Binding parameters are calculated per mole of IRF-3 monomer.
Figure 9.

Dependence of the Gibbs energy of association of IRF-3 WT, its 2D and 5D mutants, and the DNA-binding N-terminal domain (NTD) with the 13-bp single-site (PRDI) DNA on the net charge of the proteins.
In the case of binding to the 26-bp DNA that contains both the PRDIII- and PRDI-binding sites, the situation is very different: while binding of the full-length WT IRF-3 and the 2D mutant to the double-site DNA are similar and do not differ much from their binding to the 13-bp single-site DNA, binding of the 5D mutant to the double-site DNA is substantially stronger. Since substitutions in the C-terminal domain do not affect binding of the N-terminal domain to the single-site DNA, we have to conclude that the increased DNA-binding ability of 5D to the double-site DNA is a direct consequence of dimerization of the protein and not an unmasking of DNA-binding sites on the N-terminal domain.
The inter-domain linker
Monitoring the unfolding of IRF-3 by GdmCl using intrinsic fluorescence showed that full-length WT IRF-3 and the 2D and 5D mutants unfold in two distinct cooperative stages, i.e. they have two compact structural domains. There is no signal, however, from the linker because it does not contain Trp residues. Thus, we do not know if the linker is completely unfolded, has partially folded structure, or is tightly bound to one of the domains to form a single cooperative unit. To investigate this, we studied the compactness of the isolated N-terminal domain, full-length wild-type IRF-3 and the 2D and 5D mutants by dynamic light scattering. The observed hydrodynamic radii, RH, of these molecules are given in Table 4. One can see that RH of WT IRF-3 is about 1.7 times greater than that of the isolated NTD. This is the expected increase in radius, bearing in mind that the mass of WT IRF-3 is about four times that of the NTD and if one assumes that the structure of the WT IRF-3 is compact and approximately spherical. The two structural domains of the protein cannot therefore be connected by an extended flexible linker and must be in immediate contact. It should be noted that if the 75-residue segment were extended and flexible with a length of ∼24 nm, the N- and C-terminal domains would act as independent kinetic units and the average RH of the WT IRF-3 would not differ significantly from that of the isolated NTD. It is notable that RH for the 2D mutant is significantly larger than that of WT IRF-3. Since the 2D mutant remains a monomer this implies an increase in the asymmetry (f/fo) of IRF-3 that could be due to some structural reorganization. This might be a result of relieving interactions between the C-terminal domain and a part of the linker upon ‘phosphorylation’ of S396 and S398 (8,12) and/or partial release of the ‘phosphorylation loop’ (residues 383–410). Surprisingly, RH for the 5D dimer is only about 6% greater than that of 2D, despite a doubling of the mass. This can only be explained by a reduction in the asymmetry upon forming the dimer.
Table 4.
Hydrodynamic parameters of IRF-3 DBD, full-length WT, 2D and 5D IRF-3 measured by dynamic light scattering
| Protein | MW (kDa); Number of residues | RH (nm) |
(nm) |
f/fo |
|---|---|---|---|---|
| NTD | 13.09; 113 | 2.3 ± 0.05 | 1.8 | 1.3 |
| IRF-3 WT | 47.22; 427 | 3.9 ± 0.07 | 2.7 | 1.4 |
| IRF-3 2D | 47.28; 427 | 4.6 ± 0.09 | 2.7 | 1.7 |
| IRF-3 5D Dimer | 94.70; 854 | 4.9 ± 0.10 | 3.4 | 1.4 |
RH is the observed hydrodynamic radius and is the radius of the equivalent sphere calculated from the molecular weight;  is the frictional ratio.
Does dimeric IRF induce DNA distortion upon binding?
Dimeric IRF-3 5D can be regarded as a single kinetic unit containing two DNA-binding sites that interacts with the two binding sites on the 26-bp DNA to form a complex that is also a single kinetic unit. One could expect therefore that the Gibbs energy of binding dimeric IRF-3 5D to the 26-bp DNA will be twice that of binding to the single site 13-bp DNA, i.e. −33 × 2 kJ/mol = –66 kJ/mol. However, this value substantially exceeds the observed Gibbs energy of binding the 5D dimer to 26-bp DNA, –46 kJ/mol (Table 3). This difference cannot be explained by the difference in the number of kinetic units which are fixed in these two cases since the translational entropy factor is known to be small, TΔStr = (5 ± 4) kJ/mol (20).
A possible reason for the DNA-binding energy of dimeric IRF-3 being less than twice the monomeric could be the work needed to distort either the double-site DNA or the IRF dimer structure upon binding. The PRDIII- and PRDI-binding sites are not on the same face of the DNA (Figure 2b): the centers of two sites are separated by 13 bp and, assuming a 36° twist per base pair, the total twist between them is ∼460° – 360°= 100°. It is notable that the PRDIII- and PRDI-binding sites are separated by the spacer -GGGAG- (Figure 2), which might accommodate the deformation needed to engage the two sites on the dimer. One could argue that binding of dimeric IRF-3 to its two ‘twisted’ sites would not require work because the DNA-binding domains are connected with their dimerization domains by the long linker (Figure 1), and therefore both NTDs could approach the recognition sites on the twisted faces of the DNA without its distortion. However, as shown by the light scattering data, in dimerized IRF-3 the C-terminal domain keeps the DNA-binding NTD on a very short leash. Thus, the binding of dimeric IRF-3 to the 26-bp DNA containing PRDI- and PRDIII-binding sites must result either in DNA distortion or distortion of the interdomain linker.
Similar situations of homo-dimeric DBDs binding to DNA containing two binding sites have been observed previously: interaction of the λ-Cro dimer with two major groove DNA sites separated by a 3 bp spacer (-GCG-) induces a DNA bend of ∼40° (21) and in the DNA complex of the papilloma virus E2 homo-dimer with DNA containing recognition sites separated by 4 bp, a bend of 43° is induced (22–24). In both these complexes, a ‘recognition’ helix from each subunit binds into the major groove and the bending is towards the protein, resulting in significant compression of the minor groove, which might be energetically very expensive. A feature of these two cases is that the two DNA recognition sites are palindromic, a situation typical for homo-dimer–DNA interactions. In contrast, the two IRF-3 recognition sites could be described as inexact tandem repeats, suggesting that considerably more distortion of the DNA must occur than in the E2 and λ-Cro complexes: this might be principal basis of the free energy deficit observed in the present study.
CONCLUSION
The main conclusion of this study is that dimerization of IRF-3, caused by its phosphorylation, is the sole reason for the increased ability of this transcription factor to bind its target DNA in the IFN-β enhanceosome that contains the tandem PRDIII–PRDI-binding sites. Binding of this dimeric protein to the double-site DNA must induce considerable distortion of the DNA and possibly the linker region connecting the two domains of IRF-3.
ACKNOWLEDGEMENTS
The authors thank Dr Escalante for the expression clone and purification protocol for IRF−3 DBD and Dr Hiscott for the plasmid encoding full-length wild-type IRF-3. We are also grateful to Dr Crane-Robinson for critical discussions. The financial support of the Johns Hopkins University is gratefully acknowledged. Funding to pay the Open Access publication charges for this article was provided by NSF grant # 0519381.
REFERENCES
- 1.Mamane Y, Heylbroeck C, Genin P, Algarte M, Servant MJ, LePage C, DeLuca C, Kwon H, Lin R, Hiscott J. Interferon regulatory factors: the next generation. Gene. 1999;237:1–14. doi: 10.1016/s0378-1119(99)00262-0. [DOI] [PubMed] [Google Scholar]
- 2.Taniguchi T, Ogasawara K, Takaoka A, Tanaka N. IRF family of transcription factors as regulators of host defense. Annu. Rev. Immunol. 2001;19:623–655. doi: 10.1146/annurev.immunol.19.1.623. [DOI] [PubMed] [Google Scholar]
- 3.Wathelet MG, Lin CH, Parekh BS, Ronco LV, Howley PM, Maniatis T. Virus infection induces the assembly of coordinately activated transcription factors on the IFN-beta enhancer in vivo. Mol. Cell. 1998;1:507–518. doi: 10.1016/s1097-2765(00)80051-9. [DOI] [PubMed] [Google Scholar]
- 4.Escalante CR, Yie J, Thanos D, Aggarwal AK. Structure of IRF-1 with bound DNA reveals determinants of interferon regulation. Nature. 1998;391:103–106. doi: 10.1038/34224. [DOI] [PubMed] [Google Scholar]
- 5.Fujii Y, Shimizu T, Kusumoto M, Kyogoku Y, Taniguchi T, Hakoshima T. Crystal structure of an IRF-DNA complex reveals novel DNA recognition and cooperative binding to a tandem repeat of core sequences. EMBO J. 1999;18:5028–5041. doi: 10.1093/emboj/18.18.5028. [DOI] [PMC free article] [PubMed] [Google Scholar]
- 6.Furui J, Uegaki K, Yamazaki T, Shirakawa M, Swindells MB, Harada H, Taniguchi T, Kyogoku Y. Solution structure of the IRF-2 DNA-binding domain: a novel subgroup of the winged helix-turn-helix family. Structure. 1998;6:491–500. doi: 10.1016/s0969-2126(98)00050-1. [DOI] [PubMed] [Google Scholar]
- 7.Panne D, Maniatis T, Harrison SC. Crystal structure of ATF-2/c-Jun and IRF-3 bound to the interferon-beta enhancer. EMBO J. 2004;23:4384–4393. doi: 10.1038/sj.emboj.7600453. [DOI] [PMC free article] [PubMed] [Google Scholar]
- 8.Qin BY, Liu C, Lam SS, Srinath H, Delston R, Correia JJ, Derynck R, Lin K. Crystal structure of IRF-3 reveals mechanism of autoinhibition and virus-induced phosphoactivation. Nat. Struct. Biol. 2003;10:913–921. doi: 10.1038/nsb1002. [DOI] [PubMed] [Google Scholar]
- 9.Takahasi K, Suzuki NN, Horiuchi M, Mori M, Suhara W, Okabe Y, Fukuhara Y, Terasawa H, Akira S, et al. X-ray crystal structure of IRF-3 and its functional implications. Nat. Struct. Biol. 2003;10:922–927. doi: 10.1038/nsb1001. [DOI] [PubMed] [Google Scholar]
- 10.Yoneyama M, Suhara W, Fukuhara Y, Fukuda M, Nishida E, Fujita T. Direct triggering of the type I interferon system by virus infection: activation of a transcription factor complex containing IRF-3 and CBP/p300. EMBO J. 1998;17:1087–1095. doi: 10.1093/emboj/17.4.1087. [DOI] [PMC free article] [PubMed] [Google Scholar]
- 11.Lin R, Heylbroeck C, Pitha PM, Hiscott J. Virus-dependent phosphorylation of the IRF-3 transcription factor regulates nuclear translocation, transactivation potential, and proteasome-mediated degradation. Mol. Cell. Biol. 1998;18:2986–2996. doi: 10.1128/mcb.18.5.2986. [DOI] [PMC free article] [PubMed] [Google Scholar]
- 12.Lin R, Mamane Y, Hiscott J. Structural and functional analysis of interferon regulatory factor 3: localization of the transactivation and autoinhibitory domains. Mol. Cell. Biol. 1999;19:2465–2474. doi: 10.1128/mcb.19.4.2465. [DOI] [PMC free article] [PubMed] [Google Scholar]
- 13.Servant MJ, Grandvaux N, Tenoever BR, Duguay D, Lin R, Hiscott J. Identification of the minimal phosphoacceptor site required for in vivo activation of interferon regulatory factor 3 in response to virus and double-stranded RNA. J. Biol. Chem. 2003;278:9441–9447. doi: 10.1074/jbc.M209851200. [DOI] [PubMed] [Google Scholar]
- 14.Escalante CR, Yie J, Thanos D, Aggarwal AK. Expression, purification, and co-crystallization of IRF-I bound to the interferon-beta element PRDI. FEBS Lett. 1997;414:219–220. doi: 10.1016/s0014-5793(97)00996-4. [DOI] [PubMed] [Google Scholar]
- 15.Hargreaves VV, Makeyeva EN, Dragan AI, Privalov PL. Stability and DNA binding ability of the DNA binding domains of interferon regulatory factors 1 and 3. Biochemistry. 2005;44:14202–14209. doi: 10.1021/bi051115o. [DOI] [PubMed] [Google Scholar]
- 16.Dragan AI, Klass J, Read C, Churchill ME, Crane-Robinson C, Privalov PL. DNA binding of a non-sequence-specific HMG-D protein is entropy driven with a substantial non-electrostatic contribution. J. Mol. Biol. 2003;331:795–813. doi: 10.1016/s0022-2836(03)00785-x. [DOI] [PubMed] [Google Scholar]
- 17.Pace CN, Laurents DV, Thomson JA. pH dependence of the urea and guanidine hydrochloride denaturation of ribonuclease A and ribonuclease T1. Biochemistry. 1990;29:2564–2572. doi: 10.1021/bi00462a019. [DOI] [PubMed] [Google Scholar]
- 18.Makhatadze GI, Privalov PL. Protein interactions with urea and guanidinium chloride. A calorimetric study. J. Mol. Biol. 1992;226:491–505. doi: 10.1016/0022-2836(92)90963-k. [DOI] [PubMed] [Google Scholar]
- 19.Myers JK, Pace CN, Scholtz JM. Denaturant m values and heat capacity changes: relation to changes in accessible surface areas of protein unfolding. Protein Sci. 1995;4:2138–2148. doi: 10.1002/pro.5560041020. [DOI] [PMC free article] [PubMed] [Google Scholar]
- 20.Tamura A, Privalov PL. The entropy cost of protein association. J. Mol. Biol. 1997;273:1048–1060. doi: 10.1006/jmbi.1997.1368. [DOI] [PubMed] [Google Scholar]
- 21.Albright RA, Matthews BW. Crystal structure of lambda-Cro bound to a consensus operator at 3.0 Å resolution. J. Mol. Biol. 1998;280:137–151. doi: 10.1006/jmbi.1998.1848. [DOI] [PubMed] [Google Scholar]
- 22.Hegde RS, Grossman SR, Laimins LA, Sigler PB. Crystal structure at 1.7 Å of the bovine papillomavirus-1 E2 DNA-binding domain bound to its DNA target. Nature. 1992;359:505–512. doi: 10.1038/359505a0. [DOI] [PubMed] [Google Scholar]
- 23.Hegde RS, Wang AF, Kim SS, Schapira M. Subunit rearrangement accompanies sequence-specific DNA binding by the bovine papillomavirus-1 E2 protein. J. Mol. Biol. 1998;276:797–808. doi: 10.1006/jmbi.1997.1587. [DOI] [PubMed] [Google Scholar]
- 24.Hines CS, Meghoo C, Shetty S, Biburger M, Brenowitz M, Hegde RS. DNA structure and flexibility in the sequence-specific binding of papillomavirus E2 proteins. J. Mol. Biol. 1998;276:809–818. doi: 10.1006/jmbi.1997.1578. [DOI] [PubMed] [Google Scholar]