

Abstract
The cytotoxic effects of thiopurine drugs are mostly exerted through the formation of thioguanine nucleotide and its subsequent incorporation into DNA. The 6-thioguanine (6-TG) in DNA can be converted to S6-methylthio-2-aminopurine (2-AP-6-SCH3) and 2-aminopurine-6-sulfonic acid (2-AP-6-SO3H) upon reaction with S-adenosyl-L-methionine and irradiation with UVA light, respectively. Here we prepared oligodeoxynucleotides (ODNs) harboring a 6-TG, 2-AP-6-SCH3 or 2-AP-6-SO3H at a defined site and examined, by using LC-MS/MS, the in vitro replication of these substrates with yeast polymerase η and Klenow fragment (KF−). Our results revealed that 2-AP-6-SCH3 could be bypassed by KF−, with significant misincorporation of thymine opposite the lesion. The 2-AP-6-SO3H, however, blocked markedly the nucleotide insertion by KF−. Yeast pol η could bypass all three modified nucleosides; although dCMP was inserted preferentially, we found substantial misincorporation of dTMP and dAMP opposite 2-AP-6-SCH3 and 2-AP-6-SO3H, respectively. Moreover, both KF− and yeast pol η induced a considerable amount of -2 frameshift products from the replication of 2-AP-6-SCH3- and 2-AP-6-SO3H-bearing substrates. Our results also underscored the importance of measuring the relative ionization efficiencies of replication products in the accurate quantification of these products by LC-MS/MS. Moreover, thermodynamic studies revealed that 2-AP-6-SCH3 and 2-AP-6-SO3H could cause more destabilization to duplex DNA than 6-TG. Taken together, the results from this study shed important new light on the biological implications of the two metabolites of 6-TG.
INTRODUCTION
Thiopurine drugs, 6-thioguanine (6-TG), 6-mercaptopurine and its prodrug azathioprine, are common therapeutic agents for the treatment of acute leukemia, inflammatory bowl disease, autoimmune hepatitis and other pathological conditions (1–4). The primary activation pathway of the thiopurine drugs is through the formation of thioguanine nucleotide (TGN) and its subsequent incorporation into DNA (1,5). Although extensive studies on 6-TG metabolism have been carried out (2,6), the biochemical mechanisms for its cytotoxicity remain largely unclear, partially because of the lack of a strong mutagenic effect of 6-TG (7,8). On the other hand, further transformation of 6-TG in DNA might be involved in the cytotoxicity of the thiopurine drugs. In this regard, 6-TG in DNA can be methylated by S-adenosyl-L-methionine (S-AdoMet) to give S6-methylthio-2-aminopurine (2-AP-6-SCH3, Scheme 1) (9). In addition, 6-TG in DNA can be oxidized to 2-aminopurine-6-sulfonic acid (2-AP-6-SO3H, Scheme 1) upon UVA irradiation (10–12).
Scheme 1.

The formation of 2-AP-6-SCH3 and 2-AP-6-SO3H.
Both metabolites of 6-TG may miscode during DNA replication (9,10,12). In this respect, it was found that 2-AP-6-SCH3 could block slightly the replication by 3′-5′-Exonuclease-free Klenow fragment (KF−) (9), and, while the primer extension experiments were carried out in the presence of dCTP or dTTP alone, the insertion of dTMP opposite the lesion by KF− was found to be nearly as efficient as the incorporation of dCMP (9). In addition, 2-AP-6-SO3H can be bypassed by a Y-family DNA polymerase, human pol η (10); on the other hand, a very recent study revealed that this lesion blocked DNA synthesis by KF− (12).
The NMR structural data and thermodynamic studies suggested that the replacement of a guanine with a 6-TG perturbs slightly the normal helical form of DNA (13–16), where the sulfur atom in 6-TG exists in keto form and assumes weakened Watson–Crick hydrogen bonding with the opposing cytosine. However, the other two important metabolites of 6-TG, namely, 2-AP-6-SCH3 and 2-AP-6-SO3H, have not been investigated thoroughly for their effects on duplex stability.
We set out to examine, in detail, how the two modified thionucleobases affect DNA replication and duplex stability by using structurally defined substrates. In this context, the steady-state kinetics assay has been commonly used for determining the cytotoxic and mutagenic properties of DNA lesions in vitro (17). In these experiments, the efficiency and fidelity of nucleotide incorporation are determined by measuring the rates for the incorporation of one type of nucleotide at a time and fitting the rate data with the Michaelis–Menten equation (17). Recently, Guengerich et al. (18,19) introduced an elegant LC-MS/MS method to investigate the multiple bypass mechanisms of polymerases toward DNA lesions in vitro. This method provides an efficient way for determining the identities and distributions of various replication products resulting from the polymerase reaction in the presence of all four dNTPs, which, relative to the conditions used for steady-state kinetic measurements, mimics better the replication conditions in vivo.
The previous LC-MS/MS quantification of replication products was based on the relative ion abundances of the composing oligodeoxynucleotides (ODNs) observed in ESI-MS under an assumption that different ODNs, regardless of their lengths and nucleobase compositions, have the same ionization efficiency (18,19). This assumption, however, may not be valid owing to the fact that the hydrophobicity and free energy of solvation for different ODNs can vary, which can affect their signal intensities in ESI mass spectrum (20). Thus, accurate LC-MS/MS quantification of the replication products requires the consideration of the different ionization efficiencies for different ODNs.
In the present study, we prepared ODNs containing a 6-TG, 2-AP-6-SCH3 or 2-AP-6-SO3H at a defined site and carried out the in vitro replication studies by using an improved LC-MS/MS method, which takes into account the ionization efficiency differences of ODNs. We also measured the thermodynamic parameters for the formation of duplexes bearing a 6-TG and its oxidized/methylated derivatives. The results from this study provide insights toward understanding the biological implications of 6-TG and its major metabolites.
MATERIALS AND METHODS
Chemicals and enzymes
The phosphoramidite building block of 6-thio-2′-deoxyguanosine was obtained from Glen Research (Sterling, VA, USA). Unmodified ODNs used in this study were purchased from Integrated DNA Technologies (Coralville, IA, USA). [γ-32P]ATP was obtained from Amersham Biosciences Co. (Piscataway, NJ, USA). All other chemicals unless otherwise noted were obtained from Sigma-Aldrich (St Louis, MO, USA). 3′-5′-Exonuclease-free KF− and uracil-DNA glycosylase (UDG) were from New England Biolabs (Ipswich, WA, USA). The C-terminal catalytic core of yeast Saccharomyces cerevisiae pol η, which was an N-terminally His6-tagged fusion protein (21), was kindly provided by Prof. John-Stephen A. Taylor at Washington University in St Louis.
Preparation of ODN substrates containing a 6-thioguanine or its metabolites
We first synthesized 6-TG-bearing ODNs by using phosphoramidite chemistry. After solid-phase synthesis, the controlled pore-glass (CPG) support was treated with 1.0 M DBU (1,8-Diazabicyclo[5.4.0]undec-7-ene) in anhydrous acetonitrile at room temperature for 5 h to remove the cyanoethyl protecting group for the thionucleoside, followed by treatment with 50 mM NaSH in concentrated NH4OH solution at room temperature for 24 h to complete the deprotection. The synthesized d(ATGGCSGCGCTAT) (‘SG’ represents 6-TG) was purified by HPLC and its identity was confirmed by ESI-MS and tandem MS (MS/MS).
The 2-AP-6-SCH3-containing substrates were prepared following previously published procedures (22). Briefly, d(ATGGCSGCGCTAT) (20 nmol) was treated with 10% CH3I/CH3CN (v/v) in 0.05 M phosphate buffer (pH 8.5) at room temperature overnight, and the methylation reaction was quenched by addition of HCl until the solution pH reached 7.0. The reaction mixture was separated by HPLC on a 4.6 × 250 mm Apollo C18 reverse-phase column (5 μm in particle size and 300 Å in pore size, Alltech Associates Inc., Deerfield, IL, USA). The composition of buffer A was 50 mM TEAA (pH 6.5), and buffer B contained 50 mM TEAA and 30% acetonitrile (v/v). The gradient program for the mobile phase was: 0 min, 0% B; 5 min, 20% B; 45 min, 50% B; 50 min, 100% B; 55 min, 0% B. The flow rate was 0.8 ml/min, and a UV detector was set at 260 nm to monitor the effluents. The identity of the methylated ODN d(ATGGCMeSGCGCTAT) (‘MeSG’ designates 2-AP-6-SCH3) was confirmed by ESI-MS and MS/MS.
Selective oxidation of 6-TG in ODNs was performed according to previously published procedures for the oxidation of 2-AP-6-SCH3-bearing ODNs (22). In this respect, d(ATGGCSGCGCTAT) (50 nmol) was incubated with 50-μl of 3.56 mM magnesium monoperoxyphthalate (MMPP) at room temperature for 1 h. The oxidation mixture was separated by HPLC with the conditions described above. The identity and purity of 2-AP-6-SO3H -containing ODN were confirmed by ESI-MS and the sequence of the ODN was verified by MS/MS. The presence of 2-AP-6-SO3H in the resulting ODN was also supported by its characteristic fluorescence spectrum.
To further confirm the structure of the oxidation product of 6-TG, the 2-AP-6-SO3H-containing dodecamer (1 nmol) was digested by four enzymes, i.e. nuclease P1, calf spleen phosphodiesterase, snake venom phosphodiesterase and alkaline phosphatase, to give mononucleosides (23,24). The nucleoside mixture was separated by using a 0.5 × 150 mm Zorbax SB-C18 column (particle size, 5 μm, Agilent Technologies, Palo Alto, CA, USA). The HPLC gradient was 0–15% acetonitrile in 20 mM ammonium acetate in 60 min, and the flow rate was 6.0 μl/min, which was delivered by using an Agilent 1100 capillary HPLC pump (Agilent Technologies).
The effluent from the LC column was coupled directly to an LTQ Linear ion-trap mass spectrometer (Thermo Electro Inc., San Jose, CA, USA). The spray voltage was 4.0 kV, and the capillary temperature was maintained at 225°C. The mass spectrometer was set up to monitor the fragmentation of the [M–H]− ion (m/z 330) of 2-AP-6-SO3H 2′-deoxyribonucleoside, i.e. d(2-AP-6-SO3H). Standard d(2-AP-6-SO3H) was also injected in a separate LC-MS/MS experiment with the identical experimental setup as that for the digestion sample.
For the modified ODNs used in replication studies, a 20-mer ODN, d(ATGGCSGCGCTATGATCCTAG), was first synthesized. This ODN was then selectively methylated or oxidized by using the same experimental protocols as described above for the dodecameric substrates.
Primer extension assays by gel electrophoresis
For primer extension assays, the 20-mer lesion-containing or unmodified ODN (20 nM) was annealed with a 5′-32P-labeled 15-mer primer, d(GCTAGGATCATAGCG) (10 nM) and the resulting ODN solution was incubated with 100 μM of each of the four dNTPs and a DNA polymerase (KF− or yeast pol η) in a buffer containing 10 mM Tris–HCl (pH 7.5), 5 mM MgCl2 and 7.5 mM DTT. The reactions were continued at 37°C for 60 min and then quenched by adding a 2-volume excess of formamide gel-loading buffer [80% formamide, 10 mM EDTA (pH 8.0), 1 mg/ml xylene cyanol and 1 mg/ml bromophenol blue]. The replication products were resolved on 20% (1:19) cross-linked denaturing polyacrylamide gels containing 8 M urea. Gel images were obtained by using a Typhoon 9410 Variable Mode Imager (Amersham Biosciences Co.).
Primer extension assays by LC-MS/MS
We replaced the primer used in gel electrophoresis with an unlabeled, uracil-containing ODN, d(GCTAGGATCAUAGCG), which facilitated the production, after UDG treatment, of short ODNs containing the extended portion of the primer (Scheme 2). These short ODNs were readily amenable to sequencing analysis by MS/MS (18). The lesion-containing template and primer (100 pmol each) were annealed and incubated at 37°C in the presence of 1 mM dNTPs and a buffer containing 10 mM Tris–HCl (pH 7.5), 5 mM MgCl2 and 7.5 mM DTT. KF− (2 U) or yeast pol η (1.6 μg) was added and the reaction was continued overnight. The replication reaction was stopped by heating to 65°C for 10 min, and the resultant mixture was then incubated with UDG (4 U) in a buffer containing 20 mM Tris–HCl (pH 8.0), 1 mM DTT and 1 mM EDTA at 37°C for 5 h. The UDG cleavage reaction was quenched by adding piperidine until its final concentration reached 0.25 M. The resulting mixture was then incubated at 60°C for 1 h, the proteins in the mixtures were removed by chloroform extraction, and the aqueous layer was dried by using a Savant Speed-Vac (Thermo Savant Inc., Holbrook, NY, USA). The dried residue was redissolved in 100-μl H2O for the following LC-MS/MS analysis (A 25-μl aliquot was injected in each run).
Scheme 2.

Experimental procedures for the LC-MS/MS analysis of replication products.
The conditions for LC-MS/MS analysis were similar as described above. The gradient for the HPLC elution was as follows: 0–5 min, 0–20% methanol in 400 mM 1,1,1,3,3,3-hexafluoro-2-propanol (HFIP, pH was adjusted to 7.0 by addition of triethylamine); 5–40 min, 20–50% methanol in 400 mM HFIP. The capillary temperature was maintained at 300°C to minimize the formation of the HFIP adducts of ODNs. MS/MS data were acquired over an m/z range of 500–1500.
To identify the replication products, the mass spectrometer was first operated in data-dependent scan mode, where the four most abundant ions found in MS were chosen for fragmentation in MS/MS. The MS/MS data were then manually inspected to assign the fragment ions and determine the sequences of the ODNs. In this respect, some tandem mass spectra were not of high-enough quality for complete sequence assignments. These spectra were recorded again by monitoring specifically the fragmentation of the precursor ions. After identifying the ODNs from the replication mixture, the quantification of replication products was carried out by operating the instrument in specific-ion monitoring mode, where the precursor ions for the extended fragments of the primer strand were chosen for fragmentation. The specific-ion monitoring mode offered enhanced signal-to-noise ratio for the measurement of replication products.
To correct for the effect of varied ionization efficiencies of different ODNs on quantification, we introduced a relative-ratio method. To this end, we first obtained the standard phosphorylated ODNs by treating 20 nmol unphosphorylated ODNs with 20 U of T4 polynucleotide kinase (New England Biolabs) in a buffer containing 50 mM Tris–HCl (pH 7.5), 10 mM MgCl2, 1 mM ATP, 10 mM DTT and 25 μg/ml BSA at 37°C for 1 h. Immediately after the reaction, the reaction mixture was extracted with chloroform to remove the enzymes. The aqueous layer was dried, redissolved in water, and subjected to HPLC separation, where the gradient program was 0–40% methanol in 50 mM phosphate buffer (pH 6.8) in 60 min. The phosphate buffer, instead of TEAA buffer, was employed to avoid the loss of terminal phosphate group from the 5′-phosphorylated ODNs.
A mixture composed of 5 pmol each of the standard phosphorylated ODN substrates, which were identified in each set of replication mixture (shown in Tables 1 and 2), was dispersed in the same buffer as that used in the extension assays and injected for LC-MS and MS/MS analyses with the same experimental setup as that used for the analysis of the replication mixture. The integrated area of peak, which was found in the total-ion chromatogram (TIC) plotted for the production of the most abundant deprotonated molecular ion for each standard ODN, or in the selected-ion chromatogram (SIC) plotted for the formation of three abundant fragment ions of the ODN, was normalized against that of one specific ODN. The corresponding normalized ratios for the replication samples were also determined and combined with the ratios obtained from the analyses of standards to calculate the percentage of each product in the replication mixture.
Table 1.
Percentages of the replication products in the reaction with Klenow fragment
| Name | Sequence | 6-TG | 2-AP-6-SCH3 | 2-AP-6-SO3H |
|---|---|---|---|---|
| 4mer | d(pAGCG) | 2.9 ± 0.4 | 8.4 ± 0.6 | 32 ± 4 |
| 5C | d(pAGCGC) | 0.7 ± 0.0 | 1.6 ± 0.7 | 21.4 ± 0.9 |
| 5T | d(pAGCGT) | 0.2 ± 0.0 | 1.1 ± 0.0 | 4.5 ± 0.0 |
| 5A | d(pAGCGA) | 0.6 ± 0.0 | 2.4 ± 0.1 | 6.0 ± 0.7 |
| 6C | d(pAGCGCC) | ND | ND | 14 ± 2 |
| 8C | d(pAGCGCCAT) | ND | 4.8 ± 0.3 | 5.5 ± 0.2 |
| 11C | d(pAGCGCGCCATA) | 19.3 ± 0.2 | 12.6 ± 0.8 | 17 ± 2 |
| 11T | d(pAGCGTGCCATA) | 3.2 ± 0.0 | 35 ± 2 | ND |
| 11A | d(pAGCGAGCCATA) | 1.5 ± 0.0 | 0.9 ± 0.0 | 0.8 ± 0.0 |
| 11G | d(pAGCGGGCCATA) | ND | 5.2 ± 0.4 | ND |
| 12C | d(pAGCGCGCCATAT) | 45 ± 7 | 6.7 ± 0.0 | ND |
| 12T | d(pAGCGTGCCATAT) | 4.2 ± 0.5 | 18 ± 1 | ND |
| 12A | d(pAGCGAGCCATAT) | 12 ± 2 | 3.7 ± 0.0 | ND |
| 13C | d(pAGCGCGCCATATA) | 8.2 ± 0.1 | 0.4 ± 0.0 | ND |
| 13T | d(pAGCGTGCCATATA) | 0.5 ± 0.0 | ND | ND |
| 13A | d(pAGCGAGCCATATA) | 1.3 ± 0.0 | ND | ND |
The template is d(ATGGCXCGCTATGATCCTAG), where ‘X’ represents 6-TG, 2-AP-6-SCH3 or 2-AP-SO3H. For all the full-length products, the nucleosides incorporated opposite the lesion are highlighted in bold. ND, not detectable.
Table 2.
Percentages of the replication products in the reaction with yeast pol η
| Name | Sequences | 6-TG | 2-AP-6-SCH3 | 2-AP-6-SO3H |
|---|---|---|---|---|
| 4mer | d(pAGCG) | 11 ± 2 | 18 ± 2 | 22 ± 2 |
| 5C | d(pAGCGC) | 0.4 ± 0.0 | ND | 1.3 ± 0.0 |
| 5A | d(pAGCGA) | ND | ND | 0.2 ± 0.0 |
| 5G | d(pAGCGG) | ND | ND | 0.2 ± 0.0 |
| 6C | d(pAGCGCC) | 0.4 ± 0.0 | ND | 2.7 ± 0.0 |
| 6A | d(pAGCGAC) | ND | ND | 0.6 ± 0.0 |
| 6G | d(pAGCGGC) | 1.3 ± 0.3 | ND | 0.3 ± 0.0 |
| 8C | d(pAGCGCCAT) | 4.1 ± 0.7 | 5.0 ± 0.3 | 29 ± 3 |
| 8A | d(pAGCGACAT) | ND | ND | 6.9 ± 0.7 |
| 10C | d(pAGCGCGCCAT) | 39 ± 6 | 39 ± 9 | 20 ± 2 |
| 10T | d(pAGCGTGCCAT) | 3.4 ± 0.6 | 13 ± 3 | ND |
| 10A | d(pAGCGAGCCAT) | 1.8 ± 0.3 | 5 ± 1 | 4.0 ± 0.4 |
| 10G | d(pAGCGGGCCAT) | ND | ND | 0.7 ± 0.0 |
| 11C | d(pAGCGCGCCATA) | 8.6 ± 0.5 | 3.7 ± 0.8 | 1.6 ± 0.0 |
| 11T | d(pAGCGTGCCATA) | 1.0 ± 0.0 | 1.4 ± 0.0 | 0.8 ± 0.0 |
| 11A | d(pAGCGAGCCATA) | 0.5 ± 0.0 | ND | ND |
| 11C_T | d(pAGCGCGCCATT) | 26 ± 4 | 9.3 ± 0.2 | 6.9 ± 0.6 |
| 11T_T | d(pAGCGTGCCATT) | 0.8 ± 0.0 | 2.6 ± 0.0 | 0.4 ± 0.0 |
| 11A_T | d(pAGCGAGCCATT) | 2.4 ± 0.4 | 3.0 ± 0.7 | 1.8 ± 0.1 |
The template is d(ATGGCXCGCTATGATCCTAG), where ‘X’ represents 6-TG, 2-AP-6-SCH3 or 2-AP-SO3H. For all the full-length products, the nucleosides incorporated opposite the lesion are highlighted in bold. ND, not detectable.
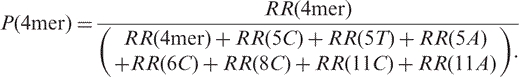
Here we use the KF−-mediated reaction of the 2-AP-6-SO3H-bearing substrate as an example to illustrate how the method works. In this reaction mixture, we found eight replication products, and the identities of these substrates are listed in Table 1. To determine the percentage of the un-extended primer (4mer) in the reaction mixture, we first determined the ratio of the peak area for the 4mer over that for the 11C found in the SICs for the analysis of the mixture of standard ODNs, i.e. R° (4mer) (the SICs are shown in Figure S8):
We then calculated the corresponding ratio for the analysis of the replication mixture:
The A° and A represented the peak areas found in SICs for the analysis of standards and replication samples, respectively. The ratio determined for the replication mixture was then normalized against that determined for the standards, which gave normalized ratio for the 4-mer, i.e. RR(4mer):
The normalized ratio was then calculated for each identified replication product, and the percentage of 4mer in the replication mixture was calculated from the ratio of the normalized ratio for the 4mer over the sum of the normalized ratios for all the replication products by using the following equation:
 |
Other replication products present in this or other polymerase-catalyzed reaction mixtures were calculated in the same fashion.
Measurement of melting curves
The above dodecameric ODNs containing a guanine, 6-TG or its modified derivative were annealed with another 12-mer ODN to form the duplex. The specific nucleotide sequences were:
Strand 1 5′- ATGGCXCGCTAT -3′
Strand 2 3′- TACCGCGCGATA -5′,
where ‘X ’ represents an unmodified guanine, 6-TG, or its methylated/oxidized derivative.
The UV absorbance-versus-temperature profiles were recorded on a Varian Cary 500 spectrophotometer (Varian Inc., Palo Alto, CA, USA), and the ODNs were dispersed in a 1.2-ml solution containing 10 mM phosphate (pH 7.0), 100 mM NaCl and 0.1 mM EDTA at a varying total ODN concentration (Ct) of 1.0, 1.8, 3.2, 5.6, or 10 μM. The absorbance was recorded in the reverse and forward directions for a temperature range of 80–10°C at a rate of 1°C/min, and the melting temperature (Tm) value was obtained by the derivative method (25).
The thermodynamic parameters were obtained from the van't Hoff plot (25), where the reciprocal of Tm was plotted against ln Ct/4:
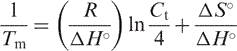 |
and
in which R is the universal gas constant (=1.987 cal mol−1 K−1). The error limits for ▵G°, ▵H° and ▵S° derived from fitted parameters were calculated by using previously the described equations (26).
RESULTS
Preparation of ODNs containing a 6-thioguanine or its modification products
We employed traditional phosphoramidite chemistry and synthesized two 6-TG-containing ODNs, d(ATGGCSGCGCTAT) and d(ATGGCSGCGCTATGATCCTAG). The identities of these two substrates were confirmed by ESI-MS and MS/MS analyses (Figures S1 and S4).
As reported previously (22), 6-TG in ODNs can be selectively methylated to 2-AP-6-SCH3 by treatment with methyl iodide (CH3I) in a phosphate buffer (pH 8.5, Scheme 1). In addition, 2-AP-6-SCH3 in ODNs can be oxidized selectively to 2-AP-6-SO2CH3 upon treatment with MMPP (magnesium monoperoxyphthalate) (22). We employed similar procedures and isolated the desired 2-AP-6-SCH3- and 2-AP-6-SO3H-containing ODNs from the reaction mixtures by HPLC (Scheme 1 and Figure S2). The yields for the selective formation of these two products, as estimated from peak areas in the HPLC traces, were ∼45 and 75%, respectively (Figure S2). The molecular masses of the 2-AP-6-SCH3- and 2-AP-6-SO3H-containing dodecameric ODNs were measured by ESI-MS to be 3690.9 and 3724.8 Da, respectively, which are in accordance with the corresponding calculated average masses of 3691.3 and 3725.0 Da, respectively. Moreover, the sites of the lesions were confirmed by the product-ion spectra (MS/MS) of the [M–3H]3− ions of these ODNs (Figure 1).
Figure 1.

Product-ion spectra of the ESI-produced [M–3H]3− ions of d(ATGGCSO3HGCGCTAT) (m/z 1240.6, a) and d(ATGGCMeSGCGCTAT) (m/z 1229.3, b), where ‘SO3HG’ and ‘MeSG’ represent 2-AP-6-SO3H and 2-AP-6-SCH3, respectively. Shown in the insets are the negative-ion ESI-MS for the two modified ODNs and schemes summarizing the observed fragment ions.
The 2-AP-6-SO3H-containing substrate was further examined by fluorescence spectroscopy and LC-MS/MS analysis of the enzyme-generated nucleosides of the ODN (see Materials and Methods). The oxidized ODN gave identical fluorescence spectrum (Figure S3) as the authentic d(2-AP-6-SO3H), which had an excitation maximum at 324 nm and an emission maximum at 410 nm (10). LC-MS/MS of the nucleoside mixture showed a fraction eluting at the same time (∼8 min) and exhibiting the same MS/MS fragmentation pattern as the standard d(2-AP-6-SO3H) (data not shown).
The same methylation and oxidation procedures were employed to obtain the 20-mer ODNs containing the two metabolites of 6-TG. The identities of the 20-mer substrates were again confirmed by ESI-MS and MS/MS (Figure S4).
In-vitro replication studies with KF− and yeast pol η by gel electrophoresis
We next examined how the presence of 6-TG or its oxidized/methylated derivative affects DNA replication by carrying out primer extension assays with a replicative polymerase, KF− and a Y-family DNA polymerase, yeast pol η. As depicted in Figure S5, 6-TG and 2-AP-6-SCH3 inhibited slightly the replication by KF−, whereas the presence of a 2-AP-6-SO3H inhibited KF−-mediated DNA replication to a greater extent. The latter result was consistent with what was reported by Zhang and coworkers (12). Yeast pol η, on the other hand, could bypass 6-TG and its modified derivatives to give full-length products.
LC-MS/MS analysis of in-vitro replication products
We further assessed the bypass and miscoding properties of 6-TG and its metabolites by LC-MS/MS following the previously described method (18,19) with some modifications. In this context, we adopted the HFIP buffer system, which was first reported by Hancock et al. (27) for the LC-ESI-MS/MS analysis of ODNs. It turned out that this buffer system resulted in high efficiency in both HPLC separation and electrospray ionization of ODNs with minimal cation adduction.
To illustrate this, we use the analysis of the yeast pol η-catalyzed primer extension products of the 2-AP-6-SCH3-containing substrate as an example. As shown in the TIC (Figure 2a), the lesion-bearing strand elutes at 29.5 min. After UDG cleavage and hot alkaline treatment, the 5′ portion of the primer is produced in two forms, namely, d(GCTAGGATCAp) and d(GCTAGGATCAXp) (‘X ’ represents an abasic site), eluting at 26.5 min and 26.0 min, respectively. The latter form results from the incomplete cleavage of the abasic site by hot piperidine treatment, which might be attributed to the relatively low temperature (i.e. 60°C) employed for the treatment. The 3′ portion of the primer strand, which carried the extension products and included 10C, 10T, 10A, 11C, 11T, 11C_T, 11T_T, 11A_T, elutes at 26.9 min (ESI-MS averaged from this retention time is shown in Figure 2b, and the sequences for the identified products are listed in Table 2). Other than these full-length products, we also found the un-extended primer (4mer) and a frame-shift product (8C), which elute at 20.8 min and 26.5 min, respectively. The identities of the above ODNs were determined from ESI-MS and MS/MS measurements. For instance, the MS/MS of several replication products, including a frameshift product, are shown in Figure S7, and the MS/MS for the [M–4H]4− ions of the 5′ segments of the primer are shown in Figure S6. The same LC-MS/MS method also allows us to identify the replication products from the other five in vitro replication reactions (the identified products are listed in Tables 1 and 2).
Figure 2.

(a) Total-ion chromatogram from the analysis of the yeast pol η-induced replication products that have been treated with UDG and hot piperidine. A 25-pmol replication mixture was injected for analysis. (b) ESI-MS averaged from the peak eluting at 26.9 min in part (a), where ‘*p’ designates the remanent of the 5′ portion of the primer.
To quantify accurately the relative amounts of these extension products, we first examined the relative ionization efficiencies of ODNs in negative-ion ESI-MS. To this end, we injected a mixture, which contained 5-pmol of each standard 5′-phosphorylated ODN in the same buffer as that used for extension assays, for LC-MS and MS/MS analyses. As depicted in Figure 3, the seventeen 5′-phosphorylated ODNs identified from the pol η-mediated replication mixture of the 2-AP-6-SO3H-bearing substrate indeed exhibit substantially different efficiencies in forming the most abundant molecular ions, revealing the importance of considering the varied ionization efficiencies of different ODNs in the LC-MS/MS quantification of replication products. In this respect, the relative ionization efficiencies were assessed by normalizing the total-ion current observed for the most abundant deprotonated molecular ion found for each ODN against that found for the [M–3H]3− ions of 10C, for the yeast pol η-mediated reaction, and 11C, for the KF−-catalyzed reaction (See Figure S8 for an example).
Figure 3.

Ratios of peak areas of individual ODNs to that of 10C in the mixture based on the SIC (solid bar), and based on TIC (open bar). All authentic ODNs were identified from the replication mixture of 2-AP-6-SO3H-containing substrates induced by yeast pol η. Error bars represent the standard deviations of results from three independent experiments. The top and bottom numbers listed above the bars are data obtained from SICs for three abundant fragment ions and based on TICs for the most abundant molecular ion, respectively.
In the viewpoint that MS/MS provides improved signal-to-noise ratio for measuring the relative amounts of different ODNs present in the replication mixture, we also examined the relative efficiencies for the formation of three abundant fragment ions, from the injection of an equimolar mixture (5 pmol each) of the 17 authentic ODNs as mentioned earlier. It turned out that the ratios obtained for most ODNs are similar to those found based on molecular ions, and the efficiencies for the formation of three abundant product ions were again markedly different for these ODNs (Figure 3). In this respect, t-test showed that, at 99.9% confidence level, the mean ratio obtained for 10A or 10G was significantly different from that determined for 4mer, 5C, 5G, 6C, 6A, 6G, 8A, 10A, 11C or 11T_T.
It is worth noting that two isomeric ODN products were found in the pol η-catalyzed replication mixture of all three thionucleoside-containing substrates (Table 2 and Figure S10), i.e. 11T or 11A_T, which exhibit very similar retention time. Therefore, the quantification of these two products has to rely on MS/MS. In this context, it is worth noting that the quantification of these two ODNs also necessitates the use of fragment ions with distinct m/z values for the two ODNs. In this case, we employed the [a6-G]2−, [a7-C]2− and [a8-C]2− ions, which have m/z values of 870.6, 1035.1 and 1179.7, respectively, for 11T and 875.1, 1039.7 and 1184.1, respectively, for 11A_T [Nomenclature for fragment ions follows that described by McLuckey et al. (28)].
By using the relative ratio method described in ‘Materials and Methods’ section, we quantified the percentages of individual ODNs in the reaction mixtures and summarized the results in Tables 1 and 2. Our results showed that KF− could bypass 6-TG efficiently, and the most abundant product was found to be the products with a dCMP being inserted opposite the 6-TG and with the blunt-end addition of a dA, d(AT) or d(ATA) (Table 1 and Figure S9d). Consistent with the results from the primer extension monitored by PAGE analysis, the 2-AP-6-SCH3-containing substrate can also be bypassed; however, the 2-AP-6-SCH3 induced much more nucleotide misincorporation than 6-TG. Among all the full-length products, dTMP (∼53%) is inserted opposite the 2-AP-6-SCH3 much more preferentially than dCMP (∼20%), followed by dAMP (∼5%) and dGMP (∼5%, Table 1 and Figure S9e). This result is significantly different from the similar efficiency of dCMP and dTMP incorporation in primer extension experiments where only dTTP or dCTP was present in the replication mixture (9).
The 2-AP-6-SO3H-bearing substrate blocked KF−-mediated primer extension more readily as represented by the formation of much smaller amount of the full-length products (a total of ∼18%, Table 1 and Figure S8). In contrast to what we found for the 2-AP-6-SCH3-containing substrate, KF− preferentially incorporates a dCMP opposite 2-AP-6-SO3H. Considering the full-length products formed from this reaction, the incorporation of dCMP and dAMP constitute 17% (11C, Table 1) and 0.8% (11A, Table 1), respectively, whereas the insertion of dTMP was barely detectable.
For the primer extension with yeast pol η, substrates containing 6-TG and its metabolites can all be bypassed with different levels of efficiencies, which is consistent with the results obtained from the above gel electrophoresis experiment. For all three lesions, the most abundant products carry the correct nucleotide (dCMP) opposite the lesion (Table 2, the SICs for monitoring the formation of replication products and a summary of the identities and percentages of those products are shown in Figure S9). Aside from the correct nucleotide incorporation, the insertions of dAMP and dTMP were also observed (Table 2). In this respect, if we only consider the full-length products, dCMP, dTMP and dAMP were inserted opposite 6-TG at frequencies of 74, 5.2 and 4.7%, respectively (Table 2), whereas these three nucleotides were incorporated opposite 2-AP-6-SCH3 at frequencies of 52, 17 and 8%, respectively (Table 2). The respective frequencies for the insertion of these three nucleotides opposite 2-AP-6-SO3H are 29, 1.2 and 5.8%. These results, therefore, demonstrated that 2-AP-6-SO3H also blocked pol η-mediated polymerization more effectively than 6-TG or 2-AP-6-SCH3 (Table 2). In keeping with our findings for the KF−-mediated reaction, pol η also misincorporated dTMP more frequently than dAMP opposite 2-AP-6-SCH3, whereas the wrong nucleotide dAMP was inserted opposite the 2-AP-6-SO3H with greater efficiency than the incorrect nucleotide dTMP.
It is worth mentioning that a single LC-MS/MS experiment facilitates us to gain insights into both the nucleotide incorporation opposite the lesion and the primer extension beyond the lesion site. In this context, our data demonstrated the presence of a significant amount of frame-shift products in the reaction mixture, particularly in the mixtures resulting from the replication of 2-AP-6-SO3H-harboring substrate induced by yeast pol η (6C, 6A, 6G, 8C and 8A, a total of ∼40%, Figure S9c) and KF− (6C and 8C, a total of ∼20%, Figure S8).
Thermodynamic properties of lesion-containing duplexes
To gain insights into the effects of 6-TG and its metabolites on duplex stability, we further determined the thermodynamic parameters for duplex formation by measuring the melting temperatures for the thionucleoside-containing duplex ODNs (see ‘Materials and Methods’ section and Figure S10). It turned out that the replacement of a guanine with a 6-TG resulted in the destabilization of the duplex by 2.4 kcal/mol in free energy at 37°C (Table 3). In addition, 2-AP-6-SCH3 and 2-AP-6-SO3H caused even more destabilization to duplex DNA, with ▵▵G being 4.2 and 4.3 kcal/mol, respectively (Table 3).
Table 3.
Thermodynamic parameters of duplex formation
| Duplex |  |
ΔH (kcal/mol) | ΔS (cal/mol K) | ΔG37°C (kcal/mol) |  |
|---|---|---|---|---|---|
| 5′-ATGGCXCGCTAT-3′ | |||||
| 3′-TACCGCGCGATA-5′ | |||||
| X = G | 60.9 ± 0.5 | −80 ± 5 | −210 ± 16 | −13.8 ± 0.3 | |
| X = 6-TG | 51.2 ± 0.6 | −77 ± 4 | −210 ± 14 | −11.4 ± 0.2 | 2.4 ± 0.4 |
| X = 2-AP-6-SCH3 | 43.8 ± 0.5 | −74.1 ± 0.6 | −208 ± 2 | −9.6 ± 0.0 | 4.2 ± 0.3 |
| X = 2-AP-6-SO3H | 43.8 ± 0.5 | −82 ± 2 | −230 ± 8 | −9.5 ± 0.0 | 4.3 ± 0.3 |
aCt = 10 μM.
b (lesion-containing duplex)—ΔG37°C (undamaged duplex).
DISCUSSION
The cytotoxicity of the thiopurine drugs involved mostly the formation of 6-TG nucleotide upon metabolic activation and its subsequent incorporation into DNA (2). In DNA, 6-TG can be methylated by S-AdoMet to form 2-AP-6-SCH3 (9) and converted to 2-AP-6-SO3H upon UVA irradiation (10). Both 2-AP-6-SCH3 and 2-AP-6-SO3H may affect DNA replication and/or repair, thereby exerting their cytotoxic and mutagenic effects in vivo (9,10).
In this article, we obtained pure ODNs containing a structurally defined 6-TG, 2-AP-6-SCH3, or 2-AP-6-SO3H at a specific site, and confirmed the identities of these ODNs by ESI-MS, MS/MS and, for the 2-AP-6-SO3H-bearing substrate, by fluorescence spectroscopy. In addition, the 2-AP-6-SO3H-containing ODN was digested by enzymes to mononucleosides, and LC-MS/MS analysis confirmed the presence of 2-AP-6-SO3H 2′-deoxyribonucleoside in the nucleoside mixture.
We then carried out the in vitro replication studies of 6-TG and its metabolites with KF− and yeast pol η. Consistent with previous studies (9,29), we found that 6-TG and 2-AP-6-SCH3 slightly blocked the replication by KF−, whereas 2-AP-6-SO3H blocked substantially the primer extension by KF−. All three thionucleosides, however, could be bypassed by yeast pol η with varying efficiencies.
The miscoding and polymerase stalling properties of DNA lesions are frequently assessed by the steady-state kinetics assay (17). Recently, LC-MS/MS, because of its high efficiency and its capability in offering sequence information for many ODNs in a single experiment, has been developed as a new tool to investigate the mutagenic and cytotoxic effects of DNA lesions in vitro (18). Different from the steady-state assay, the LC-MS/MS method can allow for the analysis of the replication products from the reactions with the mutual presence of all four dNTPs, instead of adding one type of dNTP at a time. It may better represent the real polymerization reaction conditions in vivo, thereby providing more accurate measurements. However, the LC-MS/MS analysis of extended ODNs in the replication mixture was somewhat limited because common HPLC mobile phases are not compatible with both the HPLC separation and the electrospray ionization of ODNs. Here we found that the HFIP buffer reported by Hancock et al. (27) allowed for the effective separation and efficient ionization of ODNs in the replication reaction mixture.
In this newly developed LC-MS/MS method, the quantitative analysis of individual ODNs in the reaction mixture is complicated by the different ionization efficiencies of the composing ODNs. In this article, we quantitatively assessed the ionization and detection efficiencies of different ODNs through the analysis of authentic compounds. Our results revealed that different ODNs could exhibit significant differences in the magnitude of signals produced in MS or MS/MS, which calls for the need of assessing the relative ionization efficiencies of different ODNs while LC-MS/MS is used for this type of analysis.
With the consideration of different ionization efficiencies of different replication products, our LC-MS/MS results revealed that dTMP is inserted opposite 2-AP-6-SCH3 with much greater efficiency (2.5-fold) than dCMP by KF−. The resulting 2-AP-6-SCH3/T base pair may trigger the DNA mismatch repair pathway (9). If not repaired efficiently, the lesion may lead to a high incidence of G→A transversion mutation. Our LC-MS/MS data also demonstrated that 2-AP-6-SO3H can block significantly the extension by KF− as represented by the formation of a large amount of the unextended primer (4mer, 32%, Figure S8) and pentameric products (5C, 5A and 5T, larger than 30% in total, Figure S8), suggesting that this lesion may introduce significant structure distortion to duplex DNA. However, the translesion synthesis polymerase, yeast pol η, can bypass all three thionucleosides, including 2-AP-6-SO3H, and give full-length products. Although dCMP is the most favorite nucleotide being inserted opposite 2-AP-6-SCH3 and 2-AP-6-SO3H, we observed significant frequencies of misincorporation of dTMP and dAMP opposite 2-AP-6-SCH3 and 2-AP-6-SO3H, respectively.
Other than nucleotide misincorporation opposite the lesion sites, we also found a substantial amount of -2 frameshift products in the replication mixtures for 2-AP-6-SCH3- and 2-AP-6-SO3H-containing substrates. Remarkably, this type of products account for ∼40% of the products in the pol η-mediated replication of the 2-AP-6-SO3H-containing substrate. We reason that three possible mechanisms may contribute to the formation of these products (Scheme 3). In this respect, yeast pol η incorporates both dCMP and dAMP opposite the lesion, and the resulting 2-AP-6-SO3H/A and the 2-AP-6-SO3H/C base pairs may distort the local double helix structure, which may cause the two bases on the 5′ side of the lesion to flip out. The polymerase can then continue to add one or three correct nucleotides in the presence of template (Scheme 3, left). Other two mechanisms involve the looping-out of the lesion together with flanking 3′ or 5′ nucleotide followed by the incorporation of the correct nucleotides by the polymerase (Scheme 3, middle and right). The latter two mechanisms may account for the high occurrences of 6C and 8C in the replication mixtures of 2-AP-6-SO3H-containing substrate mediated by KF− or pol η. In this context, it is worth noting that different flanking sequences may give rise to different types of frameshift products.
Scheme 3.

Proposed mechanisms for the formation of −2 frameshift mutation products.
The thermodynamic studies revealed that the presence of a 6-TG caused an increase in ▵G° at 37°C by 2.4 kcal/mol relative to that of the parent duplex. The ▵▵G° was close to that induced by one mismatched base pair (30). The presence of 2-AP-6-SCH3 and 2-AP-6-SO3H resulted in even greater destabilization to duplex DNA, i.e. by 4.2–4.3 kcal/mol in Gibbs free energy at 37°C. The increased destabilization to double-stranded DNA induced by 2-AP-6-SCH3 and 2-AP-6-SO3H than by 6-TG may facilitate the more efficient recognition of the two lesions by DNA repair enzymes, though other factors, e.g. substrate specificities of DNA repair enzymes and base pairing, may also contribute to the recognition of these lesions during repair (31,32).
Since the approval of the thiopurine drugs by FDA in the 1960s, azathioprine, 6-mercaptopurine, and 6-TG have been widely used as therapeutic agents in the treatment of a variety of human diseases (1,3). However, there is a high occurrence of certain cancers in long-term survivors of these patients (33–35). For example, 20 years after transplant, about 60–90% of the patients who have taken azathioprine as an immunosuppressant develop squamous cell carcinoma (36). Such great prevalence of skin cancer in transplant patients is not found in the general population. The methylation and oxidation of 6-TG, due to the increased potential in miscoding and in inducing frameshift mutations, may contribute to the development of cancers in those patients. In this respect, it was shown that aberrant processing of 2-AP-6-SCH3/T mismatch was more toxic in mismatch repair-proficient than in deficient cells (32). Future studies on the quantification of these lesions formed in vivo and in vivo mutagenesis study of these lesions using shuttle vector technology should offer more insights into the roles of these lesions in the development of cancers in those patients who have been treated with the thiopurine drugs. Such studies are currently being pursued in our laboratory.
SUPPLEMENTARY DATA
Supplementary Data are available at NAR Online.
ACKNOWLEDGEMENTS
This work was supported by the National Institutes of Health (R01 CA96906 and R01 CA101864 to Y.W.) and the University of California Toxic Substances Research and Teaching Program (to C.G.). Funding to pay the Open Access publication charges for this article was provided by the National Institutes of Health.
Conflict of interest statement. None declared.
Glossary
Abbreviations:
- 6-TG
6-thioguanine
- (TGN)
thioguanine nucleotide
- ODN
oligodeoxynucleotide
- 2-AP-6-SCH3
S6-methylthio-2-aminopurine
- 2-AP-6-SO3H
2-aminopurine-6-sulfonic acid
- S-AdoMet
S-adenosyl-L-methionine
- HFIP
1,1,1,3,3,3-hexafluoro-2-propanol
- ESI
electrospray ionization
- KF−
3′-5′-Exonuclease-free Klenow fragment
- UDG
uracil-DNA glycosylase
- PAGE
polyacrylamide gel electrophoresis
- Tm
melting temperature
REFERENCES
- 1.Elion GB. The purine path to chemotherapy. Science. 1989;244:41–47. doi: 10.1126/science.2649979. [DOI] [PubMed] [Google Scholar]
- 2.Gunnarsdottir S, Elfarra AA. Distinct tissue distribution of metabolites of the novel glutathione-activated thiopurine prodrugs cis-6-(2-acetylvinylthio)purine and trans-6-(2-acetylvinylthio)guanine and 6-thioguanine in the mouse. Drug Metab. Dispos. 2003;31:718–726. doi: 10.1124/dmd.31.6.718. [DOI] [PubMed] [Google Scholar]
- 3.Warren DJ, Andersen A, Slordal L. Quantitation of 6-thioguanine residues in peripheral blood leukocyte DNA obtained from patients receiving 6-mercaptopurine-based maintenance therapy. Cancer Res. 1995;55:1670–1674. [PubMed] [Google Scholar]
- 4.Cara CJ, Pena AS, Sans M, Rodrigo L, Guerrero-Esteo M, Hinojosa J, Garcia-Paredes J, Guijarro LG. Reviewing the mechanism of action of thiopurine drugs: towards a new paradigm in clinical practice. Med. Sci. Monit. 2004;10:RA247–RA254. [PubMed] [Google Scholar]
- 5.Lepage GA. Basic biochemical effects and mechanism of action of 6-thioguanine. Cancer Res. 1963;23:1202–1206. [PubMed] [Google Scholar]
- 6.Duley JA, Florin TH. Thiopurine therapies: problems, complexities, and progress with monitoring thioguanine nucleotides. Ther. Drug Monit. 2005;27:647–654. doi: 10.1097/01.ftd.0000169061.52715.3e. [DOI] [PubMed] [Google Scholar]
- 7.Rappaport HP. Replication of the base pair 6-thioguanine/5-methyl-2-pyrimidine with the large Klenow fragment of Escherichia coli DNA polymerase I. Biochemistry. 1993;32:3047–3057. doi: 10.1021/bi00063a016. [DOI] [PubMed] [Google Scholar]
- 8.Ling YH, Chan JY, Beattie KL, Nelson JA. Consequences of 6-thioguanine incorporation into DNA on polymerase, ligase, and endonuclease reactions. Mol. Pharmacol. 1992;42:802–807. [PubMed] [Google Scholar]
- 9.Swann PF, Waters TR, Moulton DC, Xu YZ, Zheng Q, Edwards M, Mace R. Role of postreplicative DNA mismatch repair in the cytotoxic action of thioguanine. Science. 1996;273:1109–1111. doi: 10.1126/science.273.5278.1109. [DOI] [PubMed] [Google Scholar]
- 10.O’Donovan P, Perrett CM, Zhang X, Montaner B, Xu YZ, Harwood CA, McGregor JM, Walker SL, Hanaoka F, et al. Azathioprine and UVA light generate mutagenic oxidative DNA damage. Science. 2005;309:1871–1874. doi: 10.1126/science.1114233. [DOI] [PMC free article] [PubMed] [Google Scholar]
- 11.Hemmens V, Moore D. Photo-oxidation of 6-mercaptopurine in aqueous solution. J. Chem. Soc. Perkin Trans. 1984;2:209–211. [Google Scholar]
- 12.Zhang X, Jeffs G, Ren X, O’Donovan P, Montaner B, Perrett CM, Karran P, Xu YZ. Novel DNA lesions generated by the interaction between therapeutic thiopurines and UVA light. DNA Repair. 2007;6:344–354. doi: 10.1016/j.dnarep.2006.11.003. [DOI] [PubMed] [Google Scholar]
- 13.Somerville L, Krynetski EY, Krynetskaia NF, Beger RD, Zhang W, Marhefka CA, Evans WE, Kriwacki RW. Structure and dynamics of thioguanine-modified duplex DNA. J. Biol. Chem. 2003;278:1005–1011. doi: 10.1074/jbc.M204243200. [DOI] [PubMed] [Google Scholar]
- 14.Bohon J, de los Santos CR. Structural effect of the anticancer agent 6-thioguanine on duplex DNA. Nucleic Acids Res. 2003;31:1331–1338. doi: 10.1093/nar/gkg203. [DOI] [PMC free article] [PubMed] [Google Scholar]
- 15.Bohon J, de los Santos CR. Effect of 6-thioguanine on the stability of duplex DNA. Nucleic Acids Res. 2005;33:2880–2886. doi: 10.1093/nar/gki572. [DOI] [PMC free article] [PubMed] [Google Scholar]
- 16.Spackova N, Cubero E, Sponer J, Orozco M. Theoretical study of the guanine —> 6-thioguanine substitution in duplexes, triplexes, and tetraplexes. J. Am. Chem. Soc. 2004;126:14642–14650. doi: 10.1021/ja0468628. [DOI] [PubMed] [Google Scholar]
- 17.Goodman MF, Creighton S, Bloom LB, Petruska J. Biochemical basis of DNA replication fidelity. Crit. Rev. Biochem. Mol. Biol. 1993;28:83–126. doi: 10.3109/10409239309086792. [DOI] [PubMed] [Google Scholar]
- 18.Zang H, Goodenough AK, Choi JY, Irimia A, Loukachevitch LV, Kozekov ID, Angel KC, Rizzo CJ, Egli M, et al. DNA adduct bypass polymerization by Sulfolobus solfataricus DNA polymerase Dpo4: analysis and crystal structures of multiple base pair substitution and frameshift products with the adduct 1,N2-ethenoguanine. J. Biol. Chem. 2005;280:29750–29764. doi: 10.1074/jbc.M504756200. [DOI] [PubMed] [Google Scholar]
- 19.Choi JY, Zang H, Angel KC, Kozekov ID, Goodenough AK, Rizzo CJ, Guengerich FP. Translesion synthesis across 1,N2-ethenoguanine by human DNA polymerases. Chem. Res. Toxicol. 2006;19:879–886. doi: 10.1021/tx060051v. [DOI] [PMC free article] [PubMed] [Google Scholar]
- 20.Null AP, Nepomuceno AI, Muddiman DC. Implications of hydrophobicity and free energy of solvation for characterization of nucleic acids by electrospray ionization mass spectrometry. Anal. Chem. 2003;75:1331–1339. doi: 10.1021/ac026217o. [DOI] [PubMed] [Google Scholar]
- 21.Cannistraro VJ, Taylor JS. DNA-thumb interactions and processivity of T7 DNA polymerase in comparison to yeast polymerase eta. J. Biol. Chem. 2004;279:18288–18295. doi: 10.1074/jbc.M400282200. [DOI] [PubMed] [Google Scholar]
- 22.Xu Y. Post-synthetic introduction of labile functionalities onto purine residues via 6-methylthiopurines in oligodeoxyribonucleotides. Tetrahedron. 1996;52:10737–10750. [Google Scholar]
- 23.Zhang Q, Wang Y. Generation of 5-(2′-deoxycytidyl)methyl radical and the formation of intrastrand cross-link lesions in oligodeoxyribonucleotides. Nucleic Acids Res. 2005;33:1593–1603. doi: 10.1093/nar/gki301. [DOI] [PMC free article] [PubMed] [Google Scholar]
- 24.Hong H, Cao H, Wang Y, Wang Y. Identification and quantification of a guanine-thymine intrastrand cross-link lesion induced by Cu(II)/H2O2/ascorbate. Chem. Res. Toxicol. 2006;19:614–621. doi: 10.1021/tx060025x. [DOI] [PMC free article] [PubMed] [Google Scholar]
- 25.Breslauer KJ. Extracting thermodynamic data from equilibrium melting curves for oligonucleotide order-disorder transitions. Methods Enzymol. 1995;259:221–242. doi: 10.1016/0076-6879(95)59046-3. [DOI] [PubMed] [Google Scholar]
- 26.Persmark M, Guengerich FP. Spectroscopic and thermodynamic characterization of the interaction of N7-guanyl thioether derivatives of d(TGCTG*CAAG) with potential complements. Biochemistry. 1994;33:8662–8672. doi: 10.1021/bi00195a006. [DOI] [PubMed] [Google Scholar]
- 27.Apffel A, Chakel J, Fischer S, Lichtenwalter K, Hancock W. Analysis of oligonucleotides by HPLC-electrospray ionization mass spectrometry. Anal. Chem. 1997;69:1320–1325. doi: 10.1021/ac960916h. [DOI] [PubMed] [Google Scholar]
- 28.McLuckey SA, Van Berkel GJ, Glish GL. Tandem mass spectrometry of small, multiply charged oligonucleotides. J. Am. Soc. Mass Spectrom. 1992;3:60–70. doi: 10.1016/1044-0305(92)85019-G. [DOI] [PubMed] [Google Scholar]
- 29.Griffin S, Branch P, Xu YZ, Karran P. DNA mismatch binding and incision at modified guanine bases by extracts of mammalian cells: implications for tolerance to DNA methylation damage. Biochemistry. 1994;33:4787–4793. doi: 10.1021/bi00182a006. [DOI] [PubMed] [Google Scholar]
- 30.Plum GE, Grollman AP, Johnson F, Breslauer KJ. Influence of the oxidatively damaged adduct 8-oxodeoxyguanosine on the conformation, energetics, and thermodynamic stability of a DNA duplex. Biochemistry. 1995;34:16148–16160. doi: 10.1021/bi00049a030. [DOI] [PubMed] [Google Scholar]
- 31.Friedberg EC, Walker GC, Siede W. DNA Repair and Mutagenesis. Washington, DC: ASM Press; 1995. [Google Scholar]
- 32.Stojic L, Brun R, Jiricny J. Mismatch repair and DNA damage signalling. DNA Repair. 2004;3:1091–1101. doi: 10.1016/j.dnarep.2004.06.006. [DOI] [PubMed] [Google Scholar]
- 33.Lindelof B, Sigurgeirsson B, Gabel H, Stern RS. Incidence of skin cancer in 5356 patients following organ transplantation. Br. J. Dermatol. 2000;143:513–519. [PubMed] [Google Scholar]
- 34.Euvrard S, Kanitakis J, Claudy A. Skin cancers after organ transplantation. N. Engl. J. Med. 2003;348:1681–1691. doi: 10.1056/NEJMra022137. [DOI] [PubMed] [Google Scholar]
- 35.Penn I. Depressed immunity and the development of cancer. Cancer Detect. Prev. 1994;18:241–252. [PubMed] [Google Scholar]
- 36.Ramsay HM, Fryer AA, Hawley CM, Smith AG, Harden PN. Non-melanoma skin cancer risk in the Queensland renal transplant population. Br. J. Dermatol. 2002;147:950–956. doi: 10.1046/j.1365-2133.2002.04976.x. [DOI] [PubMed] [Google Scholar]
Associated Data
This section collects any data citations, data availability statements, or supplementary materials included in this article.