

Abstract
Using total intrnal reflection fluorescence microscopy, we directly visualize in real-time, the 1D Brownian motion and transcription elongation of T7 RNA polymerase along aligned DNA molecules bound to substrates by molecular combing. We fluorescently label T7 RNA polymerase with antibodies and use flow to convect them orthogonally to the DNA alignment direction, permitting observation and estimation of the protein diffusivity along the DNA at the single-molecule level. Our observations suggest that the 1D diffusion coefficient varies from molecule to molecule over the range 6.1 × 10⁻¹¹ cm2/s to 4.3 × 10⁻⁹ cm2/s. We also observe binding and transcription by T7 RNA polymerases on single combed T7 DNA molecules with an apparent association rate of 1.6 μM−1s−1. From the measured dependence of the rate of transcription on concentration of nucleotide triphosphate, we infer that the combed DNA molecules capable of interacting with proteins are under an average tension of 25 pN.
INTRODUCTION
With the completion of genomic sequencing for many organisms, a key program in the field of biology is to understand the interactions between DNA and the cellular proteins that control the functioning of the cell. While the expression of genes as proteins is regulated at several levels—starting with the transcription of DNA into complementary RNA and continuing through RNA processing, transport and translation into protein—it is evident that the initial transcription of DNA into RNA is the primary determinant of cellular function. The synthesis of RNA by RNA polymerases (RNAPs) generally follow these steps: (i) RNAP binds to the DNA at a nonspecific location and searches for the promoter DNA sequence via a process known as ‘facilitated diffusion’, (ii) RNAP binds to the promoter and initiates RNA synthesis by first inducing a strand separation to form a transcription bubble, (iii) RNAP undergoes a conformational rearrangement into an elongation complex (1) and translocates unidirectionally downstream powered by nucleotide triphosphate (NTP) hydrolysis rather than relying on random diffusion as in the promoter search.
Bacteriophage T7 RNAP is a single-subunit enzyme (98.8 kDa)that does not require additional transcription factors to carry out the above three steps of RNA synthesis. ‘Bulk’ experiments to elucidate the kinetic properties of T7 RNAP such as measurements of transcription rate (2,3) and rates of association to, and dissociation from, the promoter (4) have been carried out, but, because of ensemble averaging, suffer from loss of detailed information on molecule-to-molecule variations in rates and reaction pathways. Single-molecule studies of DNA–protein interactions can reveal such details by interrogating one molecule at a time. Using single-molecule detection tools, researchers have extensively measured the biophysical properties of Escherichia coli RNAP including its facilitated diffusivity along a DNA molecule (5–7), its force-dependent transcriptional velocities (8,9), the kinetics of the transition between closed to open complex formation (10), and its rotational motion during elongation (11). Direct observations of E. coli RNAP have revealed the kinetics of transcriptional pausing (12,13) and backtracking (14) of RNAP using optical tweezers. Although only a few single-molecule analyses of T7 RNAP interacting with DNA are available, recent studies have examined the effect of mechanical force on the transcription rate using optical tweezers (15) and on the kinetics of the onset of promoter binding, promoter escape and processive elongation by individual T7 RNAP molecules using dual optical trap arrangements (16).
Single-molecule analyses can prove especially powerful in elucidating the longstanding question of how DNA-binding proteins locate their target sites. Proteins that bind to DNA apparently reach specific sequences in part by a facilitated diffusion along the contour of the DNA. Suggested mechanisms of facilitation include 1D ‘sliding’ along the DNA molecular contour while maintaining intimate protein–DNA contact, and ‘hopping’ or ‘jumping’ of proteins through 3D space from one location on the DNA to another site along the DNA contour (17–19). Using single-molecule detection tools, direct evidence of 1D Brownian motion of proteins along single DNA molecules has been obtained for fluorescently labeled E. coli RNAP (5,6), human oxoguanine DNA glycosylase 1 (hOgg 1) (20), and LacI repressor proteins (21).
In the present study, we directly visualize in real-time three biophysical phenomena: (i) the 1D Brownian motion of T7 RNAP in search of its promoter sequence along single, stretched, DNA molecules either firmly immobilized on a substrate at multiple points along the contour by combing (22,23) or immobilized at one end while the opposite end is free in the solution (20,24), (ii) the association of T7 RNAP onto combed DNA molecules and (iii) the transcription by T7 RNAP of single combed T7 DNA molecules. Our single-molecule results suggest that T7 RNAP locates its target sequence via 1D Brownian motion maintaining intimate contact with the DNA. We also observe T7 RNAP associating with, and translocating unidirectionally along, the DNA under a tension in a NTP-concentration-dependent manner.
MATERIALS AND METHODS
DNA preparation
λ-DNA (48.5 kbp, New England Biolabs) was heated to 65°C for 10 min followed by quick cooling to melt the initially dimerized and cyclized DNA molecules (produced by the 12 bp 5′ extruded end) and restore them to their simple linear forms, as recommended by the provider. T7 DNA (39.9 kbp, Boca Scientific) was used as supplied. To stain the DNA, intercalating dye YOYO-1 (Molecular Probes) was diluted to 100 nM in Tris-EDTA buffer and mixed with DNA to yield a staining ratio of 1 dye molecule per 20 bp. DNA solutions were prepared in 50 mM MES buffer (pH 5.5) for combing and 10 mM Tris-HCl 1 mM EDTA (TE) buffer (pH 8.0) for flow stretching. For flow stretching, λ-DNA (3 nM) was ligated to a biotin-labeled oligo (5′-agg tcg ccg ccc-biotin, 30 nM) using T4 DNA ligase (New England Biolabs).
DNA combing
Polystyrene-coated cover glasses were each dipped into a DNA solution for a short period (3 min) and then a syringe pump (kD Scientific 100 series) was used to slowly pull the substrates out from the DNA solution at a constant rate (200 μm/s).
Flow stretching
Cover glasses were cleaned by nitric acid and hydrochloric acid followed by washing with deionized water. A cover glass was attached to the flow cell (length 20 mm, width 8 mm and height 80 μm) to form the bottom wall. The flow cell was filled with 5 mg/ml neutravidin (Invitrogen) and incubated for 1 h to form a monolayer of protein on the glass surface, thus providing binding sites for biotin-labeled DNA. To occupy any remaining protein-binding sites on the glass surface, the flow cell was then washed with TE buffer containing 2 mg/ml α-casein (Sigma) and incubated for 0.5 h. The biotin-modified λ-DNA was then injected into the flow cell and incubated for 5 min to allow the biotinylated DNA to bind to the neutravidin on the surface of the glass. The syringe pump was used to create a strong shear flow (10 ml/h) to stretch DNA molecules as illustrated in Figure 1B.
Figure 1.

Experimental setup for visualizing DNA–T7 RNAP interactions. (A) Blow-up at the bottom of the diagram shows aligned DNA molecules (green) on the surface, interacting with RNAPs (red). (B) A shear flow is created inside the flow cell to stretch λ-DNA molecules modified with biotin at one end. (C) Co-crystal structure of T7 RNAP and DNA. The epitope for AB binding is highlighted in red and DNA in green. We modified the original Chime image adopted from Zhen Huang's website (academic.brooklyn.cuny.edu/chem/zhuang). (D) Alexa Fluor 488-UTP labeled RNA transcripts (left) synthesized by RPAB (right) along combed T7 DNA. Scale bar = 5 μm. (E) Photobleaching trajectory of RPAB and (inset) free secondary antibody showing stepwise decrease in the fluorescence intensity.
Protein visualization
T7 RNAP was purchased from New England Biolabs. T7 RNAP mouse monoclonal antibody (AB) and rhodamine conjugated anti-mouse immunoglobin G (IgG) were purchased from Novagen. T7 RNAP was mixed first with equimolar T7 RNAP monoclonal antibody and then with equimolar rhodamine conjugated anti-mouse IgG, forming a RNAP–AB complex (RPAB). The RPABs were prepared fresh just before each experiment. We note that the terms ‘RPAB’ and ‘T7 RNAP’ will be used interchangeably.
Protein 1D diffusion assay
The cover glass with DNA stretched onto its surface formed the bottom wall of a customized flow cell as shown in Figure 1A. As mentioned above, the flow cell was incubated with a surface-blocking solution containing 2 mg/ml α-casein in TE buffer. The protein solution containing 25–50 nM RPAB, 100 μg/ml BSA and 0–0.1 M NaCl in TE buffer was introduced into the flow cell at a rate of 0.3 ml/h. We recorded 50–200 images at a rate of five images per second.
Transcription assay
The cover glass with DNA stretched onto its surface formed the bottom wall of a customized flow cell as above. The flow cell was incubated with a surface-blocking solution containing 2 mg/ml α-casein in RNAP reaction buffer (40 mM Tris-HCl, 6 mM MgCl2, 10 mM DTT, pH 7.9) for 30 min. For the association kinetics assay, a protein solution containing 50–200 nM RPAB, 100 μg/ml BSA, 0.6 mM NTP (Promega), and 40 U/ml ribonuclease inhibitor (Promega) in RNAP reaction buffer was introduced into the flow cell at a rate of 1 ml/h. For the transcription assay, a protein solution containing 100–200 nM RPAB, 100 μg/ml BSA, 0.1–0.6 mM NTP and 40 U/ml ribonuclease inhibitor in RNAP reaction buffer was introduced into the flow cell at a rate of 0.5 ml/h. For visualization of the RNA transcript, a protein solution containing 200 nM T7 RNAP, 0.2 mM NTP, 8 μM Alexa Fluor 488-UTP or 546-UTP (Invitrogen) and 40 U/ml ribonuclease inhibitor in a RNAP reaction buffer was introduced into the flow cell at a rate of 0.5 ml/h.
Fluorescence microscopy
Fluorescently labeled molecules were visualized with a Nikon TE2000-U inverted fluorescence microscope and a front-illuminated charge-coupled device camera (Cascade 512F, Roper Scientific) with integration time of 200 ms for each frame. Total internal reflection fluorescence (TIRF) was achieved by focusing a white light (x-cite metal halide) through a high numerical aperture × 100 objective at the critical angle. The camera exposure time and filter wheel shutter speeds were controlled by Metavue.
Protein localization
The centroid of fluorescent dots in each image was determined by fitting a 2D fluorescence intensity profile to a Gaussian using DiaTrack (Semasopht). The accuracy of centroid localization can be estimated by
| 1 |
where s (=1 pixel, which is 167 nm) is the standard deviation (SD) of the Gaussian, a (=167 nm) is the size of the pixel, b is the SD of the background noise and N is the total photon count (25). We collect an average of N = 150 counts per molecule in each image with an SD of b = 11 counts, yielding the standard error of the centroid location as σ = 60 nm.
RESULTS AND DISCUSSION
We first investigate the 1D Brownian motion of T7 RNAP on λ-DNA molecules. λ-DNA does not contain any T7 promoter sequence; hence the RNAP is not expected to initiate transcription on λ-DNA. We label T7 RNAP with primary and fluorescent secondary ABs forming a RNAP–AB complex (RPAB) for direct visualization. The epitope for specific binding of T7 RNAP monoclonal AB is located on the C-terminal portion of the palm domain (residues 861–883), facing away from the catalytic core (Figure 1C). The catalytic activity of this RPAB complex was examined by investigating its ability to synthesize RNA. The green fluorescent dots (left in Figure 1D) indicate fluorescent UTPs incorporated into RNA transcripts formed along the contour of single combed T7 DNA (23), and orange fluorescent dots (right in Figure 1D) show the positions of RPABs on the same DNA. Since the locations of the green and red fluorescent dots coincide, we conclude that RPAB is capable of initiation and elongation.
The dye manufacturer has indicated that the molar ratio of dye to secondary antibody is 3.14. We checked this by measuring the photobleaching behavior of the protein complex measured in free solution, where to reduce noise the intensity was added over a 6 × 8 pixel array and each point integrated over 2 s. As shown in Figure 1E, is the results are consistent with the presence of around 3–4 dye molecules on the protein complex (imaged while not attached to DNA), based on the number of apparent steps in the decrease of fluorescence intensity. We observe similar apparent step-wise photobleaching behavior, and similar fluorescence intensity, for the free stained secondary antibody alone, imaged under the same conditions, from which we can infer a similar number of dye molecules (3–4 dyes) on the secondary antibody alone (inset, Figure 1E). We therefore expect to find a single secondary antibody in the RPAB complex. This can also be verified by estimating the size of the complex from its diffusivity. The majority of the fresh RPABs have a diameter of around 40–50 nm, as determined by following their 3D diffusion in the bulk to measure their bulk diffusivity. With a diameter of ∼6 nm for T7 RNAP and ∼13 nm for both the primary and secondary AB, the size of the whole complex (40–50 nm in diameter) is consistent with its containing only one, or at most a few monomers of each of the three proteins (RNAP, primary AB, secondary AB) within the experimental error.
We next observe diffusive motion of RPAB after it binds to the DNA stretched on a substrate. We arrange the flow of RPAB to be approximately perpendicular to the direction along which the DNA was stretched, so that diffusion of the protein along the DNA molecules can easily be distinguished from convection in the flow direction. Stretching of a coiled DNA molecule into a linear configuration is likely to limit our observation of protein motion to sliding and short-range hopping. The stretched configuration of the DNA molecules prevents us from observing any long-range jumping between segments of DNA that are remote to each other along the chain contour, but which could be physically close to each other if the DNA were in a coiled conformation.
As can be seen in Figure 2A, the movement is bidirectional along the DNA contour. The two dots that do not move in Figure 2A are presumably proteins bound to the DNA at points where the DNA is attached to the substrate. It has been shown that combing of DNA molecules onto a hydrophobic substrate at acidic conditions leads to multiple anchor points along the backbone, evidently because of local unpairing of hydrophobic bases (26). We observed that the protein that initially binds to a free segment of the DNA between two anchor points diffuses freely without interference by the substrate. The RPABs showed no significant photobleaching on the time scale of our experiments, so that we could visualize these molecules for as long as several minutes. We also observed RPAB diffusing along YOYO-stained DNA (Figure 2B). The displacements of proteins in Figure 2A and B, and of another similarly diffusing protein, are plotted as a function of time in Figure 2C and their distributions of relative displacements y(j)−y(j−1) in Figure 2D. The distribution of displacements can be well fitted to a Gaussian centered around zero, which is a characteristic of Brownian motion.
Figure 2.

Sequence of images of T7 RNAP diffusing along (A) single combed unstained λ-DNA and (B) stained λ-DNA. Two stationary dots in the sequences are T7 RNAPs stalled at positions where the DNA is apparently attached to the substrate. The time lapse between each image is 0.2 s. Scale bar = 2.5 μm. (C) The displacements of proteins in the sequences shown in A and B are shown as 1 and 2, respectively, and another similarly diffusing protein as sequence 3. (D) Histograms of relative displacements y(j)−y(j−1) of protein for the sequences A and B are shown as 1 and 2, respectively, and another similarly diffusing protein as 3. The distributions are well fitted to a Gaussian centered near zero. (E) Histograms of the 1D diffusion coefficient (D1) and of the diffusion length, defined in the text. (F) The MSD (square) of protein in Figure 2A plotted as a function of time. The error bar shown is calculated by  , where
  is the variance in the MSD [Equation (3)] and i is the measurement index going from 1 to N−1. The dotted line is a linear fit of first five MSD points.
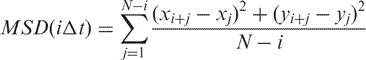
We can obtain the 1D diffusion coefficient (D1) by plotting the mean-square displacement (MSD) versus the time interval over which the displacement takes place and taking the slope of the linear region. The MSD is calculated using
 |
2 |
where xi and yi denote centroid positions of the protein in the ith image, iΔt denotes an interval of i time steps each of duration Δt (=0.2 s), and N is the total number of positions measured. D1 is thereby calculated to be 1.2 ± 1.0 × 10⁻⁹ cm2/s (mean ± SD, n = 32) for the RPAB at [NaCl] = 0 M. Increasing the salt concentration to 0.05 M does not affect the diffusivity, suggesting that the protein maintains close contact with the DNA over the time scale of our observation. A further increase in salt concentration to 0.1 M dramatically reduces the binding affinity of the protein. We note that staining DNA with intercalating dye does not influence the diffusivity of protein at the staining ratio we used (dye:bp = 1:20). We define the diffusion length as the maximum distance covered by the protein over the time scale of our observation (∼20 s) and it is thereby calculated to be 1640 ± 830 nm. D1 and the diffusion length vary from protein to protein over a large range of 6.1 × 10⁻¹¹ cm2/s–4.3 × 10−9 cm2/s, and 480–3630 nm, respectively as shown in Figure 2E (the ‘diffusion length’ is just set by the time we ran the experiments, since we rarely saw proteins escape from the DNA along which they diffused).
Here we discuss whether this large variance in D1 is statistically meaningful by investigating the error in the MSD for a single protein. The variance in MSD increases as i in Equation (2) increases from 1 to N because the number of statistically independent data points of displacement decreases with increasing i (Figure 2F). It has been shown that the variance in MSD can be expressed as (21,27)
| 3 |
The relative SD in D1 can thereby be estimated as [(2i2 + 1)/3i(N - i + 1)]1/2. With N ∼ 100 in our experiments and i ∼ 5 for an upper bound of the linear region in the MSD versus time plot (Figure 2F), we estimate the SD of D1 due to statistical error to be around 20%. In order to check the validity of our estimation of the error in D1, we followed the 1D Brownian motion of a single protein for a time period of 80 s (N = 400), which is four times longer than that of our measurements with different proteins, and obtained D1 for each of four subsets of the data, each containing 100 measurement points. Using the same method to determine MSD, we found that D1 for a single protein varied from a minimum of 4.4 × 10⁻¹⁰ cm2/s in one of the four time intervals to 7.9 × 10⁻¹⁰ cm2/s in another interval, giving a mean value of 6.3 × 10⁻¹⁰ cm2/s and a relative SD of 20%. We also simulated 30 sets of 1D random walks each with N = 100 steps and obtained a relative SD of 17%, which is in good agreement with our estimated error in D1. We thereby conclude that the relative SD of D1 due to uncertainly associated with determination of MSD is around 20%. The much larger variance in D1 we obtained for different proteins, yielding a relative SD of 83%, far exceeds our estimation of statistical error, suggesting that the individual RPABs have distinct intrinsic diffusivities.
We also note that the variability in 1D diffusivities that we have observed does not correlate with the light intensity of these proteins. The fluorescence intensity of a protein with a ‘high’ 1D diffusion coefficient of 3.0 × 10⁻⁹ cm2/s was measured to be ∼1800 (arbitrary unit), and that of a protein with a ‘low’ 1D diffusion coefficient of 1.8 × 10⁻¹⁰ cm2/s was ∼1000 (arbitrary unit). Intensities both higher than 1800 and lower than 1000 were also measured for proteins with 1D diffusion coefficients in between the above two values. We therefore conclude that the brightness of proteins does not correlate with the 1D diffusivity. In addition, the fairly modest variation in light intensity compared to the large variation in 1D diffusivity, is consistent with the rather tight range of particle sizes inferred from the 3D diffusivity (i.e. 40–50 nm). Also, the fluorescence intensity of the free dyed secondary antibody was measured to be 1000–2000 (arbitrary unit) under the same imaging condition we used to measure the intensity of the RNAP complex, where we measured intensity in the range of 1000–1800 (arbitrary unit). (These values differs from the intensities in Figure 1E where to reduce noise the intensity was added over a 6 × 8 pixel array and each point integrated over a longer time period; i.e. 2 s versus 0.2 s). The similarity in the brightness of the free dyed secondary antibody and the protein complex under two different imaging conditions suggests that a single secondary antibody may be found per RPAB complex, thus the variation in 1D diffusivity can hardly be due to protein aggregation.
The residence time of RPAB on the DNA in our experiments is much longer than that of other proteins in previous reports, which typically are on the order of a tenth of second (6,20), while in our experiments, we almost never see the protein detach from the DNA, even after many tens of seconds. In order to verify whether using combed DNA increases the lifetime, we alternatively stretched DNA molecules using a laminar shear flow after attaching DNA molecules to the substrate at one end via a biotin–neutravidin link. As can be seen in kymograph in Figure 3A, the protein displays somewhat jerky unidirectional motion on DNA due to the shear flow, and we do not observe the 1D Brownian motion seen with combed DNA. The MSD's as functions of time for protein moving along flow-stretched DNA and along combed DNA are shown in Figure 3B. The quadratic relationship seen in the MSD curve for a protein moving along flow-stretched DNA is a characteristic of convection rather than diffusion, the latter of which produces a linear relationship, such as seen when a protein diffuses along combed DNA in Figure 2A. It is of interest that Blainey et al. using a DNA molecule similarly bound at just one end and stretched by flow at the same velocity, saw only diffusive motion of the protein hOgg 1 (20). However, convective motion of proteins in stretched DNA has been observed by Granéli et al. and Kabata et al. with human Rad51 (28) and EcoRI (29), respectively. In the experiments by Granéli et al., Rad51 molecules were observed to move in the direction of flow along λ -DNA, stretched using a hydrodynamic force as depicted in Figure 1B. In the absence of buffer flow, the 1D Brownian motion of Rad51 was observed on λ -DNA tethered at both ends. In the experiments by Kabata et al., convective motion along the DNA could be distinguished from simple convection in the flow by a change in direction of the motion of the stained proteins when they encountered the DNA molecules, which were oriented diagonally to the flow direction.
Figure 3.

(A) Kymograph of T7 RNAP moving along λ-DNA stretched by shear flow. (B) The MSD plotted versus time for T7 RNAP moving along flow-stretched (squares) and combed DNA (circles).
Although we do not observe 1D Brownian motion of RPAB on flow-stretched DNA, the lifetime of the protein on the DNA is very long, as is it on combed DNA. This shows that the long residence time of proteins on combed DNA does not result from the influence of the substrate to which the combed DNA is bound. The majority of RPABs do not dissociate from either combed or flow-stretched DNA within the time scale of our observation. It is possible that the antibody binding that we use for staining represses the protein's dissociation from the DNA after a repetitive search. However, the amino acids involved in antibody binding do not directly participate in the catalytic activity which is well preserved since the protein is fully capable of binding to the DNA, initiating transcription and elongating the RNA chain, as will be discussed more in detail below. The prolonged lifetime of RPAB on the DNA and its resistance to photobleaching, however, enable us to observe both the 1D Brownian motion and transcription over a time scale that is longer than previous experiments, offering opportunities to obtain long-time trajectories for a single protein and observing protein-to-protein variations in diffusivity.
Next, we investigate the real-time dynamics of transcription by T7 RNAP beginning with the kinetics of association of T7 RNAP to individual combed T7 DNA molecules. We vary the protein concentration over the range 50–200 nM and measure the time elapsed between two consecutive binding events, yielding the results shown in histograms in Figure 4A and B. The time distributions can be fitted to a single exponential, giving a decay time of 3.1 s for 200 nM T7 RNAP (Figure 4A), 5.9 s at 100 nM T7 RNAP (Figure 4B), and 11.2 s for 50 nM T7 RNAP (not shown). The association rate can be estimated by taking the reciprocal of the decay time and plotting it as a function of protein concentration. We thereby obtain an association rate constant of 1.6 μM−1s−1, which is an order of magnitude lower than reported in previous bulk studies (4). Similar reduction in the association rate was observed for the Lac repressor when the rate was measured using a surface plasmon resonance biosensor (30). In this biosensor, as in our experimental scheme (Figure 1A), the protein must diffuse through a stagnant boundary layer, in which the velocity of fluid past the surface is reduced due to no-slip condition, to reach the surface on which it binds, and this probably affects the apparent binding-rate constant. Obtaining the true binding-rate constant will therefore require accounting for the diffusion of the protein through the stagnant boundary layer.
Figure 4.

Histograms of the time elapsed between two consecutive binding events for (A) 200 nM protein and (B) 100 nM RNAP protein. The time distributions can be fitted to a single exponential, giving a decay time of 3.1 s for 200 nM T7 RNAP, 5.9 s for 100 nM T7 RNAP and 11.2 s for 50 nM T7 RNAP (not shown). (C) The reciprocal of the decay time plotted as a function of protein concentration. The error bar shown is the standard error of the mean.
We then investigated the real-time dynamics of transcription by T7 RNAP on single combed DNA molecules. In similar experiments performed previously (23), fluorescently stained uridine triphosphate (UTP) was used in the reaction mixture, where it was incorporated into the growing RNA transcripts and appeared as visible spots along combed DNA, as we also observe in Figure 5A. The previous work successfully demonstrated that sequence-specific protein-DNA interactions can be observed on combed DNA, but it provided no information on the dynamics of the process because of the high background fluorescence of the free UTP. In ordinary epi-fluorescence microscopy this background fluorescence obscures the view of the RNA transcripts, which can only be observed after stopping the reaction and washing out the free UTP's, as we also did to obtain Figure 5A. However, we were able to overcome this problem by using TIRF microscopy which only illuminates fluorophores very close to the substrate. This allows one to follow in real-time the trajectory of T7 RNAP both by visualizing the RNAP-RNA transcript elongation complex (RPT-EC) as it is synthesized from fluorescently labeled UTP's during transcription elongation and by directly visualizing the RPAB elongation complex (RPAB-EC).
Figure 5.

(A) Images of RPT-EC formed along (left) unstained T7 DNA and (right) YOYO-stained T7 DNA. The RPT-EC is fluorescently labeled by incorporating Alexa Fluor (left) 488-UTP and (right) 546-UTP into growing RNA chain. Scale bar = 5 μm. (B) and (C) Sequence of images of RPT-EC moving along combed T7 DNA. Scale bar = 2.5 μm. (D) Time trajectory of RPT-EC in (C) is converted into RNA transcript length as a function of time.
The sequence of images in Figure 5B and C shows examples of the RPT-EC moving along a single combed T7 DNA molecule incorporating fluorescent UTP into RNA. In Figure 5C, a new fluorescent spot appears at t = 76 s as fluorescent UTP is incorporated into the location (topmost bright dot). The transcription rate of RPT-EC can be obtained by tracking pixel positions in each frame and assuming 0.34 nm rise/bp for a B-form DNA (since transcription does not occur along overstretched DNA) as shown in Figure 5D. The RPT-EC stalls when it encounters a point at which the DNA is attached to the surface. At an attachment point, RPT-EC halts presumably due to lack of space for the complex to rotate around the helix (11,31). The mean transcription rate is found to be 42 ± 8 nt/s (n = 16) for 0.2 mM NTPs, which agrees well with recent single molecule measurement under similar conditions (43 ± 3.2 nt/s for 0.25 mM NTP) (15), obtained using a DNA molecule anchored both ends to beads held in optical traps. This transcription rate is faster than that of E. coli RNAP (4–7 nt/s for 0.2 mM NTP12 and 5–15 nt/s for 0.1 mM NTP) (8,9).
The sequence of images in Figure 6A shows one of the examples of RPAB-EC translocating along a single combed T7 DNA. Using RPAB enables us to study transcription rates as a function of NTP concentration, which is difficult to achieve with RPT-EC, since at higher concentrations of fluorescent UTP there is excessive background light even when TIRF is used. The transcription rates at different NTP concentrations, inferred from RPAB-EC imaging, are shown in Figure 6B. The transcription rate is observed to be 30 ± 8 nt/s (n = 11) for 0.1 mM NTP, 49 ± 4 nt/s (n = 9) for 0.2 mM NTP, 72 ± 13 nt/s (n = 12) for 0.4 mM NTP, and 95 ± 15 nt/s (n = 12) for 0.6 mM NTP. Transcriptional pausing and arrest that have been observed for E. coli RNAP were not detected in RPT-EC and RAB-EC imaging within our optical resolution. We also estimate from the Lineweaver–Burke plot in Figure 6C the maximum transcription rate Vmax and the Michaelis constant KM, which is the NTP concentration at which the reaction rate is half maximal. We obtain Vmax = 149 nt/s and KM = 0.4 mM from linear relationship of the plot. Thomen et al. previously obtained the following expression for KM by measuring transcription rates on the DNA under varying tensions imposed using an optical trap (15)
where δ is enzyme step size (= 1 bp) and Kdiss is the dissociation constant for NTP binding. Using their values for Kdiss = 0.124 mM, and K = 0.27, and fitting the above formula to our data in Figure 6, we obtain an average force of F = 25 pN applied on our combed DNA molecules capable of interacting with proteins. At this force, the DNA is fully stretched (32,33), but not overstretched (i.e. stretched beyond the B-form contour length, which does occur for some DNA molecules are at the pH condition we used for combing) (26).
Figure 6.

(A) Sequence of images of RPAB-EC moving along a combed T7 DNA as indicated by an arrow in the first image. Stationary dots in the sequence are RPABs stalled at points where DNA is attached to the substrate. Scale bar = 2.5 μm. (B) Time trajectories of RPAB-EC converted into RNA transcript lengths as a function of time at different NTP concentrations. Immobile protein nonspecifically attached to the substrate is used as a control. (C) Lineweaver–Burke plot showing a linear relationship between reciprocals of transcription rate and NTP concentration. The error bar shown is the standard error of the mean.
In summary, we have investigated the real-time dynamics of the 1D diffusion of fluorescently labeled T7 RNAP along a combed DNA, the association kinetics of promoter binding, and the rate of transcription as a function of NTP concentration. We have fluorescently labeled T7 RNAP with primary and secondary antibodies, yielding a protein complex fully capable of binding to the DNA, initiating transcription and elongating the RNA molecule. We have visualized for the first time that T7 RNAP, upon encountering DNA molecules, diffuses one-dimensionally along the contour of the DNA molecule, which we had aligned orthogonally to the bulk flow. The 1D diffusion coefficient and diffusion length vary over a large range, almost two decades, suggesting inhomogeneity in the molecular properties revealed by single-molecule analysis. We note that a previous study of 1D diffusion of LacI repressor labeled by green fluorescent protein by Wang et al. yielded an even larger molecule-to-molecule variation in 1D diffusivity, namely over three decades (21). The apparent association rate obtained in our experiment is in good agreement with previous reported value for Lac repressor binding to the target on a surface, although the diffusion through a stagnant boundary layer should be accounted for when comparing with bulk values. We have also visualized the transcriptional motion of RPT-EC and RPAB-EC along individual combed T7 DNA molecules. The transcription rates of RPT-EC and RPAB-EC seem to agree well with previous single-molecule measurements, when the tension on the combed DNA molecules is accounted for. These results indicate that both diffusive and processive motion as well as enzymatic activity of proteins can be observed on DNA that has been deposited onto a surface, for example by molecular combing.
SUPPLEMENTARY DATA
Movie clips of RPAB diffusing along λ-DNA and RPAB-EC moving along T7 DNA are available. This material is available free of charge via the Internet.
ACKNOWLEDGEMENTS
We thank Jean-Marie Rouillard for fruitful discussion on protein labeling. We also thank Nobuhiko Watari for generating 1D random walk trajectories. This material is based upon work supported by the National Science Foundation (NSF) under grant No. NSF-NIRT 0304316. Any opinions, findings and conclusions or recommendations expressed in this material are those of the author(s) and do not necessarily reflect the views of the NSF. Funding to pay the Open Access Publication charges for this article was provided by the University of Michigan.
Conflict of interest statement. None declared.
REFERENCES
- 1.Yin YW, Steitz TA. Structural basis for the transition from initiation to elongation transcription in T7 RNA polymerase. Science. 2002;298:1387–1395. doi: 10.1126/science.1077464. [DOI] [PubMed] [Google Scholar]
- 2.Martin CT, Coleman JE. Kinetic analysis of T7 RNA polymerase-promoter interactions with small synthetic promoters. Biochemistry. 1987;26:2690–2696. doi: 10.1021/bi00384a006. [DOI] [PubMed] [Google Scholar]
- 3.Martin CT, Muller DK, Coleman JE. Processivity in early stages of transcription by T7 RNA polymerase. Biochemistry. 1988;27:3966–3974. doi: 10.1021/bi00411a012. [DOI] [PubMed] [Google Scholar]
- 4.Újvári A, Martin CT. Thermodynamic and kinetic measurements of promoter binding by T7 RNA polymerase. Biochemistry. 1996;35:14574–14582. doi: 10.1021/bi961165g. [DOI] [PubMed] [Google Scholar]
- 5.Kabata H, Kurosawa O, Arai I, Washizu M, Margarson SA, Glass RE, Shimamoto N. Visualization of single molecules of RNA polymerase sliding along DNA. Science. 1993;262:1561–1563. doi: 10.1126/science.8248804. [DOI] [PubMed] [Google Scholar]
- 6.Harada Y, Funatsu T, Murakami K, Nonoyama Y, Ishihama A, Yanagida T. Single-molecule imaging of RNA polymerase-DNA interactions in real-time. Biophys. J. 1999;76:709–715. doi: 10.1016/S0006-3495(99)77237-1. [DOI] [PMC free article] [PubMed] [Google Scholar]
- 7.Guthold M, Zhu X, Rivetti C, Yang G, Thomson NH, Kasas S, Hansma HG, Smith B, Hansma PK, et al. Direct observation of one-dimensional diffusion and transcription by Escherichia coli RNA polymerase. Biophys. J. 1999;77:2284–2294. doi: 10.1016/S0006-3495(99)77067-0. [DOI] [PMC free article] [PubMed] [Google Scholar]
- 8.Yin H, Wang MD, Svoboda K, Landick R, Block SM, Gelles J. Transcription against an applied force. Science. 1995;270:1653–1657. doi: 10.1126/science.270.5242.1653. [DOI] [PubMed] [Google Scholar]
- 9.Wang MD, Schnitzer MJ, Yin H, Landick R, Gelles J, Block SM. Force and velocity measured for single molecules of RNA polymerase. Science. 1998;282:902–907. doi: 10.1126/science.282.5390.902. [DOI] [PubMed] [Google Scholar]
- 10.Revyakin A, Ebright RH, Strick TR. Promoter unwinding and promoter clearance by RNA polymerase: detection by single-molecule DNA nanomanipulation. Proc. Natl Acad. Sci. USA. 2004;101:4776–4780. doi: 10.1073/pnas.0307241101. [DOI] [PMC free article] [PubMed] [Google Scholar]
- 11.Harada Y, Ohara O, Takatsuki A, Itoh H, Shimamoto N, Kinosita K., Jr Direct observation of DNA rotation during transcription by Escherichia coli RNA polymerase. Nature. 2001;409:113–115. doi: 10.1038/35051126. [DOI] [PubMed] [Google Scholar]
- 12.Davenport RJ, Wuite GJL, Landick R, Bustamante C. Single-molecule study of transcriptional pausing and arrest by E. coli RNA polymerase. Science. 2000;287:2497–2500. doi: 10.1126/science.287.5462.2497. [DOI] [PubMed] [Google Scholar]
- 13.Shundrovsky A, Santangelo TJ, Roberts JW, Wang MD. A single-molecule technique to study sequence-dependent transcription pausing. Biophys. J. 2004;87:3945–3953. doi: 10.1529/biophysj.104.044081. [DOI] [PMC free article] [PubMed] [Google Scholar]
- 14.Shaevitz JW, Abbondanzieri EA, Landick R, Block SM. Backtracking by single RNA polymerase molecules observed at near-base-pair resolution. Nature. 2003;426:684–687. doi: 10.1038/nature02191. [DOI] [PMC free article] [PubMed] [Google Scholar]
- 15.Thomen P, Lopez PJ, Heslot F. Unraveling the mechanism of RNA-polymerase forward motion by using mechanical force. Phys. Rev. Lett. 2005;94:128102–128105. doi: 10.1103/PhysRevLett.94.128102. [DOI] [PubMed] [Google Scholar]
- 16.Skinner GM, Baumann CG, Quinn DM, Molloy JE, Hoggett JG. Promoter binding, initiation, and elongation by bacteriophage T7 RNA polymerase. J. Biol. Chem. 2004;279:3239–3244. doi: 10.1074/jbc.M310471200. [DOI] [PubMed] [Google Scholar]
- 17.von Hippel PH, Berg OG. Facilitated target location in biological systems. J. Biol. Chem. 1989;264:675–678. [PubMed] [Google Scholar]
- 18.Shimamoto N. One-dimensional diffusion of proteins along DNA. Its biological and chemical significance revealed by single molecule measurements. J. Biol. Chem. 1999;274:15293–15296. doi: 10.1074/jbc.274.22.15293. [DOI] [PubMed] [Google Scholar]
- 19.Halford SE, Marko JF. How do site-specific binding proteins find their targets? Nucleic Acids Res. 2004;32:3040–3052. doi: 10.1093/nar/gkh624. [DOI] [PMC free article] [PubMed] [Google Scholar]
- 20.Blainey PC, van Oijen AM, Banerjee A, Verdine GL, Xie XS. A base-excision DNA-repair protein finds intrahelical lesion bases by fast sliding in contact with DNA. Proc. Natl Acad. Sci. USA. 2006;103:5752–5757. doi: 10.1073/pnas.0509723103. [DOI] [PMC free article] [PubMed] [Google Scholar]
- 21.Wang YM, Austin RH, Cox EC. Single molecule measurements of repressor protein 1-D diffusion on DNA. Phys. Rev. Lett. 2006;97:048302–048306. doi: 10.1103/PhysRevLett.97.048302. [DOI] [PubMed] [Google Scholar]
- 22.Michalet X, Ekong R, Fougerousse F, Rousseaux S, Schurra C, Hornigold N, van Slegtenhorst M, Wolfe J, Povey S, et al. Dynamic molecular combing: stretching the whole human genome for high-resolution studies. Science. 1997;277:1518–1523. doi: 10.1126/science.277.5331.1518. [DOI] [PubMed] [Google Scholar]
- 23.Gueroui Z, Place C, Freyssingeas E, Berge B. Observation by fluorescence microscopy of transcription on single combed DNA. Proc. Natl Acad. Sci. USA. 2002;99:6005–6010. doi: 10.1073/pnas.092561399. [DOI] [PMC free article] [PubMed] [Google Scholar]
- 24.Greene EC, Mizuuchi K. Direct observation of single MuB polymers: evidence for a DNA-dependent conformational change for generating an active target complex. Mol. Cell. 2002;9:1079–1089. doi: 10.1016/s1097-2765(02)00514-2. [DOI] [PubMed] [Google Scholar]
- 25.Thompson RE, Larson DR, Webb WW. Precise nanometer localization analysis for individual fluorescent probes. Biophys. J. 2002;82:2775–2783. doi: 10.1016/S0006-3495(02)75618-X. [DOI] [PMC free article] [PubMed] [Google Scholar]
- 26.Kim JH, Shi W-X, Larson RG. Methods of stretching DNA molecules using flow fields. Langmuir. 2007;23:755–764. doi: 10.1021/la062505u. [DOI] [PubMed] [Google Scholar]
- 27.Qian H, Sheetz MP, Elson EL. Single particle tracking: analysis of diffusion and flow in two-dimensional systems. Biophys. J. 1991;60:910–921. doi: 10.1016/S0006-3495(91)82125-7. [DOI] [PMC free article] [PubMed] [Google Scholar]
- 28.Granéli A, Yeykal CC, Robertson RB, Greene EC. Long-distance lateral diffusion of human Rad51 on double-stranded DNA. Proc. Natl Acad. Sci. USA. 2006;103:1221–1226. doi: 10.1073/pnas.0508366103. [DOI] [PMC free article] [PubMed] [Google Scholar]
- 29.Kabata H, Okada W, Washizu M. Single-molecule dynamics of the Eco RI enzyme using stretched DNA: its application to in situ sliding assay and optical DNA mapping. Jpn. J. Appl. Phys. 2000;39:7164–7171. [Google Scholar]
- 30.Schuck P. Use of surface plasmon resonance to probe the equilibrium and dynamic aspects of interactions between biological macromolecules. Annu. Rev. Biophys. Biomol. Struct. 1997;26:541–566. doi: 10.1146/annurev.biophys.26.1.541. [DOI] [PubMed] [Google Scholar]
- 31.Pomerantz R, Ramjit R, Gueroui Z, Place C, Anikin M, Leuba S, Zlatanova J, McAllister WT. A tightly regulated molecular motor based upon T7 RNA polymerase. Nano Lett. 2005;5:1698–1703. doi: 10.1021/nl0509125. [DOI] [PubMed] [Google Scholar]
- 32.Cluzel P, Lebrun A, Heller C, Lavery R, Viovy J-L, Chatenay D, Caron F. DNA: an extensible molecule. Science. 1996;271:792–794. doi: 10.1126/science.271.5250.792. [DOI] [PubMed] [Google Scholar]
- 33.Smith SB, Cui Y, Bustamante C. Overstretching B-DNA: the elastic response of individual double-stranded and single-stranded DNA molecules. Science. 1996;271:795–799. doi: 10.1126/science.271.5250.795. [DOI] [PubMed] [Google Scholar]
Associated Data
This section collects any data citations, data availability statements, or supplementary materials included in this article.