Abstract
A method, termed hierarchical oligonucleotide primer extension (HOPE), is developed for quantitative, multiplexing detection of DNA targets present in PCR-amplified community 16S rRNA genes. It involves strand extension reaction and multiple oligonucleotide primers modified with different lengths of polyA at the 5′ end and targeting 16S rRNA genes at different phylogenetic specificities. On annealing to the targets, these primers are extended with a single fluorescently labeled dideoxynucleoside triphosphate or a dye-terminator. Using a DNA autosequencer, these extended primers are separated and identified by size and dye color, and quantified and normalized based on the fluorescence intensities and internal size standards. Using a primer-to-target ratio >1000, constant primer extension efficiencies can be obtained with individual primers to establish a ‘calibration factor’ between individual primers and a universal or domain-specific primer, providing the relative abundance of targeted rRNA genes with respect to total rRNA genes. HOPE up to 10-plexing is demonstrated to correctly identify 20 different bacterial strains, and quantify different Bacteroides spp. in 16S rRNA gene amplicons from different model bacteria mixtures and the influent and effluent of a wastewater treatment plant. Single mismatch discrimination with detection sensitivity of a target down to 0.01–0.05% of total DNA template is achieved.
INTRODUCTION
Various molecular methods are currently available for microbial community analysis, microbial monitoring and microbial identification (1). These methods differ mainly in phylogenetic resolution, detection sensitivity (i.e. the lowest detectable amount and abundance of a target population), quantification capability, ease of use and cost. Among them, denaturing gradient gel electrophoresis (DGGE) (2) and terminal restriction fragment length polymorphism (T-RFLP) (3) are the most commonly used community fingerprinting techniques to rapidly profile microbial community structure, and compare the differences/similarities among community structures obtained from different environments or at different time and locations in a same environment.
Community fingerprinting techniques can further reveal information on community phylogenetic composition (1,4). For DGGE, predominant DNA bands are first excised individually from the gel, and, followed by another round of PCR amplification, the amplified DNA sequenced directly or after cloning. The retrieved sequence information can also be used to design specific oligonucleotide probes for membrane hybridization or whole-cell fluorescence in situ hybridization (FISH). However, this band-retrieving approach is only applicable to predominant bands and the possibility that a major DGGE band can contain different DNA does exist (5). For T-RFLP, the observed terminal restriction fragment (tRF) lengths are compared in silico with the predicted ones available in the SSU rRNA database. The accuracy is however affected by sequence quality and the fact of having multiple and possibly unrelated rRNA gene sequences sharing a same tRF length. To correctly infer the phylogenetic identities of the predominant tRF lengths, community-specific rRNA gene clone library is performed. Still, closely related microbial populations can have an identical tRF length, and the abundance change among these populations, which can occur at a low level, in an environment may not be detected easily without using other molecular tools. Although methods like FISH (6), membrane hybridization (7) and quantitative real-time PCR (8) are often used to provide refined resolution, these methods can be labor-intensive and time-consuming, and are seldom used in a multiplexing manner. To facilitate PCR-based community structure analysis, methods that can determine abundance changes of multiple microbial targets in a rapid and sensitive manner in a given environment are needed.
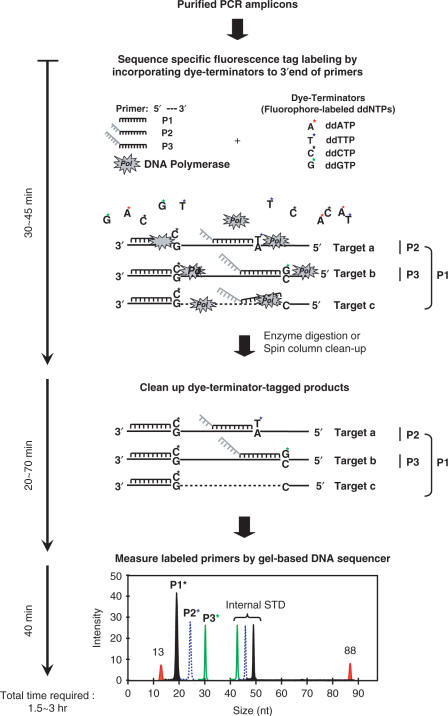
This study reports a method, named hierarchical oligonucleotide primer extension (HOPE) that can rapidly determine the relative abundance of multiple targets inside a mixture of PCR-amplified community 16S rRNA genes (Figure 1). The initial step of this method involves the strand extension reaction used in ‘minisequencing’ (9) to extend a single fluorescently labeled dideoxynucleoside triphosphate (ddATP, ddTTP, ddGTP or ddCTP) or a dye-terminator at the 3′ end of a primer upon its successful annealing to the targeted region of purified PCR-amplified rRNA genes. In this step, multiple oligonucleotide primers, which are designed to target sequences at different levels of specificities (i.e. domain, phylum, etc., species), and modified with different lengths of poly dA tails at the 5′ end of individual primers, are added. After single-base extension, the HOPE products are purified and analyzed using a DNA autosequencer equipped with four-color detectors. Due to difference in length and the dye-terminator type/color added, these extended hierarchical primers can be easily separated and identified, and their lengths and concentrations calculated according to the internal standards consisting of different fluorescently labeled oligonucleotides (Figure 1). It is assumed that a primer with domain-level specificity can prime onto more DNA templates than a group-specific primer. Thus, by knowing the extension efficiency of individual primers, the relative intensity of a specific labeled primer to a broad specific primer can be obtained, and this ratio will represent the relative abundance of the targeting rRNA fragment in a PCR mixture. HOPE procedure can be completed within 90 min, and its feasibility to rapidly identify multiple microbial targets in environmental samples is demonstrated.
Figure 1.
The schematic diagram illustrating the concept of hierarchical oligonucleotide primer extension approach for multiplexed identification and quantitative analysis of the PCR amplicons.
MATERIALS AND METHODS
Bacterial strains and environmental samples
Bacterial strains used here are listed in Tables 1–4. Influent and effluent samples of a local wastewater treatment system are taken, and total suspended solid including microbial cells are concentrated by centrifugation.
Table 1.
Hierarchical oligonucleotide primer extension analyses for 20 bacterial strains.
| Eub338 (18 nt) | BAC303-5a (22 nt) | BTH274-15a (32 nt) | BTH584-16a (36 nt) | |||||||||||
|---|---|---|---|---|---|---|---|---|---|---|---|---|---|---|
| # | Species | Sourcea | MMb | Allelec | ddNTPd | MM | Allele | ddNTP | MM | Allele | ddNTP | MM | Allele | ddNTP |
| 1 | Bacteroides thetaiotaomicron | BCRC10624 | 0 | A | U | 0 | G | C | 0 | A | U | 0 | G | C |
| 2 | Bacteroides fragilis | BCRC10619 | 0 | A | U | 0 | G | C | 0 | G | C | 2 | – | ND |
| 3 | Bacteroides distasonis | JCM5825 | 0 | A | U | 0 | G | C | 2 | – | ND | 6 | – | ND |
| 4 | Bacteroides vulgatus | BCRC12903 | 0 | A | U | 0 | G | C | 7 | – | ND | 4 | – | ND |
| 5 | Ruminococcus albus | DSMZ20455 | 0 | G | C | 6 | – | ND | 7 | – | ND | 8 | – | ND |
| 6 | Collinsella aerofaciens | JCM10188 | 0 | G | C | 6 | – | ND | 7 | – | ND | 10 | – | ND |
| 7 | Lactobacilllus acidophilus | DSMZ20079 | 0 | A | U | 5 | – | ND | 7 | – | ND | 7 | – | ND |
| 8 | Bifidobacterium adolescentis | BCRC14606 | 0 | G | C | 6 | – | ND | 5 | – | ND | 9 | – | ND |
| 9 | Peptostreptococcus productus | DSM2950 | 0 | G | C | 6 | – | ND | 8 | – | ND | 9 | – | ND |
| 10 | Clostridium leptum | BCRC14522 | 0 | G | C | 6 | – | ND | 7 | – | ND | 10 | – | ND |
| 11 | Ruminococcus bromii | ATCC27255 | 0 | G | C | 6 | – | ND | 7 | – | ND | 8 | – | ND |
| 12 | Bifidobacterium longum | BCRC11847 | 0 | G | C | 6 | – | ND | 5 | – | ND | 9 | – | ND |
| 13 | Enterococcus faecium | BCRC10067 | 0 | A | U | 5 | – | ND | 6 | – | ND | 7 | – | ND |
| 14 | Clostridium clostridiiforme | BCRC14545 | 0 | A | U | 6 | – | ND | 6 | – | ND | 8 | – | ND |
| 15 | Bifidobacterium longum | DSMZ20088 | 0 | G | C | 6 | – | ND | 5 | – | ND | 9 | – | ND |
| 16 | Ruminococcus obeum | ATCC29174 | 0 | G | C | 6 | – | ND | 7 | – | ND | 6 | – | ND |
| 17 | Eubacterium biforme | DSMZ3989 | 0 | A | U | 6 | – | ND | 5 | – | ND | 9 | – | ND |
| 18 | Fusobacterium prausnitzii | ATCC27768 | 0 | G | C | 5 | – | ND | 6 | – | ND | 6 | – | ND |
| 19 | Ruminococcus callidus | ATCC27760 | 0 | G | C | 5 | – | ND | 8 | – | ND | 7 | – | ND |
| 20 | Escherichia coli | NCIMB10083 | 0 | G | C | 6 | – | ND | 8 | – | ND | 5 | – | ND |
aBacterial strains are obtained from American Type Culture Collection (ATCC), Bioresource Collection and Research Center (BCRC), Japan Collection of Microorganisms (JCM), German National Resource Centre for Biological Material (DSMZ) and National Collection of Industrial, Marine and Food Bacteria (NCIMB).
bNumbers of the mismatched base-pairing (MM).
cRefer to the nucleotides of the template adjacent to the primer–template duplex formed.
dRefer to the dye-terminators observed.
ND, not detected.
Table 2.
Sequences and specificity of the oligonucleotides used in this study.
| Name | Sequence (5′–3′) | Specificity |
|---|---|---|
| Oligonucleotide primers | ||
| EUB338 | GCTGCCTCCCGTAGGAGT | Bacteria |
| EUB338-4a | (A)4 GCTGCCTCCCGTAGGAGT | Bacteria |
| EUB338-8a | (A)8 GCTGCCTCCCGTAGGAGT | Bacteria |
| EUB338-12a | (A)12 GCTGCCTCCCGTAGGAGT | Bacteria |
| EUB338-18a | (A)18 GCTGCCTCCCGTAGGAGT | Bacteria |
| EUB338-24a | (A)24 GCTGCCTCCCGTAGGAGT | Bacteria |
| EUB338-30a | (A)30 GCTGCCTCCCGTAGGAGT | Bacteria |
| EUB338Ia | GCTGCCTCCCGTAGGAG | Bacteria |
| EUB338Ia-23a | (A)23 GCTGCCTCCCGTAGGAG | Bacteria |
| BAC303-5a | (A)5 CCAATGTGGGGGACCTT | Bacteroidales group |
| BTH274-15a | (A)15 CCCCTATCCATCGAAGG | B. thetaiotaomicron, B. fragilis and other Bacteroidesa |
| BTH584-16a | (A)16 CAACTGACTTAACTGTCCAC | B. thetaiotaomicron |
| BFRG602-19a | (A)19 GAGCCGCAAACTTTCACAA | B. fragilis clustera |
| BTT1250 | CGCCGTGTAGCAACCTGC | Btt1250 groupa |
| BFRG1024 | TCACAGCGGTGATTGCTCA | B. fragilis |
| BITT141 | CGAAAGGCTATCCCGGAA | Bacteroides intestinalis |
| BADF1037-9a | (A)9 TGCAGCACCTTCACACCT | Bacteroides acidifaciens |
| BUFM1018-18a | (A)18 AACTGCCTTGCGGCTGACA | Bacteroides uniformis |
| Fluorophore-labeled oligonucleotide standards | ||
| GT16-Cy5 | Cy5-(GT)8 | |
| GT26-Cy5 | Cy5-(GT)13 | |
| GT36-Cy5 | Cy5-(GT)18 | |
| GT46-Cy5 | Cy5-(GT)23 | |
| GT46-D2 | D2-(GT)23 | |
| GT40-D4 | D4-(GT)20 | |
aRefer to Figure 4.
Table 3.
Quantitative analyses of the model communities composed of defined 16S rRNA gene amplicons using multiplexing HOPE method.
| Model communities | Concentration of 16S rRNA gene amplicons prepared in the model communitiesa | % of primers for specific groups with respect to primer EUB338Ia for domain Bacteria (mean ± sd)b | ||||||||||||
|---|---|---|---|---|---|---|---|---|---|---|---|---|---|---|
| B. thetaiotaomicron | B. distasonis | B. vulgatus | L. acidophilus | E. faecium | P. productus | E. coli | M. barkeric | BAC303-5a (for Bacteroides) | BTH274-15a (for B. thetaiotaomicron and B. fragilis) | BTH584-16a (for B. thetaiotaomicron) | ||||
| Theoretical | Observed | Theoretical | Observed | Theoretical | Observed | |||||||||
| MC1 | 2.2 (22.1%) | 2.5 (24.8%) | 2.5 (25.7%) | 2.7 (27.3%) | 0 | 0 | 0 | 0 | 72.7 | 77.0 ± 3.9 | 22.1 | 18.4 ± 0.7 | 22.1 | 18.5 ± 1.2 |
| MC2 | 2.2 (21.8%) | 2.5 (24.4%) | 0 | 2.7 (26.8%) | 2.7 (26.9%) | 0 | 0 | 0 | 46.2 | 49.2 ± 3.6 | 21.8 | 17.6 ± 0.7 | 21.8 | 18.1 ± 1.4 |
| MC3 | 2.2 (21.5%) | 0 | 0 | 2.7 (26.5%) | 2.7 (26.6%) | 2.7 (25.3%) | 0 | 0 | 21.5 | 14.8 ± 1.0 | 21.5 | 14.4 ± 0.9 | 21.5 | 14.9 ± 1.0 |
| MC4 | 1.1 (5.2%) | 1.2 (5.9%) | 0 | 1.3 (6.5%) | 1.4 (6.5%) | 0 | 15.8 (75.9%) | 0 | 11.1 | 9.7 ± 0.8 | 5.2 | 2.8 ± 0.3 | 5.2 | 3.4 ± 1.0 |
| MC5 | 1.1 (21.8%) | 1.2 (24.4%) | 0 | 1.3 (26.8%) | 1.4 (26.9%) | 0 | 0 | 12.8 (0%) | 46.2 | 53.1 ± 2.9 | 21.8 | 17.4 ± 0.4 | 21.8 | 15.3 ± 1.2 |
afemto-mol/µl; percentages in the brackets indicate species abundance in the Bacteria domain.
bn = 6.
cMethanosarcina barkeri (DSMZ 1538).
Table 4.
Quantifying relative abundance of specific targets in the influent and effluent from sewage treatment plant using multiplexing HOPE method
| Target abundance within a group | Influent (%) | Effluent (%) | |||
|---|---|---|---|---|---|
| Target | Group | Sample 1 (n = 3) | Sample 2 (n = 3) | Sample 1 (n = 3) | Sample 2 (n = 3) |
| Bacteroidales | Bacteria (EUB338Ia-23a) | 11.1 ± 1.4 | 10.0 ± 0.3 | 1.6 ± 0.1 | 1.1 ± 0.9 |
| BFRG602-related group | 1.1 ± 0.9 | 3.6 ± 0.5 | ND | 0.1 ± 0.1 | |
| BTH274c-related groupa | 1.1 ± 0.1 | 0.8 ± 0.2 | ND | ND | |
| BTH274t-related groupb | 0.5 ± 0.1 | 0.3 ± 0.3 | ND | ND | |
| BTT1250-related group | ND | ND | ND | ND | |
| B. fragilis | BFRG602-related group | 4.9 ± 0.7 | 5.1 ± 1.2 | ND | ND |
| B. uniformis | 19.7 ± 1.0 | 21.6 ± 1.1 | ND | ND | |
| B. intestinalis | ND | ND | ND | ND | |
| B. acidifaciens | ND | ND | ND | ND | |
aThe group detected by primer extension with ddCTP of BTH274-15a.
bThe group detected by primer extension with ddTTP of BTH274-15a.
Calibration factors obtained for the 6-plexing, EUB338Ia-23a: BAC303-5a: BFRG602-19a: BTH274-15a(C): BTH274-15a(T): BTT1250 = 1: 6.1: 11.2: 14.4: 3.1: 2.4, and 7-plexing, BFRG602-19a: BUFM1018-18a: BTH274-15a(C): BTH274-15a(T): BFG1024: BITT141 = 1: 0.8: 1.2: 0.4: 1.7: 0.1. Bacterial strains used include B. thetaiotaomicron, B. fragilis, B. acidifaciens (JCM10556), B. intestinalis (JCM13266), B. uniformis (JCM5828), Bacteroides tectus (JCM10003), and Bacteroides pyogenes (JCM6294). ND, not detected.
PCR amplification of 16S rRNA gene
Total DNA from individual reference strains and samples of the local sewage treatment plant is extracted (3), and used as DNA template for the PCR amplification of 16S rRNA genes. The PCR (100 μl) contained 1× buffer solution (Promega), 2.0 mM of MgCl2, 200 nM of each primer [11F, GTT TGA TCC TGG CTC AG (10) and 1492R, GG(C/T) TAC CTT GTT ACG ACT T (11)], 200 mM of each dNTP (dATP, dTTP, dGTP, dCTP), 0.5 U of Taq DNA polymerase (Promega) and 50–100 ng of genomic DNA. PCR amplification is carried out using Bio-Rad iCycler (Hercules, CA) under the following thermal program: initial denaturation (95°C, 3 min), 30 cycles of 95°C (30 s), 55°C (30 s) and 72°C (30 s), and final extension (72°C, 5 min). After verifying amplification by agarose gel electrophoresis, these PCR products are purified using QIAquick PCR purification kit (Qiagen) according to the manufacturer's instruction. The concentrations of purified PCR products are quantified by UV absorbance measurement using a DU 800 spectrophometer (Beckman Coulter, Fullerton, CA).
Hierarchical oligonucleotide primer extension (HOPE)
HOPE reaction (5–20 μl in volume) contains 5–10 pico-mole (pmol) of individually unlabeled oligonucleotide primers, 5–20 femto-mole (fmol) of purified PCR products and 1× premixed solution from the CEQ™ SNP-Primer extension kit (Beckman Coulter, Fullerton, CA). The premix aliquot (2×) consists of DNA polymerase (9%, v/v), reaction buffer (18.2%, v/v) and fluorescently labeled dideoxynucleotides [ddUTP, ddGTP, ddATP and ddCTP (18.2%, v/v)] as provided in the CEQ™ SNP-Primer extension kit. The ddNTPs are labeled with four different WellRed fluorescent dyes (D1, D2, D3 and D4) (Beckman Coulter). The primers are synthesized and HPLC-purified by Sigma-Proligo, Singapore (Singapore). Unless stated otherwise, the primer extension reaction is carried out using Bio-Rad iCycler under the following thermal cycling program: 20 cycles of 96°C (10 s), 60°C (30 s) and 72°C (15 s). After primer extension reaction, 1 U of shrimp alkaline phosphatase (Roche Applied Science, Penzberg, Germany) is added into the reaction mixture to hydrolyze 5′ phosphate groups of unincorporated dye-terminators, thus eliminating the possible fluorescence signal associated with these unincorporated dye-terminators in post analysis. The mixture is incubated at 37°C for 60 min, and the reaction is stopped by thermal denaturation at 85°C for 10 min. Alternatively, to shorten the experiment time, the HOPE products can be purified using Microcon-YM3 spin column (Millipore). Table 2 lists all the primers used.
Quantification of the HOPE products
The purified HOPE products are measured using a CEQ™ 8000 genetic analysis system with four-color detection capability (Beckman Coulter). Prior to capillary electrophoresis, 1 μl of diluted HOPE products is mixed with 1 μl of internal concentration and size standard (see below, 500–1000 pM), 0.2 μl of GenomeLab™ DNA size standard 80 kit (Beckman Coulter), and 39.8 μl of sample loading solution (Beckman Coulter). The mixture is transferred into a 96-well plate, and overlaid with one drop of mineral oil. The plate is then loaded into the CEQ™ 8000 system together with a buffer plate filled with separation buffer (Beckman Coulter). The electrophoresis program includes a denaturation step (90°C, 120 s), an injection step under a voltage of 2.1 kV for 15 s (or 6 kV for 5 s) and a separation step (58°C, 16 min) under a voltage of 6.0 kV. To detect labeled oligonucleotides present in low concentrations, injection sample volume and injection time are increased up to 2 μl and 40 s, respectively. Fluorescence intensity data are automatically collected and subsequently analyzed by the fragment analysis software provided with the CEQ™ 8000 system.
The electrophoretic sizes of individual oligonucleotides are determined and calibrated with the internal size standards using a default linear model and dye calibration parameters (SNP ver 1) built in the software. The internal concentration and size standards used contain a mixture of four different Cy5-labeled oligonucleotides at four different lengths (i.e. 5′-Cy5-[GT]x-3′, x = 8, 13, 18 and 23), one D2-labeled oligonucleotide (5′-D2-[GT]23-3′), and one D4-labeled oligonucleotide (i.e. 5′-D4-[GT]20-3′) (Table 2). They are synthesized and HPLC-purified by Operon Biotechnologies (Cologne, Germany) or Sigma-Proligo France SAS (Paris, France). The concentration and purity of those oligonucleotides are calculated according to the optical density of oligonucleotides and dyes measured at the maximum absorbance, and the extinction coefficients of dyes. The GenomeLab™ DNA size standard 80 kit contains WellRed D1-labeled fragments at 13 and 88 bp in length.
After converting peak areas of individual dye-terminator-labeled primers to concentrations, the relative abundance of a specific target with respect to the universal primer EUB338Ia is calculated as follow:
 |
(1) |
where Cp represents the molar concentration of a specific primer extended in the HOPE reaction for the samples; C338Ia represents the molar concentration of universal primer EUB338Ia extended in the HOPE products of the samples; CFp–338Ia is the calibration factor for primer extension efficiency of the specific primer with respect to EUB338Ia obtained using the reference strain.
RESULTS
Sensitivity of DNA sequencers for oligonucleotide separation and fluorescence measurement
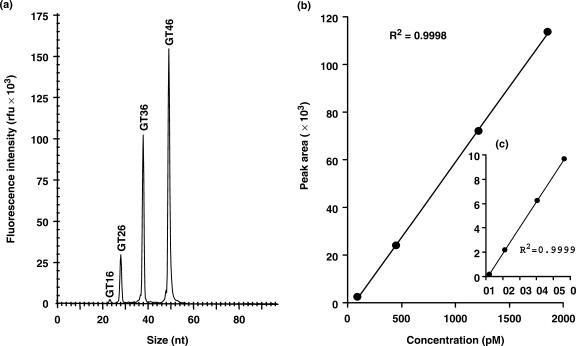
A mixture of four different Cy5-labeled synthetic oligonucleotides [i.e. GT16-Cy5, GT26-Cy5, GT36-Cy5 and GT46-Cy5 (Table 2)] ranging from 2.4 to 46.4 pM or 94 to 1857 pM is used. Distinct and accurate length separation is obtained among the four Cy5-labeled oligonucleotides (Figure 2). The observed fluorescence intensity or peak areas are highly correlated (R2 > 0.9998) to the concentrations of the Cy5-labeled oligonucleotides with a dynamic range of three orders or higher.
Figure 2.
(a) Size-based electropherogram of the four Cy5-labeled oligonucleotides in different concentrations separated by capillary electrophoresis. (b) Linearity in the concentrations (94–1857 pM) of Cy5-labeled oligonucleotides and fluorescence intensities in terms of peak areas. (c) Linearity in the concentrations (2.4–46.4 pM) of Cy5-labeled oligonucleotides and fluorescence intensities in terms of peak areas.
Effects of polyA length on primer extension efficiency
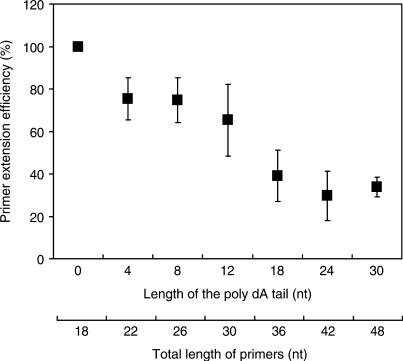
Seven EUB338 primers modified with different lengths of poly dA tails from 0 to 30 nt are used in primer extension reactions (Table 2). They are separately extended with a D2-labeled ddCTP. After analyzing the reaction products with a DNA autosequencer, the concentrations of individual extended primers are quantified. The relative primer extension efficiencies for those poly-dA attached EUB primers to EUB338 are calculated. Figure 3 indicates that the efficiency of single-base primer extension decreases approximately 3.0% per dA with respect to an increase in the length of poly dA tails up to 18 nt (R2 = 0.93). When the length of the polyA tail is ≥18 nt, the primer extension efficiencies fluctuate around 30–34%.
Figure 3.
Decrease in primer extension efficiency as affected by lengths of poly dA tails added to the 5′ end of the EUB338 primer. The primer extension efficiencies are presented as percentages by calculating concentration of each ddCTP-coupled primer against that of ddCTP-coupled primer EUB338 without the poly dA tail, after extended with amplicons of the Escherichia coli 16S rRNA gene. The data points represent the average values derived from two analyses in duplicate or triplicate. The error bars represent standard deviation for the average data points.
Primer design and specificity
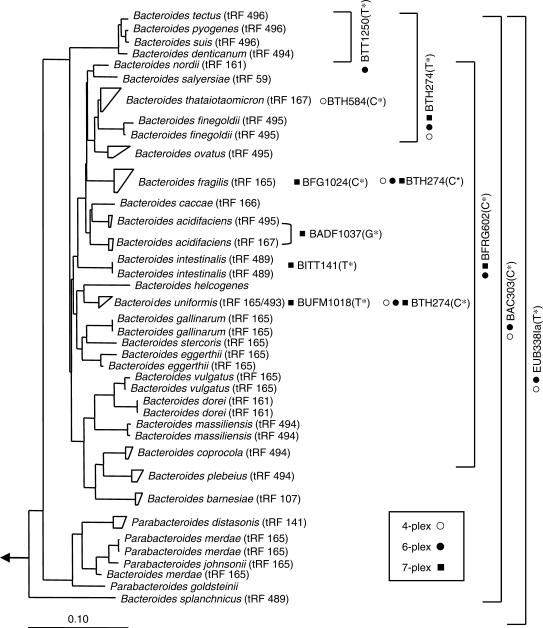
Initially, four different hierarchical oligonucleotide primers are used in a HOPE reaction. These four primers, namely EUB338Ia, BAC303-5a, BTH274-15a and BTH584-16a, are modified with 0, 5, 15 and 16 dAs, respectively, at the 5′ terminus. The specificities of these primers are indicated in Table 2 and Figure 4. The predicted extended nucleotide types of these four primers are analyzed in silico by the Match Probes function provided in the ARB (12) using the ssu_jan04.arb database (www.arb-home.de) containing 28 289 nearly complete 16S rRNA sequences (>1450 nt). The predicted type of nucleotide extended is mostly ddTTP (91.6%) for EUB338Ia, and ddCTP for BAC303-5a and BTH584-16a. For BTH274-15a, the extended nucleotide type is a ddTTP or a ddCTP for Bacteroides thetaiotaomicron or Bacteroides fragilis 16S rRNA gene, respectively. The specificities of other HOPE primers and their extended nucleotide types are indicated in Figure 4.
Figure 4.
Phylogenetic tree of Bacteroides spp. and the specificity of primers used in multiplexing HOPE. The dendrogram is constructed with neighbor-joining method using ARB and rooted with Escherichia coli. The scale bar corresponds to 10 nucleotide substitutions per 100 nucleotide positions. The primers used in the 4-plexing (open circle), 6-plexing (filled circle) and 7-plexing (filled square) reactions are indicated at the right of the tree. The primer specificity is specified by the position of the primers or the bracket. The type of the extended nucleotide is indicated within brackets after the primer name. The terminal restriction fragment (tRF) lengths of Bacteroides spp. that are in silico analyzed with primers Bac32F and Bac708R and restriction enzyme AciI (14) using the tRFcut add-in program in ARB (15) are indicated in brackets after the species names.
Optimization of HOPE to profile 16S rRNA gene amplicon
HOPE reaction with a mixture of four primers (EUB338Ia, BAC303-5a, BTH274-15a and BTH584-16a) is optimized with PCR-amplified B. thetaiotaomicron 16S rRNA gene as the DNA template under different annealing temperatures, duration of thermal program, cycle number and primer-to-template ratio.
(a) Annealing temperature
A range of annealing temperatures from 50 to 70°C at an increment of 5°C is investigated. After strand extension reactions, those labeled primers are quantified using autosequencer. The relative primer extension efficiencies are normalized against the highest concentration observed for individual primers (Supplementary Figure 1). All primers exhibit extension efficiencies between 80 and 100% at an annealing temperature between 50 and 60°C. The extension efficiencies decrease to < 43.7% at an annealing temperature of 70°C. To achieve a stringent condition for primer extension, an annealing temperature of 60°C is used for subsequent experiments in this study.
(b) Duration of thermal program
Effects of duration time used in denaturation (10 s, 30 s and 60 s), annealing (5 s, 30 s and 60 s) and extension (15 s, 30 s and 60 s) on primer extension efficiency are investigated. The optimal duration obtained is 10 s for denaturation at 96°C, 30 s for annealing at 60°C and 15 s for extension at 72°C (Supplementary Figure 2). This thermal program is used throughout the study.
(c) Cycle number
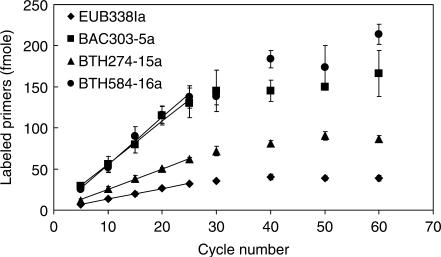
Figure 5 indicates that the amounts of extended primers increase linearly along with an increase in cycle number up to 25, and gradually reach a plateau after 30 cycles. Up to 25 cycles, D2-ddCTP-labeled BTH584-16a and BAC303-5a exhibit similar increasing rates, which are higher than that observed with D4-ddUTP-labeled BTH274-15a and EUB338Ia. The observed slopes of primer extension for individual primers between cycles 5 and 25 are calculated (n = 10). For BTH584-16a, BAC303-5a, BTH274-15a and EUB338Ia, they are 5.77, 5.23, 2.48 and 1.26 fmol per cycle (R2 > 0.99), respectively, suggesting that the amounts of BTH584-16a, BAC303-5a and BTH274-15a that have annealed on the template and extended are 4.57, 4.15 and 1.97 times higher than the amount of EUB338Ia extended.
(d) Effects of primer-to-template ratio
Figure 5.
Effects of the cycle number on the hierarchical oligonucleotide primer extension method. The reactions are carried out using the thermal cycling conditions: denaturation at 96°C for 30 s, annealing at 60°C for 30 s and extension at 72°C for 30 s. The experiments are conducted using Bacteroides thetaiotaomicron 16S rRNA gene amplicons and the primer mixture containing EUB338Ia, BAC303-5a, BTH274-15a, and BTH584-16a. The data points represent the average values derived from two independent reactions. The error bars represent standard deviation for average data points.
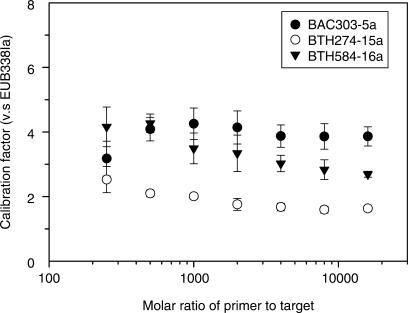
These experiments are conducted at different primer-to-template ratios from 250 to 16000 by using fixed primer concentration and varying template quantity (i.e. B. thetaiotaomicron PCR amplicon) from 20 to 0.3125 fmol. The amount of primer extended from those four primers at individual primer-to-template ratios is normalized assuming that the amount of the extended EUB338Ia is one (Figure 6). The normalized ratios for the D2-ddCTP-extended primers (BAC303-5a and BTH584-16a) are generally higher than that for the D4-ddUTP-extended primer (BTH274-15a). At a primer-to-template ratio ranging from 1000 to 16 000, the normalized ratios remain fairly constant at 1.73 and 4.0 for BTH274-15a and BAC303-5a, respectively. For BTH584-16a, the normalized ratio slightly decreases from 3.49 to 2.69. These observations suggest that the normalized ratios can be further used to correlate with the concentrations of those extended primers inside a HOPE reaction, when the initial concentrations of oligonucleotide primers are present in excess of the template concentration (>1000 fold) to ensure a consistent primer extension efficiency.
Figure 6.
Distribution of the ratios for the labeled primer BAC303-5a (filled circle), BTH274-15a (open circle), and BTH584-16a (filled inverted triangle) against the labeled universal primer EUB338Ia. The primer-to-target ratios (molar basis) range from 250 to 16 000. The experiment is conducted using fixed primer concentrations, and varying target concentrations as indicated in the main text. The data points represent the average values derived from three independent reactions. The error bars represent standard deviation for average data points.
Specificity of HOPE
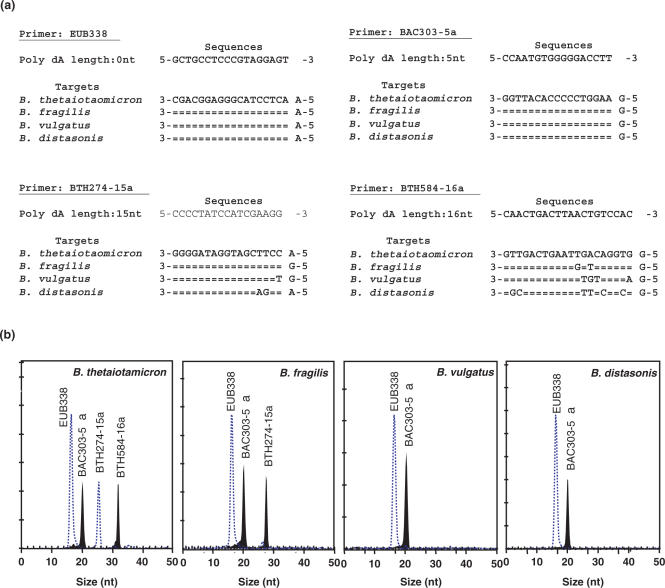
The specificity of HOPE is first validated using four different Bacteroides species (i.e. B. thetaiotaomicron, B. fragilis, Bacteroides vulgatus and Bacteroides distasonis), and four different primers (i.e. EUB338, BAC303-5a, BTH584-16a and BTH274-15a) in a single reaction. Figure 7 indicates that all four Bacteroides species are correctly extended with a D4-ddUTP or a D2-ddCTP by using EUB338 or BAC303-5a, respectively. With B. thetaiotaomicron and B. fragilis, BTH274-15a is extended with a D4-ddUTP and a D2-ddCTP, respectively, and are easily discriminated by the CEQ™ 8000 system based on the dye color. With B. vulgatus and B. distasonis having a mismatch nucleotide ‘T’ and two mismatch nucleotides ‘AG’ near the 3′ end of the primer, respectively, BTH274-15a gives no fluorescence signals. For BTH584-16a, it is successfully extended with a D2-ddCTP only with B. thetaiotaomicron. To further confirm the specificity of the 4-plexing HOPE, the 16S rRNA gene amplicons of 16 other reference species commonly found in the fecal samples are used as DNA template (Table 1). 100% accuracy in extending correct type of nucleotides is obtained with those reference strains, and the results match with the in silico prediction.
Figure 7.
Specificity of the hierarchical oligonucleotide primer extension method. The individual Bacteroides spp. template is used in a 4-plexing HOPE reaction, where there is inclusive of primers EUB338, BAC303-5a, BTH274-15a and BTH584-16a. (a) Sequences of the four primers and the binding regions of targets. For each panel, the complementary sequence for the first species is shown. When identical sequence compositions are encountered in the subsequent species, they are represented by double dashes. The nucleotide compositions adjacent to the binding regions are indicated as well. (b) The electropherograms of 4-plexing reaction tested with individual references. Dashed lines and solid peaks represent the detection of D4-ddUTP- and D2-ddCTP-coupled primers, respectively.
Sensitivity of HOPE
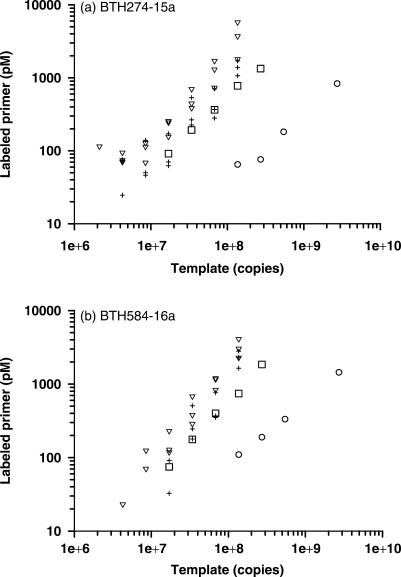
HOPE reaction is carried out with different amounts of DNA template (1.1 × 10⁶ − 2.7 × 10⁹ copies of B. thetaiotaomicron 16S rRNA gene amplicon) with two different specific primers (BTH274-15a and BTH584-16a) under three different reaction volumes (5, 10 and 20 μl). Figure 8a indicates that the amount of the D4-ddUTP-extended BTH274-15a decreases linearly along with a decrease in the template concentration. The lowest amount of template consistently detected is 1.4 × 10⁸, 1.7 × 10⁷ and 4.3 × 10⁶ copies, respectively, for a reaction volume of 20, 10 and 5 μl. Like BTH274-15a, BTH584-16a shows comparable amounts of template detected at different reaction volumes with 5 μl giving the lowest detectable amount of template (1.7 × 10⁷ copies) (Figure 8b).
Figure 8.
Sensitivity of the hierarchical oligonucleotide primer extension method. Two primers, (a) BTH274-15a and (b) BTH584-16a, are used together with a serial concentration of 16S rRNA gene amplicons of Bacteroides thetaiotaomicron from 1.1 × 10⁶ to 2.7 × 10⁹ copies. The reactions are carried out in a total volume of 20 µl (open circle), 10 µl (open square) and 5 µl (open inverted triangle) using B. thetaiotaomicron amplicons alone. 5 µl (+) reacting with B. thetaiotaomicron, plus 6.5 × 10¹⁰ copies of Lactobacillus acidophilus amplicons are also performed.
The detection sensitivity of HOPE is further investigated by mixing the target template (i.e. B. thetaiotaomicron) with other non-targets present at higher concentrations. Using a 5-μl reaction volume, different amounts (1.1 × 10⁶ − 1.4 × 10⁸ copies) of B. thetaiotaomicron 16S rRNA gene amplicon are mixed with 6.5 × 10¹⁰ copies of Lactobacillus acidophilus 16S rRNA gene amplicons. The lowest amount of template detected is 8.5 × 10⁶ copies for BTH274-15a or 3.4 × 10⁷ copies for BTH584-16a (Figure 8). This amount is comparable to data obtained without the addition of L. acidophilus amplicons in the DNA template, and is equivalent to approximately 0.01 or 0.05% of total amount of PCR amplicon added to the HOPE reaction.
Validation of HOPE using defined model communities
Five different model communities are prepared individually and determined by HOPE (Table 3). They consist of various amounts of 16S rRNA genes amplified from three different Bacteroides species, L. acidophilus, Enterococcus faecium, Peptostreptococcus productus, Escherichia coli and Methanosarcina barkeri. B. thetaiotaomicron can be simultaneously detected by all four primers (BTH274-15a, BTH584-16a, BAC303-5a and EUB338Ia) in a HOPE reaction. B. distasonis and B. vulgatus can only be detected by BAC303-5a and EUB338Ia. The remaining four bacterial species can be detected by EUB338Ia. M. barkeri cannot be detected by any primers. The abundance of a specific target in the model communities is calculated according to Equation (1).
Table 3 suggests that the HOPE reaction can accurately and reproducibly detect the relative abundance of selected sequences within a defined pool of PCR amplicons. For example, in MC1, MC2 and MC3, the observed ratios of Bacteroides by BAC303-5a are 77.0 ± 3.9, 49.2 ± 3.6 and 14.8 ± 1.0 of total amplified DNA (molar basis), respectively, and are very close to the theoretical ratios (72.7, 46.2 and 21.5%, respectively). In MC5, by replacing E. coli 16S rRNA gene with M. barkeri 16S rRNA gene, the observed ratio of all Bacteroides species increased from 9.7 to 53.1% of total bacterial 16S rRNA gene amplicon. Accordingly, the abundance of B. thetaiotaomicron also increased from 2.8–3.4% to 15.3–17.4% of total bacterial 16S rRNA gene amplicon. Only a lower ratio of B. thetaiotaomicron (14.4–14.9%) is observed in MC3.
Multiplexing capability of HOPE
To achieve multiplexing capability >4-plexing, a 6-plexing reaction and a 7-plexing reaction were designed and tested. Figure 4 shows the primer combination in a 6-plexing HOPE reaction containing a domain Bacteria-specific primer and four group-specific primers (BTT1250, BAC303-5a, BTH274-15a, EUB338Ia-23a and BFRG602-19a). Depending on the targets, BTH274-15a can be extended with a ddCTP or a ddTTP. The 7-plexing reaction includes two group-specific primers (BFRG602-19a and BTH274-15a), and four species-specific primers (BUFM1018-18a, BADF1037-9a, BFG1024 and BITT141).
Figures 9a and b show the electropherograms of the 6-plexing and 7-plexing reactions, respectively, with different reference strains. Individual primers are clearly separated and identified based on the lengths and extended dye-terminator types. The calibration factor obtained between a given primer and a reference primer is comparable to that obtained from Figures 5 and 6.
Figure 9.

The electrophoregrams of 6-plexing reaction products generated from mixed 16S rRNA gene amplicons of Bacteroides tectus, Bacteroides fragilis and Bacteroides thetaiotaomicron (a); 7-plexing reaction products generated from mixed 16S rRNA gene amplicons of Bacteroides intestinalis, B. fragilis, Bacteroides acidifaciens, Bacteroides uniformis and Bacteroides pyogenes (b); and 7-plexing reaction products generated from 16S rRNA gene amplicons of wastewater influent (c). The dashed line, solid line and solid peak represent primers extended with D4-ddUTP-, D3-ddGTP and D2-ddCTP, respectively. The primers detected and internal standards (GT40-D4 and GT46-D2) are labeled beside the corresponding peaks in panel (c).
The 6-plexing and 7-plexing HOPE reactions are further used together (in total, 10-plexing) to simultaneously determine the relative abundance of different Bacteroides spp. in the influent and effluent of a domestic wastewater treatment plant, where more than 25–34 detectable bacterial groups as determined by T-RFLP were observed (data not shown). Figure 9c illustrates the electropherogram obtained for the influent sample using the 7-plexing HOPE reaction. Those distinct detectable peaks correctly correspond to group-specific primers (BFRG602_19a and BTH274-15a), two species-specific primers (BUFM1018-18a and BFG1024), and two size-and-concentration standards. Table 4 indicates that the relative abundance of the Bacteroidales group and BFRG602-related group accounts for 10–11.1% and 3.6–4.5%, respectively, of the amplified 16S rRNA genes in the influent samples. These percentages decrease to 1.1–1.6% and <0.1% in the effluent samples, a 7–45-fold reduction in the relative abundance. The BTH274-related group represents approximately 0.3–1.1% of total amplified bacterial 16S rRNA genes in the influent samples, and is not detectable in the effluent. Within the BTH274-related group, B. fragilis and Bacteroides uniformis are present at 4.9–5.1% and 19.7–21.6% of the BFRG602-related group, or 0.2% and 0.8–0.9% of EUB338Ia-detected bacteria, respectively, suggesting the presence of other Bacteroides spp. in the influent that are not targeted by the species-specific primers used.
DISCUSSION
In theory, the amount of primers extended in a HOPE reaction can be described by
| (2) |
where N is the final amount of extended primers, No is the initial amount of target template, E is the extension efficiency, and n is the number of thermal cycles.
To obtain relative abundance using HOPE, the extension efficiency for a given primer should remain relatively constant. In this study, under a cycle number of 25 or lower and a primer-to-template ratio of 1000 or higher, the amount of primers extended is observed to follow stoichiometric kinetics, and the competition on the target sites between extended and non-extended primers is greatly minimized. It is noted that the primer extension efficiencies can be affected by the length of poly dA tails attached at the 5′ end of a primer (Figure 3), primer characteristics (length and composition) (Figure 5) and the type of dye-terminators (13). Despite these, a fairly constant ratio (i.e. calibration factor) can still be reproducibly established between a given primer and a ‘higher-ranked’ or ‘domain-specific’ primer under a fixed experimental condition and mixture of templates (Figure 6). Thus, the relative abundance of a specific rRNA gene target within a pool of PCR amplicons can be obtained (Table 3).
HOPE technique can discriminate sequences down to single base-paired mismatch. This excellent specificity is related to (i) the use of a high annealing temperature for a primer to correctly anneal to its complementary sequence; (ii) the excellent specificity of polymerase to discriminate single base-paired mismatch occurring near the 3′ end of the primer (9) and (iii) the differences in the types of dye-terminators extended. For example, B. thetaiotaomicron and B. fragilis are correctly identified based on the type of dye-terminators extended using BTH274-15a and differentiated from B. vulgatus, which has a single mismatch at the 3′end of the primer (Figure 7). Mismatches occurring at the 5′ end of the primer, however, have less effect than 3′ mismatched nucleotides on the primer extension efficiency (Figure 3), suggesting that mismatch position can greatly affect the specificity and possibly, the primer extension efficiency of HOPE technique.
The minimal amount of template or 16S rRNA gene amplicons required with HOPE is 106– 107 copies (atto-mole level). Using reference strains, the minimal detectable 16S rRNA gene amplicon(s) for HOPE is 0.01–0.05% of total PCR amplicon. Using environmental samples like the influent and effluent of a wastewater plant, HOPE can detect specific Bacteroides spp. present at approximately 0.1% of total 16S rRNA gene amplicons. It is expected that the minimal detectable level can be further improved with the advance in electrophoresis and fluorescence technologies.
HOPE technique can simultaneously detect multiple targets in the pool of 16S rRNA genes amplified from a microbial community. It uses hierarchical primers designed in different lengths or attached with different lengths of poly dAs at the 5′ end of the primers. Thus, the extended primers can be clearly separated by size using a DNA autosequencer. Difference in the type of dye-terminators extended further allows a single primer (e.g. EUB338 and BTH274-15a) to identify more than one target (Table 1). We have demonstrated HOPE with 4-plexing, 6-plexing and then 7-plexing capability. Moreover, by using the 6-plexing reaction together with the 7-plexing reaction (in total, 10-plexing), multiple Bacteroides spp. present in the influent and effluent of a local treatment plant can be simultaneously detected (Table 4). The underlying mechanism of this ‘multiple tubes’ concept is to use one of the group primers (i.e. BFRG602) in the 6-plexing reaction as the highest ranked primer together with other species-specific primers in the 7-plexing reaction (see Figure 4 and Table 4). To further increase the multiplexing capability to 15, another 6-plexing reaction can be set up with BFRG602 as the highest ranked primer together with specific primers targeting B. vulgatus, Bacteroides dorei, Bacteroides massiliensis, Bacteroides gallinarum and Bacteroides eggerthii. This multiple tubes concept can greatly expand the multiplexing capability of HOPE.
Currently, several members of Bacteroides–Prevotella are suggested as indicative organisms of possible fecal contamination, and have been monitored using T-RFLP with group-specific primers targeting 16S rRNA genes from this group (14). However, this approach can only resolve limited members within the Bacteroides–Prevotella group due to the inability to differentiate the key members based on the difference in tRF lengths (Figure 4). For example, B. fragilis, B. uniformis, B. eggerthii and B. vulgatus all share an identical tRF length. In contrast, using species-specific primers, HOPE can effectively discriminate B. fragilis from B. uniformis (Figure 7) and has potential to differentiate between species like B. eggerthii and its closely related species (i.e. B. vulgatus). Moreover, HOPE can monitor multiple specific sequence types present at a level much lower than that by T-RFLP or DGGE. For comprehensive and routine monitoring of Bacteroides spp. in environments (i.e. fecal samples and wastewater treatment systems) where they are abundant, more vigorous tests with HOPE are undertaken.
Overall, the potential of HOPE for rapid, sensitive and robust multiplexing detection of specific DNA sequences in a mixture of PCR amplicons is demonstrated. With its simplicity and adaptability to various detection formats (9), HOPE can be further extended to the studies of specific functional gene amplicons, genomic DNA and rRNA that are important to a microbial process or an ecosystem in related to spatial and temporal changes, or from different microbial ecosystems.
SUPPLEMENTARY DATA
Supplementary Data is available at NAR Online.
ACKNOWLEDGEMENTS
The authors would like to thank Hong Peiying for help with experiments. Funding to pay the Open Access publication charge was provided by a grant (R-288-000-026-133) from National University of Singapore. The research was supported in part by an NUS grant (R-264-000-168-112) to WTL.
Conflict of interest statement. None declared.
REFERENCES
- 1.Liu W-T, Stahl DA. In: Manual of Environmental Microbiology. 2nd. Hurst CJ, Knudsen GR, McInerney MJ, Stetzenbach LD, Walter MV, editors. Washington, D.C.: ASM Press; 2001. pp. 114–134. [Google Scholar]
- 2.Muyzer G, de Waal EC, Uitterlinden AG. Profiling of complex microbial populations by denaturing gradient gel electrophoresis analysis of polymerase chain reaction-amplified genes coding for 16S rRNA. Appl. Environ. Microbiol. 1993;59:695–700. doi: 10.1128/aem.59.3.695-700.1993. [DOI] [PMC free article] [PubMed] [Google Scholar]
- 3.Liu W-T, Marsh TL, Cheng H, Forney LJ. Characterization of microbial diversity by determining terminal restriction fragment length polymorphism of 16S ribosomal DNA. Appl. Environ. Microbiol. 1997;63:4516–4522. doi: 10.1128/aem.63.11.4516-4522.1997. [DOI] [PMC free article] [PubMed] [Google Scholar]
- 4.Muyzer G. DGGE/TGGE a method for identifying genes from natural ecosystems. Curr. Opin. Microbiol. 1999;2:317–322. doi: 10.1016/S1369-5274(99)80055-1. [DOI] [PubMed] [Google Scholar]
- 5.Sekiguchi H, Tomioka N, Nakahara T, Uchiyama H. A single band does not always represent single bacterial strains in denaturing gradient gel electrophoresis analysis. Biotechnol. Lett. 2001;23:1205–1208. [Google Scholar]
- 6.Amann R, Fuchs BM, Behrens S. The identification of microorganisms by fluorescence in situ hybridisation. Curr. Opin. Biotechnol. 2001;12:231–236. doi: 10.1016/s0958-1669(00)00204-4. [DOI] [PubMed] [Google Scholar]
- 7.Raskin L, Poulsen LK, Noguera DR, Rittmann BE, Stahl DA. Quantification of methanogenic groups in anaerobic biological reactors by oligonucleotide probe hybridization. Appl. Environ. Microbiol. 1994;60:1241–1248. doi: 10.1128/aem.60.4.1241-1248.1994. [DOI] [PMC free article] [PubMed] [Google Scholar]
- 8.Dick LK, Field KG. Rapid estimation of numbers of fecal Bacteroidetes by use of a quantitative PCR assay for 16S rRNA genes. Appl. Environ. Microbiol. 2004;70:5695–5697. doi: 10.1128/AEM.70.9.5695-5697.2004. [DOI] [PMC free article] [PubMed] [Google Scholar]
- 9.Syvanen AC. From gels to chips: “minisequencing” primer extension for analysis of point mutations and single nucleotide polymorphisms. Hum. Mutat. 1999;13:1–10. doi: 10.1002/(SICI)1098-1004(1999)13:1<1::AID-HUMU1>3.0.CO;2-I. [DOI] [PubMed] [Google Scholar]
- 10.Kane MD, Poulsen LK, Stahl DA. Monitoring the enrichment and isolation of sulfate-reducing bacteria by using oligonucleotide hybridization probes designed from environmentally derived 16S rRNA sequences. Appl. Environ. Microbiol. 1993;59:682–686. doi: 10.1128/aem.59.3.682-686.1993. [DOI] [PMC free article] [PubMed] [Google Scholar]
- 11.Lane DJ. In: Nucleic Acid Techniques in Bacterial Systematics. Stackebrandt E, Goodfellow M, editors. New York: John Wiley & Sons, Inc.; 1991. pp. 115–175. [Google Scholar]
- 12.Ludwig W, Strunk O, Westram R, Richter L, Meier H, Yadhukumar, Buchner A, Lai T, Steppi S, et al. ARB: a software environment for sequence data. Nucleic Acids Res. 2004;32:1363–1371. doi: 10.1093/nar/gkh293. [DOI] [PMC free article] [PubMed] [Google Scholar]
- 13.Li Y, Mitaxov V, Waksman G. Structure-based design of Taq DNA polymerases with improved properties of dideoxynucleotide incorporation. Proc. Natl Acad. Sci. USA. 1999;96:9491–9496. doi: 10.1073/pnas.96.17.9491. [DOI] [PMC free article] [PubMed] [Google Scholar]
- 14.Bernhard AE, Field KG. Identification of nonpoint sources of fecal pollution in coastal waters by using host-specific 16S ribosomal DNA genetic markers from fecal anaerobes. Appl. Environ. Microbiol. 2000;66:1587–1594. doi: 10.1128/aem.66.4.1587-1594.2000. [DOI] [PMC free article] [PubMed] [Google Scholar]
- 15.Ricke P, Kolb S, Braker G. Application of a newly developed ARB software-integrated tool for in silico terminal restriction fragment length polymorphism analysis reveals the dominance of a novel pmoA cluster in a forest soil. Appl. Environ. Microbiol. 2005;71:1671–1673. doi: 10.1128/AEM.71.3.1671-1673.2005. [DOI] [PMC free article] [PubMed] [Google Scholar]
Associated Data
This section collects any data citations, data availability statements, or supplementary materials included in this article.


