Abstract
Aim: To compare the interocular and intraocular differences of capillary perfusion, and the intraocular regional differences of retinal blood flow in the macular area of healthy volunteers.
Methods: Tissue blood flow in the macula was examined in both eyes of 20 healthy volunteers with the Heidelberg retinal flowmeter. Blood flow measurements were made in a 10°×2.5° area superior and inferior to the macula. The mean blood flow (MBF) was calculated by an automatic full field perfusion image analyser program. The MBF in the right and left eyes and in the superior and inferior macular areas of the same eye were compared.
Results: The ratios of the MBF in the right eye to the left eye in the macular areas were 1.00, and 1.03, respectively. The ratio of the MBF in the superior macular area to the inferior area was 1.01 for the right eyes and 1.04 for the left eyes.
Conclusions: Because no significant differences were found in the MBF between the two eyes and between the superior and inferior macular areas in the same eye, interocular (for example, affected eye versus fellow eye) and intraocular (superior versus inferior macular areas) comparisons of MBF can be made to determine if changes in retinal perfusion have occurred.
Keywords: retinal blood flow, macula
More and more attention has been focused on the impairment of tissue blood flow in the pathogenesis of retinal diseases1–5 and optic nerve diseases.6–10 Therefore, quantification of ocular blood flow, especially by non-invasive methods, has become essential in assessing and managing patients with retinal diseases and impaired ocular tissue perfusion.
There have been a number of investigations on ocular circulation using various techniques, each of which has advantages and disadvantages.1–10 Among these, the Heidelberg retinal flowmeter (HRF, Heidelberg Engineering, Heidelberg, Germany) has been used to measure retinal tissue blood flow from which accurate haemodynamic properties can be obtained. This technique combines a laser Doppler flowmeter with a scanning laser ophthalmoscopic system. Using a two dimensional measurement of the perfusion determined by the Doppler shift, it is possible to obtain reproducible and quantitative values of the capillary blood flow in distinct areas of a capillary meshwork of the retina and optic nerve head.5,11
A recently developed computer program, called the automatic full field perfusion image analyser (AFFPIA), can be used to perform a full field analysis of images obtained with the HRF. This program incorporates a method of deleting recordings containing saccades from the analysis which then reduces the rate of image rejections.12
Clinical studies have shown significant impairment of ocular blood flow in some retinal or optic nerve diseases.1–10 In some of these studies, the ocular blood flow measurements in the involved eye were compared with the flow in the fellow eye. This method is based on the hypothesis that the interocular blood flow in the two eyes is not statistically different. The blood flow in the ophthalmic artery and the central retinal artery has been reported to be symmetrical during the neonatal period and in adults,13,14 and several studies have shown that no significant interocular differences in perfusion are present.15–19
The aim of this study was to compare the retinal capillary perfusion of the right and left eyes in the macular area of healthy volunteers using the HRF with AFFPIA. In addition, we compared the retinal capillary perfusion in the superior and inferior macular regions.
SUBJECTS AND METHODS
Twenty healthy subjects, five men and 15 women aged 18–42 years (mean 23.5 (SD 5.9)) years were studied. The experiments were performed according to the guidelines of the Declaration of Helsinki and, after explaining the purpose of the study, a signed informed consent was obtained from all subjects. All subjects underwent a thorough ophthalmological examination, including visual acuity, intraocular pressure (IOP) measurements, and slit lamp biomicroscopy. All had corrected visual acuity of at least 20/20, IOP below 21 mm Hg, and a normal retina and optic disc in both eyes. Subjects were excluded if they had undergone intraocular or laser surgery, had evidence of an eye infection, any history of systemic or ophthalmological disease or family history of diabetes or glaucoma, taken any medications within 2 weeks of the study, had a distance refractive error (spherical equivalent) of more than 6.0 dioptres, an astigmatism of more than 2.0 dioptres, and an interocular IOP difference >3 mm Hg, or refractive error difference >2.0 dioptres.
After the IOPs were measured by applanation tonometry, blood flow measurements were performed on both eyes by scanning laser Doppler flowmetry (SLDF) using the HRF. The areas measured were the superior and inferior areas around the nasal macula (Fig 1). The mean blood flow (MBF) was calculated by AFFPIA.
Figure 1.
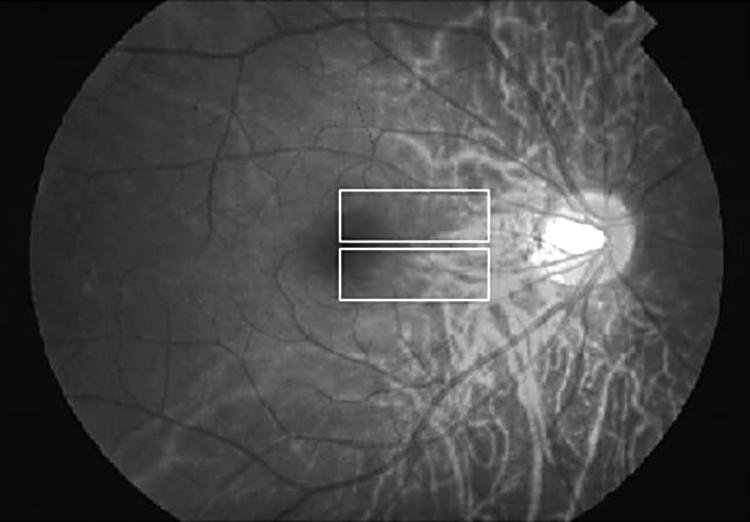
Measurement regions (10°×2.5°) around the macula divided into superior and inferior areas. Each measurement was performed three or more times and analysed by scanning laser Doppler flowmetry.
The principle, validity, and reliability of the SLDF technique to measure ocular blood flow have been published.11,20 The SLDF data included the measurement of a 10°×2.5° retinal area with 256 points ×64 lines. The pixelation of the instrument was 10 μm with a wavelength of 795 nm, an intensity of 100 μW, and a data acquisition time 2.048 seconds. Every line was scanned 128 times with a line sampling rate of 4000 Hz. The final data set contained 128 discrete recordings at each pixel, and the data were converted into a continuous wave function for each pixel.
The signals were fast Fourier transformed to obtain the power spectrum of the multiple frequency shift components. Images were included automatically by AFFPIA if the direct current (DC) value within the measurement area was between 40 and 228 arbitrary units. With confocal scanning laser flowmetry, a power spectrum was computed for each pixel.8 This spectrum enabled the operator to compute the variables of blood volume, flow, and velocity. Because these three values are highly correlated,16 only the blood flow parameter was analysed. The values are given in arbitrary units (AU) obtained from AFFPIA.
Blood flow measurements were obtained from at least three recordings for each eye in each session by the same experienced investigator, and three good quality images for each session were selected for statistical analysis. The order of taking the images was, superior and inferior areas in right eye, and superior and inferior areas in left eye. All measurements were made without pupillary dilatation. Subjects were instructed to use the fellow eye to fixate a static target positioned approximately 2 metres away during the measurements. Several mapped images were then acquired sequentially with the focus on the superficial retina. All images were reviewed by the same observer. Poor quality images, mainly due to gross eye movements and poor fixation, were excluded from the analysis.
The MBF was calculated with AFFPIA as an indicator of tissue microcirculation in the area around nasal macula that avoided ophthalmoscopically visible vessels. The relative MBFs of the right eye to the left eye (R/L), and the superior to inferior area (S/I) were evaluated.
STATISTICAL METHODS
For all measurements, the mean (SD) and the range of the results were calculated. The coefficients of variation (SD/mean×100% (CV)) were used to evaluate the reproducibility of the measurements. Spearman’s correlation coefficient analysis and Wilcoxon signed rank test were used to evaluate the differences of the IOP and the MBF between the right and left eyes. The MBF values in the superior and inferior portion were compared using Wilcoxon signed rank test. Additionally, the MBF in each region was correlated with the age and IOP using Spearman’s correlation coefficient analysis. A p value of <0.05 was considered statistically significant.
RESULTS
The IOPs in all subjects ranged from 10–16 (mean 12.3 (SD 1.7)) mm Hg in the right eye, and from 10–15 (12.4 (1.7)) mm Hg in the left eye. The IOPs in the two eyes were highly correlated (r = 0.796, p = 0.0005).
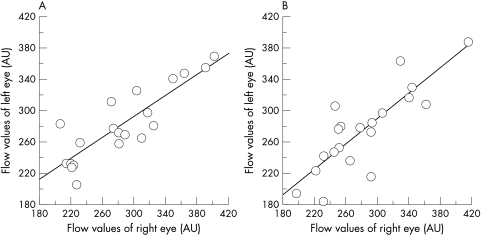
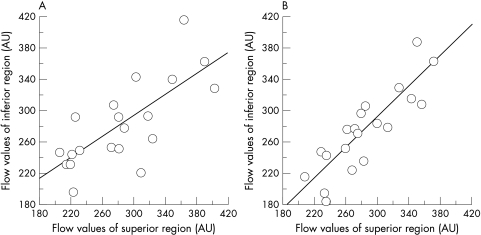
The MBF in each area is shown in Table 1. No significant difference was found in the MBF between superior and inferior areas in each eye (p >0.05 in both eyes). The MBF in the right eye was highly correlated with the MBF in the left eye in the superior (r = 0.747, p = 0.0011; Fig 2A) and the inferior (r = 0.797, p = 0.0005; Fig 2B) nasal paramacular areas. In addition, the correlation of the MBF between the superior and inferior nasal paramacular areas in each eye was also highly significant (r = 0.720, p = 0.0017 in the right eye; Fig 3A, and r = 0.877, p = 0.0001, in the left eye; Fig 3B).
Table 1.
Mean blood flow (MBF) values
| Right eye | Left eye | R/L ratio | |
| Superior area | 283.81 (60.40) (AU) | 282.63 (46.64) (AU) | 1.00 (0.11) |
| Inferior area | 282.01 (54.12) (AU) | 275.17 (52.20) (AU) | 1.03 (0.13) |
| S/I ratio | 1.01 (0.15) | 1.04 (0.11) |
AU = arbitrary units.
Data are expressed as mean (SD). R/L = ratio of the right eye to the left eye. S/I = ratio of the superior area to inferior area. No significant difference was found in the MBF between both eyes in both superior (p = 0.627) and inferior (p = 0.351) areas. No significant difference was found in the MBF between superior and inferior areas in each eye (p = 0.765 in right eye and p = 0.316 in left eye).
Figure 2.
(A) Correlation of the MBFs of the right and left eyes in the superior paramacular area. The MBFs in both eyes are significantly correlated. (B) Correlation of the MBFs between the right and left eyes in the inferior paramacular area. The MBFs in both eyes are significantly correlated.
Figure 3.
(A) Correlation between the MBF in the superior and inferior areas of the right eye. The MBFs in both areas are significantly correlated. (B) Correlation between the MBF in the superior and inferior areas of the left eye. The MBFs in both areas are significantly correlated.
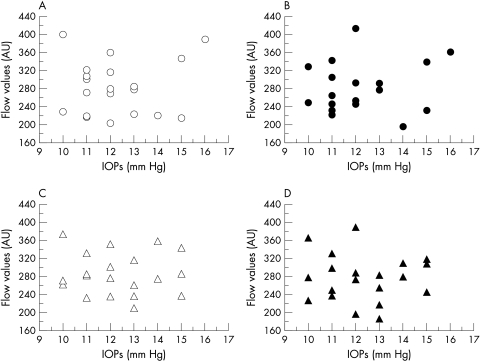
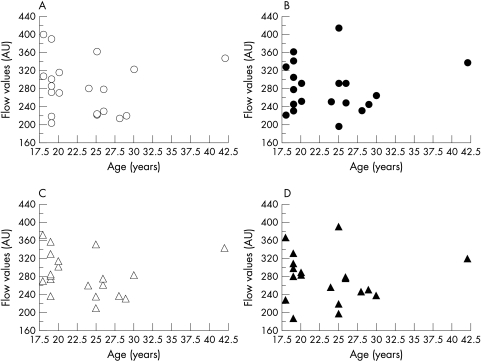
The MBF in each area was not significantly correlated with the IOP (Fig 4) or with the age (Fig 5). The coefficients of variation demonstrated good reproducibility of the measurements—that is, 4.92% in superior areas and 7.21% in inferior areas in right eye, and 7.74% and 7.74% in left eye.
Figure 4.
Correlation between IOP and MBF. (A) Superior macula in the right eye, (B) inferior macula in the right eye, (C) superior macula in the left eye, (D) inferior macula in the left eye. No significant correlation was found between MBF and IOP in each area.
Figure 5.
Correlation between age and MBF. (A) Superior macula in the right eye, (B) inferior macula in the right eye, (C) superior macula in the left eye, (D) inferior macula in the left eye. No significant correlation was found between MBF and age in each area.
DISCUSSION
Attention has been focused on the changes of retinal blood flow in some retinal diseases to try to determine the aetiology and severity of the disease process, and also to evaluate the outcome of medical and/or surgical therapy.5,21,22 In order to compare the blood flow in the diseased eye to that in the fellow eye, standard data from the two eyes of normal healthy subjects are required. As such, Rawji and Flanagan19 recently showed that there were no significant interocular differences in the retinal capillary perfusion. Their data were obtained by SLDF and the capillary volume, flow, and velocity were recorded for all images using a 10×10 pixel measurement frame avoiding areas with large vessels. Although many investigators have used this experimental protocol,3,5,6,8–10,19,23,24 the perfusion in different areas was found to vary considerably, and was dependent on the user defined measurement window.25,26 In addition, the pulse phase analysed is an important source of bias even when a large number of measurements are made with the exclusion of poor quality images.8,9,19 Another concern in this protocol is the rate of poor quality images that result from poor fixation due to poor vision in the fixating eye or from media opacities even when the images are obtained by a skilled operator. In most reports using this experimental protocol, parts of the images, up to around 50%, were excluded from the analysis because of poor quality caused by eye movements or media opacities.8,9,19 Moreover, a small (10×10) pixel frame might not be a large enough sampling window to overcome the physiological variability in blood flow across the retina. This sentiment has been expressed in previous reports.7,27
We used AFFPIA to minimise the bias caused by the heart beat associated pulsation and the spatial heterogeneity. In addition, we were careful in our exclusion criteria. Thus, we have evaluated the capillary perfusion around the nasal macula in the right and left eyes of healthy volunteers using the SLDF with AFFPIA, and the reproducibility at all locations was quite satisfactory and comparable to that of previous reports.9,28
Some investigators have reported that the blood flow velocities of the ophthalmic artery, central retinal artery, and central retinal vein were weakly or not correlated with age.9,14,19,24,29 In addition, when the retinal or optic nerve head microcirculation was evaluated using SLDF, there were varying results.9,10,18,19,24,29 Our findings showed no significant correlation between MBF and age. This may be because our subjects were younger than 42 years and the range of ages was limited. Further studies with a large number of healthy subjects of different ages will be needed to determine whether age affects the MBF.
Studies examining the correlation of ocular circulation between superior and inferior retinal region have produced varying results.3,15,30,31 Yoshida et al31 noted that the blood flow in the superior temporal artery was higher than the inferior temporal artery. Feke and associates30 found the blood flow of the inferior retina was, on average, 6% greater than the flow of the superior retina but this difference was not significant. Schwartz et al15 reported that the blood flow in the inferior temporal artery was significantly greater than that in the superior temporal artery, but no significant differences were found for the inferior nasal artery compared to the superior nasal artery by fluorescein angiography with scanning laser ophthalmoscopy. Squirrell et al3 reported that blood flow in the superior and inferior areas obtained by SLDF was significantly different around the macula in the three of 10 normal subjects. Our study is basically about microcirculation and free from previous findings on arterial blood flow. Our results strongly suggest that microcirculation of the superior area did not differ significantly from that in the inferior area around the macula. The discrepancy between these findings and those of Squirrell et al3 might be partly explained by the differences in the area analysed. As they suggested, the significant difference in blood flow between the two areas of normal retinas supports the idea that SLDF scans deeper than these has been assumed and may actually analyse both the retinal and choroidal capillary beds. In that case, both their data and our blood flow data around the macula reflect the contributions of the rich choriocapillaris, and the findings are dependent on any thinning of the retina in the analysed region.
As the sampling depth of the HRF is 300 μm, thinning of the retina, such as in the foveal and peripapillary area and of the neuroretinal rim, can cause the instrument to measure the deeper layers (for example, choriocapillaris) and not exclusively the retinal capillary bed.3,10,18,19 Measuring the retinal thickness at the location of interest might help resolve this problem.
In the foveola (about 350 μm in diameter), where the retina is very thin (about 130 μm) and avascular, the contribution from the choroidal circulation and/or the offset value of the HRF instrument might be involved. In the current study, we placed the centre of foveola at the edge of the measurement area (10°×2.5°) as shown in Figure 1. Assuming that the measurement area of 10°×2.5° is equal to 2.7×0.7 mm, and the diameter of foveola is 350 μm, the percentage of foveola in the measurement area is about 1.27%. Thus, the contribution of the foveola in this study is very small.
Doppler ultrasound studies of the blood velocities in the ophthalmic artery and central retinal artery and vein in healthy subjects showed that no significant difference exists between the right and left eyes.14,32 Recently, Rawji and Flanagan19 and Boehm et al18 reported that there were no significant interocular differences in retinal and peripapillary capillary perfusion using SLDF. Our data confirmed their findings. All of the values in our study showed a difference between the two eyes of 11% to 13% which can be used as an index of the interocular variability in healthy eyes of young individuals without significant ametropia. However, the exact value of the technique should be interpreted in the light of the concerns mentioned. The mean flow from the entire image is significantly less variable compared with that from a particular area—for example, 10×10 pixels.25 Therefore, AFFPIA is a useful tool to evaluate the tissue MBF with less bias, and thus the present data can serve as a useful starting point for studies of the relation between ocular circulation and some retinal diseases.
REFERENCES
- 1.Kadonosono K, Itoh N, Ohno S. Perifoveal microcirculation before and after vitrectomy for diabetic cystoid macular edema. Am J Ophthalmol 2000;130:740–4. [DOI] [PubMed] [Google Scholar]
- 2.Ohnishi Y, Fujisawa K, Ishibashi T, et al. Capillary blood flow velocity measurements in cystoid macular edema with the scanning laser ophthalmoscope. Am J Ophthalmol 1994;117:24–9. [DOI] [PubMed] [Google Scholar]
- 3.Squirrell DM, Watts A, Evans D, et al. A prospective evaluation of the Heidelberg retina flowmeter in diagnosing ischaemia following branch retinal vein occlusion: a masked, controlled comparison with fluorescein angiography. Eye 2001;15:261–6. [DOI] [PubMed] [Google Scholar]
- 4.Shinoda K, Kimura I, Eshita T, et al. Microcirculation in the macular area of eyes with an idiopathic epiretinal membrane. Graefes Arch Clin Exp Ophthalmol 2001;239:941–5. [DOI] [PubMed] [Google Scholar]
- 5.Avila CP Jr, Bartsch DU, Bitner DG, et al. Retinal blood flow measurements in branch retinal vein occlusion using scanning laser Doppler flowmetry. Am J Ophthalmol 1998;126:683–90. [DOI] [PubMed] [Google Scholar]
- 6.Harju M, Vesti E. Blood flow of the optic nerve head and peripapillary retina in exfoliation syndrome with unilateral glaucoma or ocular hypertension. Graefes Arch Clin Exp Ophthalmol 2001;239:271–7. [DOI] [PubMed] [Google Scholar]
- 7.Chung HS, Harris A, Kagemann L, et al. Peripapillary retinal blood flow in normal tension glaucoma. Br J Ophthalmol 1999;83:466–9. [DOI] [PMC free article] [PubMed] [Google Scholar]
- 8.Nicolela MT, Hnik P, Drance SM. Scanning laser Doppler flowmeter study of retinal and optic disk blood flow in glaucomatous patients. Am J Ophthalmol 1996;122:775–83. [DOI] [PubMed] [Google Scholar]
- 9.Hollo G, van den Berg TJ, Greve EL. Scanning laser Doppler flowmetry in glaucoma. Int Ophthalmol 1996–97;20:63–70. [DOI] [PubMed] [Google Scholar]
- 10.Hollo G, Greve EL, van den Berg TJ, et al. Evaluation of the peripapillary circulation in healthy and glaucoma eyes with scanning laser Doppler flowmetry. Int Ophthalmol 1996–97;20:71–7. [DOI] [PubMed] [Google Scholar]
- 11.Michelson G, Schmauss B. Two dimensional mapping of the perfusion of the retina and optic nerve head. Br J Ophthalmol 1995;79:1126–32. [DOI] [PMC free article] [PubMed] [Google Scholar]
- 12.Michelson G, Welzenbach J, Pal I, et al. Automatic full field analysis of perfusion images gained by scanning laser Doppler flowmetry. Br J Ophthalmol 1998;82:1294–300. [DOI] [PMC free article] [PubMed] [Google Scholar]
- 13.Romagnoli C, Papacci P, Zecca E, et al. Normal neonatal values of ophthalmic and central retinal artery blood flow velocities. J Pediatr Ophthalmol Strabismus 2001;38:213–7. [DOI] [PubMed] [Google Scholar]
- 14.Rojanapongpun P, Drance SM. Velocity of ophthalmic arterial flow recorded by Doppler ultrasound in normal subjects. Am J Ophthalmol 1993;115:174–80. [DOI] [PubMed] [Google Scholar]
- 15.Schwartz B, Harris A, Takamoto T, et al. Regional differences in optic disc and retinal circulation. Acta Ophthalmol Scand 2000;78:627–31. [DOI] [PubMed] [Google Scholar]
- 16.Griesser SM, Lietz A, Orgul S, et al. Heidelberg retina flowmeter parameters at the papilla in healthy subjects. Eur J Ophthalmol 1999;9:32–6. [DOI] [PubMed] [Google Scholar]
- 17.Nicolela MT, Hnik P, Schulzer M, et al. Reproducibility of retinal and optic nerve head blood flow measurements with scanning laser Doppler flowmetry. J Glaucoma 1997;6:157–64. [PubMed] [Google Scholar]
- 18.Boehm AG, Pillunat LE, Koeller U, et al. Regional distribution of optic nerve head blood flow. Graefes Arch Clin Exp Ophthalmol 1999;237:484–8. [DOI] [PubMed] [Google Scholar]
- 19.Rawji MH, Flanagan JG. Intraocular and interocular symmetry in normal retinal capillary perfusion. J Glaucoma 2001;10:4–12. [DOI] [PubMed] [Google Scholar]
- 20.Michelson G, Schmauss B, Langhans MJ, et al. Principle, valdity, and reliability of scanning laser Doppler flowmetry. J Glaucoma 1996;5:99–105. [PubMed] [Google Scholar]
- 21.Nagahara M, Tamaki Y, Araie M, et al. Effects of scleral buckling and encircling procedures on human optic nerve head and retinochoroidal circulation. Br J Ophthalmol 2000;84:31–6. [DOI] [PMC free article] [PubMed] [Google Scholar]
- 22.Ishikawa K, Kimura I, Shinoda K, et al. In situ confirmation of retinal blood flow improvement after carotid endarterectomy in a patient with ocular ischemic syndrome. Am J Ophthalmol 2002;134:295–7. [DOI] [PubMed] [Google Scholar]
- 23.Lubeck P, Orgul S, Gugleta K, et al. Effect of timolol on anterior optic nerve blood flow in patients with primary open-angle glaucoma as assessed by the Heidelberg retina flowmeter. J Glaucoma 2001;10:13–7. [DOI] [PubMed] [Google Scholar]
- 24.Groh MJ, Michelson G, Langhans MJ, et al. Influence of age on retinal and optic nerve head blood circulation. Ophthalmology 1996;103:529–34. [DOI] [PubMed] [Google Scholar]
- 25.Kagemann L, Harris A, Chung HS, et al. Heidelberg retinal flowmetry: factors affecting blood flow measurement. Br J Ophthalmol 1998;82:131–6. [DOI] [PMC free article] [PubMed] [Google Scholar]
- 26.Bohdanecka Z, Orgul S, Prunte C, et al. Influence of acquisition parameters on hemodynamic measurements with the Heidelberg retina flowmeter at the optic disc. J Glaucoma 1998;7:151–7. [PubMed] [Google Scholar]
- 27.Hosking SL, Embleton SJ, Cunliffe IA. Application of a local search strategy improves the detection of blood flow deficits in the neuroretinal rim of glaucoma patients using scanning laser Doppler flowmetry. Br J Ophthalmol 2001;85:1298–302. [DOI] [PMC free article] [PubMed] [Google Scholar]
- 28.Michelson G, Langhans MJ, Groh MJ M. Perfusion of the juxtapapillary retina and the neuroretinal rim area in primary open angle glaucoma. J Glaucoma 1996;5:91–8. [PubMed] [Google Scholar]
- 29.Alm A. Ocular circulation. In: Hart HM, ed. Adler’s physiology of the eye, 9th ed. St Louis: Mosby-Year Book, 1992:198–227.
- 30.Feke GT, Tagawa H, Deupree DM, et al. Blood flow in the normal human retina. Invest Ophthalmol Vis Sci 1989;30:58–65. [PubMed] [Google Scholar]
- 31.Yoshida A, Feke GT, Ogasawara H, et al. Retinal hemodynamics in middle-aged normal subjects. Ophthalmic Res 1996;28:343–50. [DOI] [PubMed] [Google Scholar]
- 32.Papacci P, Romagnoli C, Favuzzi A, et al. Doppler ultrasound of blood flow velocities in ophthalmic and central retinal arteries during the early neonatal period. Am J Ophthalmol 1998;126:691–7. [DOI] [PubMed] [Google Scholar]


