

Abstract
Fibronectin (FN) isoform expression is altered during chondrocyte commitment and maturation, with cartilage favoring expression of FN isoforms that include the type II repeat extra domain B (EDB) but exclude extra domain A (EDA). We and others have hypothesized that the regulated splicing of FN mRNAs is necessary for progression of chondrogenesis. To test this, we treated the pre-chondrogenic cell line ATDC5 with transforming growth factor -β1, which has been shown to modulate expression of the EDA and EDB exons, as well as the late markers of chondrocyte maturation; it also slightly accelerates the early acquisition of a sulfated proteoglycan matrix without affecting cell proliferation. When chondrocytes are treated with TGF-β1, the EDA exon is preferentially excluded at all times whereas the EDB exon is relatively depleted at early times. This regulated alternative splicing of FN correlates with regulation of alternative splicing of SRp40, a splicing factor facilitating inclusion of the EDA exon. To determine if overexpression of the SRp40 isoforms altered FN and FN EDA organization, cDNAs encoding these isoforms were overexpressed in ATDC5 cells. Overexpression of the long-form of SRp40 yielded a FN organization similar to TGF-β1 treatment; whereas overexpression of the short form of SRp40 (which facilitates EDA inclusion) increased formation of long-thick FN fibrils. Therefore, we conclude that the effects of TGF-β1 on FN splicing during chondrogenesis may be largely dependent on its effect on SRp40 isoform expression.
Keywords: Fibronectin, TGF-β1, SRp40, alternative splicing, collagen type II, collagen type I, Alcian blue
INTRODUCTION
Fibronectin (FN) is a fibril-forming, dimeric glycoprotein that, upon engagement of its integrin receptors, influences cellular signaling, adhesion, and migration [1]. Depending on the species, multiple isoforms (>10) of the protein are expressed through alternative splicing of two exons, termed EDA (or EIIIA) and EDB (or EIIIB), and one variable region, referred to as either V or IIICS. In vitro studies using mini-genes containing the individual exons have suggested exon-specific functions[2–4]and our interests have centered on the regulated splicing of the EDA and EDB exons during chondrogenesis. In the process of chondrocyte differentiation, fibronectin and collagen type II undergo alternative splicing to result in maturation-dependent changes in ECM composition. In the case of fibronectin, this switch has been suggested to be important for the induction and maintenance of the mature chondrocytic phenotype[5].
Specifically, the embryonic mesoderm expresses a FN isoform that includes EDA and EDB (FN A+B+). During condensation, the maturing cartilage switches to production of FN isoforms that exclude the EDA exon and are enriched for inclusion of the EDB exon (FN A–B+)[6, 7], suggesting that loss of the EDA exon is associated with chondrocyte maturation [8]. Specifically, the presence of this EDA exon facilitates cell spreading, which is characteristic of undifferentiated chondrocytes [3, 9]. The change in FN isoform production appears to have an effect on the differentiation of the resident cells of these tissues. This is reproduced in vitro as embryonic limb bud mesenchymal cells, when plated on the different FN isoforms, exhibit modulation of their chondrogenic potential [10]. Although the endogenous signals that modulate the switch in isoform are unknown, the splicing factor SRp40 plays a critical role in determining EDA inclusion[11][Liang, et al., accompanying ms]. Interestingly, SRp40 is also alternatively spliced, where the short form stimulates the inclusion of EDA during FN RNA splicing, while the long form of SRp40 decreases the amount of FN A+, without a concomitant increase in FN A-. Thus, while the short form facilitates inclusion of the EDA exon, the actions of the long form to inhibit this inclusion could be either due to RNA splicing or to FN RNA expression [Liang, et al., accompanying ms].
In cells in culture, transforming growth factor-β1 (TGF-β1) has been used to induce chondrogenesis [12–14]. Some studies have demonstrated that TGF-β treatment favors retention of the FN EDA exon [15–19]. In our studies using a pre-chondrocytic cell line, TGF-β1 promotes the loss of the EDA exon in the absence of chondrogenic stimuli (insulin, transferrin, selenium, (ITS)) [20]. If, in fact, loss of the EDA exon is an important step during chondrogenesis, our studies suggest that TGF-β1 should promote acquisition of an early chondrocyte phenotype.
The goal of this study is to determine the effects of TGF-β1 on the maturation-dependent expression of the different FN isoforms in cells that are committed chondrocytes. Furthermore, we measure the effects of TGF-β1 on SRp40 isoform expression to determine if this may be a control point for FN splicing. Finally, we overexpress the cDNAs encoding the SRp40 proteins and ask if this overexpression affects FN and FN EDA organization in the presence and absence of TGF-β1.
METHODS
Cell Culture
ATDC5 cells were routinely grown in Dulbecco’s Modified Eagle Medium (DMEM) Ham’s F-12 (1:1) (Invitrogen, San Diego, CA) containing 5% Fetal Bovine Serum (FBS) (Atlanta Biologicals, Atlanta, GA), and maintained at 37°C and 5% CO2. ATDC5 cells were inoculated into 6 well plastic cell culture plates (Corning, Corning, NY), and maintained in DMEM/Ham’s F-12 (1:1) containing 5% FBS at 37°C and 5%CO2 until confluence. After confluence, plates were separated into four groups and cultured as follows: (Group 1): DMEM/Ham’s F-12 (1:1) containing 5% FBS, 37°C, 5%CO2 as a control; (Group 2): α-Modified Eagle Medium (αMEM) (Invitrogen, San Diego, CA) containing 5% FBS, 37°C, 3%CO2; (Group 3) α-Modified Eagle Medium (αMEM) (Invitrogen, San Diego, CA) containing 5% FBS and ITS (10 μg/mL bovine insulin (I), 10 μg/mL human transferrin (T), 3x10⁻⁸ mol/L sodium selenite (S)) (Biowhittaker, Walkersville, MD), 37°C, 3%CO2; (Group 4) αMEM containing 5% FBS, ITS, and 1 or 10 ng/ml human transforming growth factor β1 (TGF-β1, Atlanta Biologicals, Atlanta, GA), 37°C, 3%CO2. The cells proliferate as pre-chondrocytic mesenchymal cells when cultured in the pre-chondrogenic maintenance medium (serum-containing DMEM/F-12), or in the medium permissive for chondrogenesis (serum-containing α-MEM); addition of ITS is necessary for the cells to assume a chondrogenic phenotype [21]. Medium is refreshed every three days.
Alcian blue staining
Cells were washed in PBS, fixed in 4% formalin in PBS for 10 min, and incubated with 1% Alcian Blue (Fluka, Buchs, Switzerland) in 0.1 N HCl overnight at room temperature. Plates were rinsed with PBS and extent of staining measured by digital imaging. The amount of Alcian blue staining was also determined spectrophotometrically after solubilization. Alcian blue was extracted from cultures by overnight incubation of wells with 6M Guanidine-HCl, followed by measurement of absorbance at 620 nm[22].
RNA Extraction and Transcription-Polymerase Chain Reaction
Total RNA was isolated from ATDC5 cells (Qiagen RNeasy kit (Qiagen, Chatsworth, CA)), 1.0 μg was reverse transcribed into cDNA (SuperScript First-Stand Synthesis System (Invitrogen, San Diego, CA)), and amplified in 50 μL of PCR reaction. Primers are listed in Table 1, with amplification conditions in Table 2. PCR products were fractionated by electrophoresis in 1% agarose gels containing ethidium bromide, and sizes compared to pGEM DNA markers (Promega, Madison WI). Images were recorded digitally and relative densities determined using the Scion Image Program (Scion Technologies, Inc.).
Table 1.
Amplification primers:
| Name | Forward (5’ – 3’) | Reverse (5’ – 3’) | Ref |
|---|---|---|---|
| Collagen type I, (col α1 (I)) | GAATTCGGACTAGACATTG | GGTAAGGTTGAATGCACT | |
| Collagen type II, (col α1(II)), | GTGAGCCATGATCCGC | GACCAGGATTTCCAGG | 489bp
285bp |
| SR protein40 (SRp40) | GAATTTATCCTCAAGAGTCAG | ACTTCTGGTCCGAGATCGTGA | |
| FN EDA exon | GAAATGACCATTGAAGGTTTG | TTCTTTCATTGGTCCTGTCTT | [42] |
| FN EDB exon | CATGCTGATCAGAGTTCCTG | GGTGAGTAGCGCACCAAGAG | [42] |
| β-actin | GTGCTATGTTGCCCTGGATT | TGCTAGGGCTGTGATCTCCT |
Table 2.
Amplification conditions.
| Denaturation | Annealing | Extension | Cycles | ||||
|---|---|---|---|---|---|---|---|
| Col α1(I) | 94°C | 1 min | 47°C | 1.5 min | 72°C | 1 min | 26, 27 |
| Col αI(II) | 94°C | 1 min | 48°C | 1.5 min | 72°C | 1 min | 30,33 |
| SRp40 | 94°C | 1 min | 55°C | 1.5 min | 72°C | 1 min | 27,28,30 |
| FN EDA | 94°C | 1 min | 50°C | 1.5 min | 72°C | 1 min | 28,35 |
| FN EDB | 94°C | 1 min | 53°C | 1.5 min | 72°C, | 1 min | 28,35 |
| β-actin | 94°C | 1 min | 55°C | 1.5 min | 72°C | 1 min | 20 |
DNA Measurement
ATDC5 proliferation was measured based on cellular DNA content using the PicoGreen dsDNA quantitation kit (Molecular Probes, Eugene, OR); PicoGreen binds to double-stranded DNA to yield a fluorescent signal that is proportional to DNA content. ATDC5 cells (5000, 1000, 500, 100/well) were incubated in 96-well, flat-bottom plates (Corning, Corning, NY) and cultured in αMEM + ITS containing 5%FBS and 0, 1 or 10 ng/ml TGF-β1. Cells were harvested, lysed, and fluorescence measured, relative to a standard curve of DNA concentration using SpectraFluorPlus (Tecan, Austria) plate reader.
Transfection
Plasmid pCG-SRp40 (kind gift of Dr. Gavin Screaton at Univ. Oxford[23]) which encodes the short isoform of SRp40 or pCG-SRp40LF in which sequences within pCG-SRp40 were mutated to correspond to the alternatively spliced long isoform [Liang, et al., accompanying ms] were co-transfected with either CMV-β–galactosidase or CMV-green fluorescent protein (GFP) into ATDC5 monolayers (70–80% confluent) that were cultured in DMEM/F-12. After transfection, plates (or for the case of cells examined by SEM, Thermanox cover slips) were cultured in α-MEM ± ITS, ± 1ng/mL or 10ng/mL TGF-β1. A total of 1.2 μg of plasmid DNA was transfected using the FuGENE 6 transfection reagent (Roche, Indianapolis, IN).
Immunofluorescence
Cells were fixed in 4% paraformaldehyde in PBS for 10 min, 25°C, followed by two PBS washes, and storage in 70% ethanol, 4°C until staining. Prior to staining, fixed cells were rinsed with PBS, permeabilized with 0.1% Triton X-100 in PBS, 10 min, 25°C, rinsed twice with PBS, and non-specific binding blocked with 4% FBS in PBS for 2 min, followed by replacement with fresh solution for 30 min, both at 25°C. The slides were then incubated with either the mouse monoclonal fibronectin EDA antibody (1:200, ICN Biochemicals) or the goat polyclonal human fibronectin antibody (1:200, ICN Biochemicals) for 60 min, 25°C, rinsed three times with 4% FBS in PBS (2 min each rinse), followed by incubation with either TRITC-conjugated anti-mouse IgG or anti-goat IgG (1:2000, Sigma-Aldrich, St. Louis, MO), 30 min, 25°C. Stained slides were rinsed with DI H2O, mounted with Aquamount (Fisher), and imaged using epifluorescence. Images were deconvolved using the AutoDeblur + AutoVisualize Program (AutoQuant Imaging, Inc.) and overlaid images assembled using Image-Pro Plus (Media Cybernetics).
β-Galactosidase Staining
Cultures that had been transfected with the β-galactosidase expression vector were fixed with 1% formaldehyde in PBS, 5 min, and washed 3X with PBS. Fixed samples were then incubated in 0.4 mg/ml 5-bromo-4-chloro-3-indoyl-β-D-galactopyranoside (X-gal)/2 mM MgCl2/6 mM potassium ferrocyanide/6 mM potassium ferricyanide in PBS for 1–2 h, washed 2X in PBS, and stored in PBS, 4°C until imaging.
Scanning Electron Microscopy (SEM)
Transfected cells on Thermonox cover slips were stained for β-galactosidase and images of blue, transfected cells digitally recorded using a dissecting microscope. During this process, the cover slips were reference marked using a scalpel blade to notch the perimeter of the coverslip and a 22 gauge needle was used to mark the area of interest. These reference marks were then placed on the overall digital image of the coverslip to allow later identification of transfected cells in the SEM. Coverslips were then fixed with a 1:1 ratio of modified Karnovsky’s Fixative (1:1 ratio of 5% glutaraldehyde: 4% paraformaldehyde, in PBS, pH 7.4) overnight, room temperature. After fixation, coverslips were dehydrated using a graded ethanol series. After the final 100% ethanol step, the ethanol was replaced with Freon 113. Samples were dried overnight and mounted on aluminum stubs (25 mm diam x 9 mm) and sputter coated with ~100Å of elemental gold. The sputter coated samples were then placed in the SEM and the exact same cell fields located using the reference markings.
Data Analysis
All gels were digitally imaged and assembled using Adobe PhotoShop. Within any series, all adjustments were made in parallel to gels within this series. Statistical significance was determined using a two-way analysis of variance (ANOVA) with time and treatment as covariates. A Tukey multiple comparison procedure was used to determine differences between groups. Each experiment shown is a representative experiment and each experiment had values determined independently at least twice from any RNA sample, with all RNA samples derived from at least two independent experiments.
RESULTS
To test the effects of TGF-β1 on chondrocyte maturation and FN splicing, ATDC5 cells were maintained in αMEM containing ITS in the presence of TGF-β1. As controls, ATDC5 cells were cultured in DMEM/F-12, the medium used to maintain cells in their committed pre-chondrogenic state, or in α-MEM lacking ITS, a condition that does not favor chondrogenesis[21]. Cellular proliferation was measured, as was acquisition of a sulfated proteoglycan matrix and modification of the expression pattern of collagens type I and type II. We tested the hypothesis that TGF-β1 treatment alters FN EDA or EDB inclusion and that this alteration occurs at least partially as a result of changes in SRp40 isoform expression. To further test our hypothesis, plasmids encoding SRp40 isoforms were transfected to determine effects on the organization of the FN matrix.
TGF-β1 does not alter early cell proliferation, but does accelerate early maturation
We first determined the effects of 0, 1 or10 ng/ml TGF-β1 on ATDC5 cell proliferation as measured by total DNA content (expressed relative to the day 1, 0 ng/ml treatment, Table 3). DNA content approximately tripled over the four days of treatment, however no significant differences between TGF-β1 treated and untreated cells were measured.
Table 3.
ATDC5 cell proliferation in the presence of TGF-β1.
| DNA Content* (Normalized to day 1, 0 ng/ml) | |||
|---|---|---|---|
| 0 ng/ml (Ave. ± SEM) | 1 ng/ml (Ave. ± SEM) | 10 ng/ml (Ave. ± SEM) | |
| Day 1 | 1.00 ± 0.39 | 0.96 ± 0.28 | 1.04 ± 0.08 |
| Day 2 | 1.63 ± 0.20 | 1.41 ± 0.25 | 1.65 ± 0.25 |
| Day 3 | 1.71 ± 0.16 | 1.63 ± 0.29 | 1.77 ± 0.42 |
| Day 4 | 2.85 ± 0.86 | 2.54 ± 0.68 | 3.01 ± 0.06 |
Average of 3–4 independent determinations
We next examined the effect of 10 ng/ml TGF-β1 on the acquisition of a sulfated proteoglycan matrix over a 42-day time course (Figure 1; overview 1A; Close-up, 1B; Densitometry of 1A shown in 1C). In the control, non-chondrogenic DMEM/F-12 medium, alcian blue staining was light throughout the time course, with little increase over time. In cells cultured with α-MEM in the absence of ITS, scattered alcian blue staining was apparent especially at the edges of the cultures. In cells cultured in α-MEM + ITS, alcian blue staining was light for the first two weeks. By day 28, clusters of intensely stained cells were visible, and these clusters increased in size by day 42 (see arrow, magnified panel in 1B). In the presence of 10 ng/ml TGF-β1, within the first 14 days, alcian blue staining appeared accelerated relative to controls. After 14 days, in the TGF-β-treated cultures, neither the intensity of staining nor the presence of focal clusters of alcian blue-stained cells were equivalent to cells cultured in the presence of ITS. However, when total alcian blue staining was measured, there were no significant differences in densitometry measurements (Figure 1C). Thus, the inclusion of TGF-β1 early in the culture period appeared to facilitate acquisition of a sulfated matrix; at later time points, inclusion of TGF-β1 suppressed focal cluster formation. These effects are consistent with the known effects of TGF-β1 on chondrogenesis, i.e., an acceleration of early maturation and inhibition of later events[24–26].
Figure 1. TGF-β1 does not affect ATDC5 cell proliferation and accelerates Alcian blue staining.
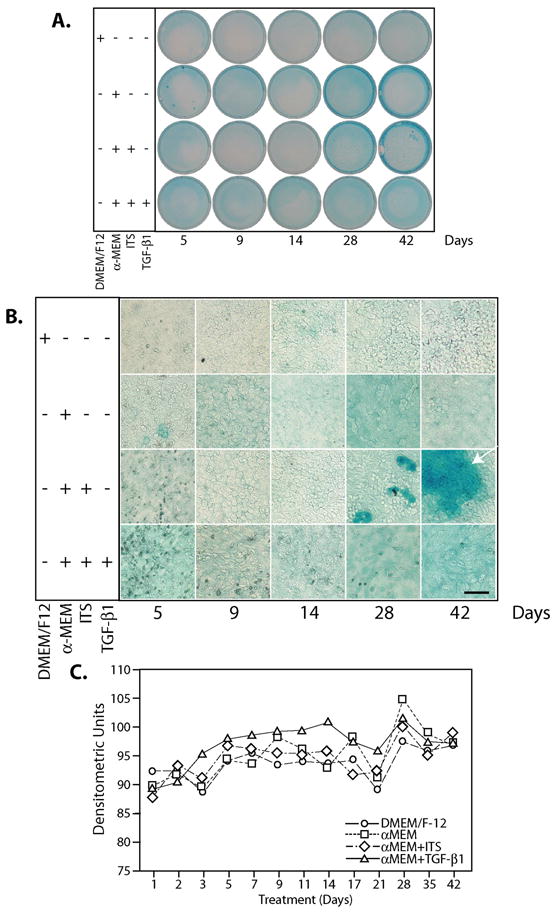
(A) ATDC5 cells were maintained in DMEM/F-12, αMEM, αMEM + ITS or αMEM + ITS +10 ng/ml TGF-β1 for times up to 42 days and sulfated proteoglycan content detected by Alcian blue staining. Representative samples for 5, 9, 14, 28, and 42 days are shown. (B) A magnified view of the Alcian blue staining. Note the focal clusters of intensely stained cells at days 28 and 42 (arrow) in the αMEM + ITS row. Magnification: bar = 100 μm. (C) Relative densities of the stained plates with time. (○) DMEM/F-12; (□)αMEM; (⋄) αMEM + ITS (Δ) α MEM + 10 ng/ml TGF-β1.
We also examined expression of collagen type I and collagen type II (and its isoforms) as a function of TGF-β treatment. As was observed with the alcian blue staining, TGF-β1 treatment during the first 9 days resulted in more marked increases in relative collagen type IIB expression, whereas at later times, expression levels after TGF-β1 treatment remained at low levels comparable to those observed in the non-chondrogenic DMEM/F-12 culture conditions; during this time period, the effects of TGF-β1 were significantly different from those of αMEM or αMEM+ITS (Data not shown, p<0.05). Finally, collagen type I levels tended to decrease with time and TGF-β1 significantly inhibited the increase in collagen type I levels seen in control cells (Data not shown; p<0.05 for values from days 1–11).
Alternative splicing of fibronectin is dependent on TGF-β1 treatment
We next investigated the effects of TGF-β1 on FN isoform expression in cells committed to chondrogenic maturation. FN RNA was amplified by RT-PCR using primers that encompass the EDA or EDB splice sites. The amounts of any particular isoform, as measured by densitometry, were expressed as a percentage of the total amount of FN amplified in that experiment (i.e., ( [FN A+]/([ FN A+] + [FN A-]))x100 ). This representation of FN alternative splicing has been validated as not only accurate but preferable for RT-PCR measurements of exon usage [27]. At two days, levels of EDA-containing FN (FNA) or EDB-containing FN (FNB; Figure 2A) appeared independent of treatment with 1 ng/ml TGF-β1; at 4 days, levels of EDA-containing FN appeared similar to controls where levels of EDB-containing FN appeared to have slightly decreased. TGF-β1 (10 ng/ml) decreased FN EDA (Figure 2Bi) and FN EDB (Figure 2Bii) inclusion at both day 2 and day 4, with larger effects on day 4. These results appeared largely independent of the culturing medium, where DMEM/F-12 served to maintain the pre-chondrocyte state and α-MEM caused induction of chondrogenesis. Thus, TGF-β1 treatment decreased EDA and EDB exon inclusion in a dose-dependent manner at both times tested.
Figure 2. TGF-β1 treatment favors exclusion of the FN EDA and EDB exons and is dose-responsive.
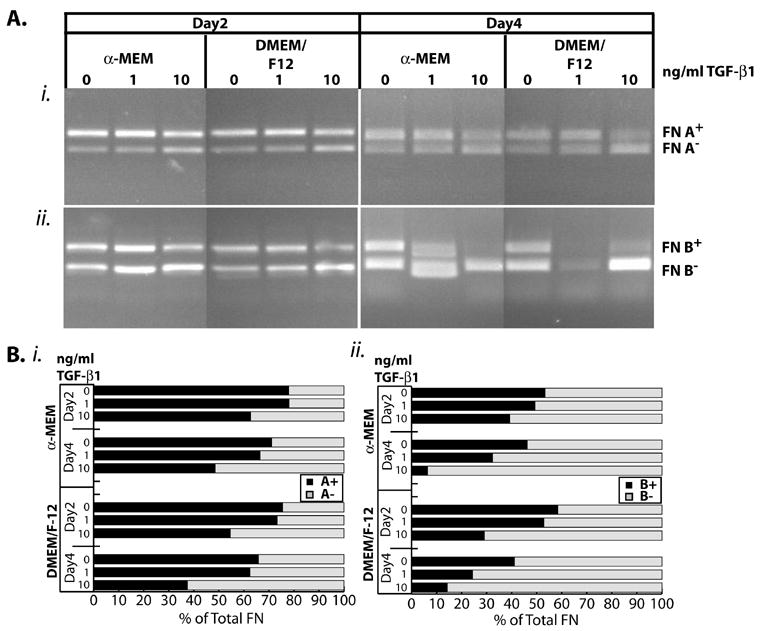
ATDC5 cells were maintained in αMEM + ITS or DMEM/F-12 containing 0, 10, or 10 ng/ml TGF-β1 for 2 or 4 days. RNA was collected and amplified by RT-PCR. (A) Representative gels for effects of TGF-β1 on FN EDA (i) or FN EDB (ii). Inclusion of the exon results in a longer product, designated as FN A+ or FN B+; similarly the exclusion of the exon results in a shorter project labeled FN A- or FN B-. (B) Densitometry of the above gels. Amounts for each of the splice products is expressed as a percentage of the total, i.e., FN A+ = {[FN A+]/([FN A+] + [FN A-])}x100. Both the DMEM/F-12 proliferative conditions and the α-MEM media conditions gave similar responses in the presence of TGF-β1. ■ Percentage of A+ (i) or B+ (ii) containing amplification product; □ Percentage of A- (i) or B- (ii) containing product.
We then tested the effects of TGF-β1 on FN expression over 42 days (Figure 3), a period that allows for the progression through much of the chondrogenic maturation program. After culturing under control conditions (DMEM/F-12, α-MEM, or α-MEM + ITS), the EDA-containing FN isoform remained high; EDB-containing FN remained fairly constant under pre-chondrogenic conditions and decreased over time under chondrogenic conditions. TGF-β1 treatment favored exclusion of the EDA exon as evidenced by RT-PCR (Figure 3A) and by analysis of the percentage of total as determined by densitometry (Figure 3Bi). This exclusion of the EDA exon is consistent with other reports on FN isoform expression during chondrogenesis. The effects of TGF-β1 on EDB exon inclusion seemed to undergo a change at the same time as a phenotypic change in the cells noted for collagens type I and II. In the early period (1–9 days), TGF-β1 treatment accelerated the decrease in FN EDB inclusion to levels observed during later chondrogenic maturation (days 28–42). From 12 –42 days, representing the pre-hypertrophic/hypertrophic period, TGF-β1 treatment resulted in levels of EDB-containing FN that were similar to the levels observed with the controls [21]. These preferential effects during the early time period were consistent with the effects of TGF-β on the chondrogenic markers during the same time periods.
Figure 3. TGF-β1 causes a time-dependent exclusion of the FN EDA and EDB exons.
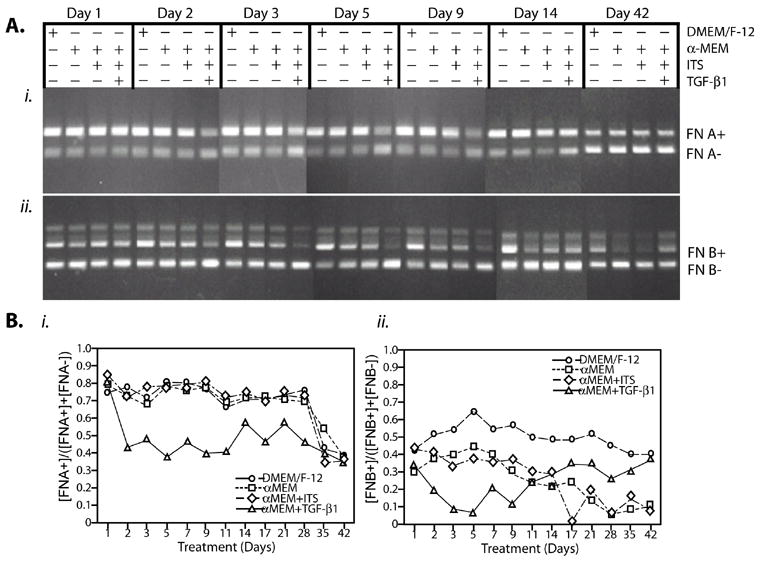
ATDC5 cells were maintained in DMEM/F-12, αMEM, α-MEM + ITS or αMEM + ITS +10 ng/ml TGF-β1 at times out to 42 days. (A). Representative gels for effects of TGF-β1 on inclusion of the FN EDA or FN EDB exon at 1, 2, 3, 5, 9, 14 and 42 days are shown. (B). Densitometry of the complete time course gels. Amounts of the splice products are expressed as a percentage of the total, (i.e., FN A+ = {[FN A+]/([FN A+]+[FN A-])}x100. Results for inclusion of the A exon are shown in (i); for inclusion of the B exon in (ii). Statistical analysis showed that TGF-β1 treatment significantly decreased EDA inclusion (p<0.05); effects on FN EDB inclusion were only marked in the early time period. (○) DMEM/F-12; (□)αMEM; (⋄) α MEM + ITS (Δ)αMEM + ITS +10 ng/ml TGF-β1.
TGF-β1 treatment alters splicing patterns of RNA splicing factor SRp40
As inclusion of the FN EDA and EDB exons has been described to be dependent on interaction with the splicing protein, SRp40, we asked if TGF-β1 altered SRp40 isoform expression. We detected both the long and short forms by RT-PCR at 2 and 4 days after treatment with 10 and 1 ng/ml TGF-β1(Figure 4Ai) and at times out to 42 days after treatment with 10 ng/ml TGF-β1 (Figure 4Aii). At 2 days, 10 ng/ml TGF-β1 caused a small increase in the expression of the long-form of SRp40; at a concentration of 1 ng/ml TGF-β1, expression levels appeared similar to untreated controls. By Day 4, no effect of TGF-β1 treatment was observed (Figure 4Bi). To determine if TGF-β1 would cause later changes, we also assessed the SRp40 expression at days 17, 28, and 42. As was observed at Day 4, SRp40 long:short form ratios remained relatively constant independent of treatment with TGF-β1 (Figure 4Bii).
Figure 4. TGF-β1 causes an early increase in SRp40 LF expression.
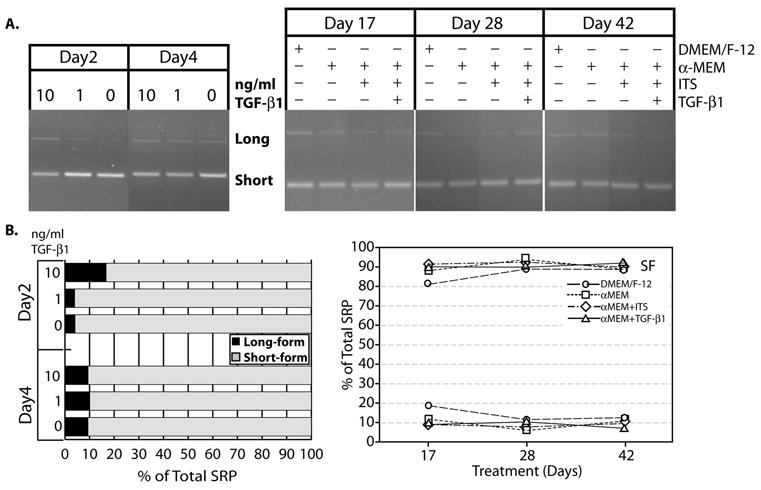
ATDC5 cells were maintained in αMEM + ITS 0, 10, or 10 ng/ml TGF-β1 for 2 or 4 days. RNA was collected and amplified by RT-PCR. (A) Representative gel for effects of TGF-β1 on SRp40 isoforms. Alternative splicing results in the production of a long-form of the mRNA (Long) and a short-form (Short) that differ by reading through one intron. The long form suppresses the SRp40-faciliated inclusion of the EDA exon. (i) SRp40 mRNA isoform expression at 2 and 4 days after treatment with 0, 1, or 10 ng/ml TGF-β1. (ii) SRp40 mRNA isoform expression at 17, 28, and 42 days when cultured under different medium conditions and with TGF-β1. (B) Densitometry of the gel, expressed as a percentage of the total, e.g., Long = {[Long]/([Long] + [Short])}x100. (i) Densitometry of the dose-response gel. The 10 ng/ml dose of TGF-β1 increases the proportion of the long form of SRp40 at 2 days only. ■ Percentage of A+ containing amplification product; ■ Percentage of A- containing product. (ii) Densitometry of the effect of TGF-β1 and medium conditions on SRp40 mRNA isoform expression at 17, 28, and 42 days. No significant changes were measured in isoform expression as a function of time or culture condition. (○) DMEM/F-12; (□)αMEM; (⋄) αMEM + ITS (Δ)αMEM + ITS +10 ng/ml TGF-β1.
TGF-β1 treatment and transfection of SRp40 alters FN EDA matrix organization
Because TGF-β1 treatment caused an early increase in SRp40 long-form expression, we investigated (1) the effects of overexpression of SRp40 on FN and FN EDA organization and (2) if TGF-β1 had an effect on FN and FN EDA organization in either control or transfected cells. To identify transfected cells, all experiments included co-transfection of an expression plasmid for green fluorescent protein (GFP), or for β-galactosidase in SEM studies. In control cells transfected with GFP alone, FN organization consisted of a network of fibrils. These fibrils were most apparent around the cell periphery, with fibrils intersecting as they spanned intracellular regions (Figure 5A, 5G; N.B., In all panels, exposure times have been optimized for each field so that changes in intensity do not necessarily imply changes in expression levels). Similar organization is observed in the TGF-β treated controls (5D, 5H). In cells co-transfected with GFP and pCG-SRp40 (5B, 5I), fibrils are abundant both around the transfected cell and throughout the culture; the intercellular fibrils appear longer than the ones observed in control cultures. Importantly, transfection with SRp40 appears to have far-reaching effects, perhaps by the FN secreted from the cells serving as a nucleation/fibril formation center that allows fibril propagation through the culture. Additionally, cells are apparent that have short bundles of FN fibrils that appear localized to cellular extensions (5I). In cells that had been transfected with GFP and pCG-SRp40 followed by treatment with TGF-β1, most of the staining is apparent around the periphery of the cell. The extracellular fibrils appeared shorter and thinner; these fibrils appeared to be “branched” which was not as apparent in untreated cultures (5E). Additionally, numbers of cells that showed FN bundles arrayed in a pattern suggesting localization with cellular extensions had increased (arrows, 5E, 5J), suggesting that the combination of TGF-β1 and transfection with pCG-SRp40 accelerated this phenotype. In cells that were co-transfected with pCG-SRp40LF, an engineered construct that encodes the long-form of SRp40 [Liang, et al., accompanying ms], and GFP (5C, 5K), FN fibrils were abundant and had a thicker appearance than either of the other two cultures; these thicker fibrils displayed a “feathery” appearance due to the presence of many short branches along the fibril length (arrow, 5K). As noted above, the effect of the transfection while apparent around the transfected cell, extended throughout the culture. In cells transfected with GFP and pCG-SRp40LF followed by treatment with TGF-β1, the feathery nature of the fibrils became even more apparent (Figure 5F, 5L).
Figure 5. TGF-β treatment and SRp40 overexpression regulates total fibronectin matrix organization.
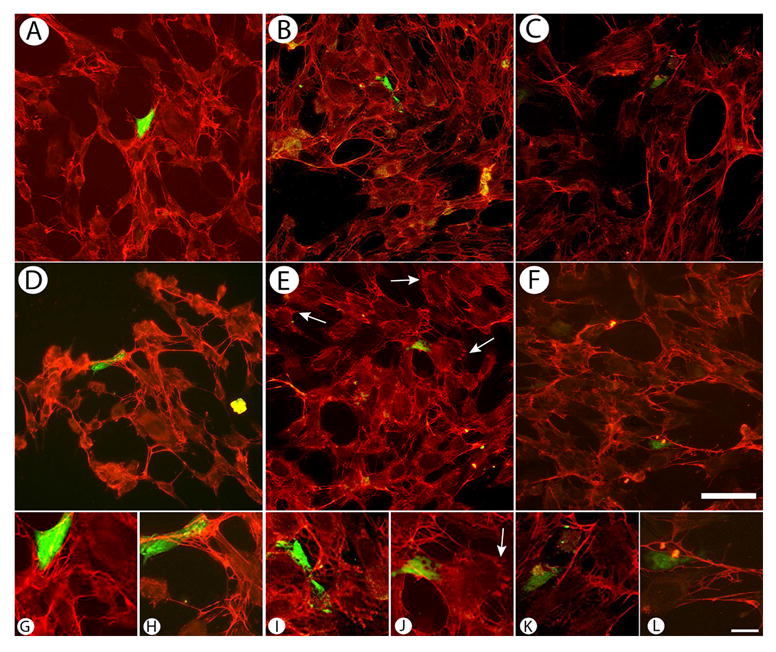
ATDC5 cells were transfected with GFP ± expression vectors for SRp40 isoforms. Pictures shown are of the overall field with an accompanying close-up of the area around the transfected cells. (A,D) GFP + pCG-SRp40 (B,E), or GFP + pCG-SRp40LF (C,F) were allowed to proliferate for 72 h in the absence (A,B,C) or presence (D,E,F) of 10 ng/ml TGF-β1. Cells were fixed, permeabilized, and stained for total FN and imaged by double immunofluorescence. (A, G) Cultures expressing GFP showed a well-developed network of fibrils. (B, H) Cultures expressing GFP + pCG-SRp40 showed fibrils that appeared to be longer than those observed in the control culture; these fibrils were apparent throughout the culture, not just in the neighborhood of the transfected cell. (C, K) Cultures expressing GFP + pCG-SRp40LF showed abundant fibrils that had a thicker, branched appearance than either of the other two cultures. Areas of intense staining were apparent, perhaps signifying clusters of short FN fibrils. (D). Cultures expressing GFP + pCG-SRp40 followed by treatment with TGF-β1 showed fibrils that appeared shorted and thinner with abundant branching. (E). Cultures expressing GFP + pCG-SRp40LF followed by treatment with TGF-β1 did not appear significantly different than the parallel untreated cultures. Magnification: bar = 50 μm (A–F); bar = 10 μm.
Because the FN fibril organization appeared to be dependent not only on TGF-β1 treatment, but on the expression of the different SRp40 isoforms, we examined fibril organization as a function of these conditions using SEM. In all three figures, β-galactosidase staining is shown in Figure Ai (control) and Bi (TGF-β1 treated). Based on careful marking of the fields, the same cells were found by SEM (arrowheads point to transfected cells, Figure Aii and Bii) and their fibril organization was examined at higher magnification (area examined indicated by arrows in Aii and Bii) in Aiii and Biii.
In cells transfected with β-galactosidase alone (Figure 6Ai), cells have close cell-cell contact (Figure 6Aii) and these areas of propinquity are characterized by fine mesh-like patterns of intersecting fibrils (Figure 6Aiii). After TGF-β treatment (Figure 6Bi), cells appear to not be as closely aligned and appear to display many cellular extensions (Figure 6Bii). These cellular extensions appear to integrate with the fibril network which appears to be fine and relatively sparse (Figure 6Biii).
Figure 6. TGF-β treatment alters fibril formation.
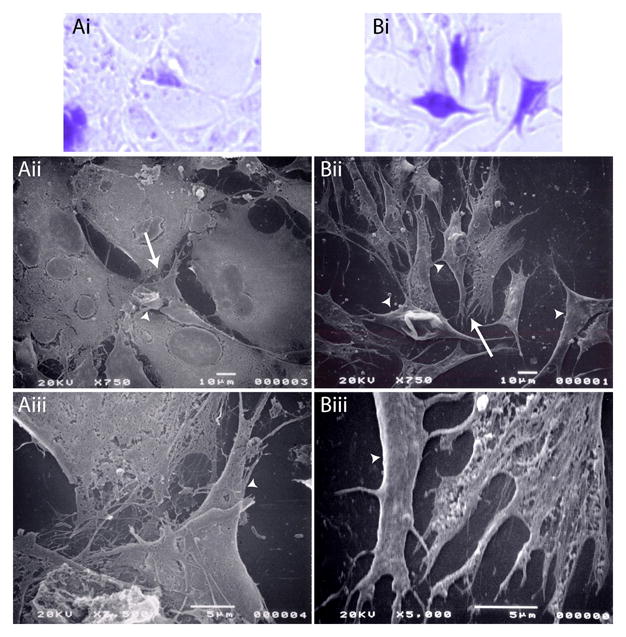
ATDC5 cells were transfected with β-galactosidase. Transfected cells were allowed to proliferate for 72 h in the absence (A) or presence (B) of 10 ng/ml TGF-β1. Cells were fixed, transfected cells stained for β-galactosidase, fields marked, and cells mounted for SEM. Pictures shown are of the transfected field stained for β-galactosidase (Ai, Bi), and the parallel fields visualized by SEM at 750x (Aii, Bii) or 5000x (Aiii, Biii). Arrowheads indicate transfected cells identified in Ai and Bi, whereas the arrow indicates the area in Aii or Bii that is examined at higher magnification in Aiii or Biii. In cells transfected with β-galactosidase alone (Ai), cells have close cell-cell contact (Aii) with fine mesh-like patterns of intersecting fibrils (Aiii). After TGF-β treatment (Bi), cells display many cellular extensions and/or fibrils (Bii) that appear to be fine and relatively sparse (Biii).
In cells transfected with pCG-SRp40 + β-galactosidase (Figure 7Ai), a fine network of intersecting fibers and/or cellular extensions appears to extend between neighboring cells (Figure 7Aii). On closer examination, these areas consist of thick fibers that intersect, as well as a dense network of finer fibers (Figure 7Aiii). On the average, the fibers appear to be longer than the corresponding fibers observed in the control transfections. After TGF-β1 treatment (Figure 7Bi), the intercellular region around the transfected cells appears to be occupied by a similar array of heavy and fine fibers (Figure 7Bii, Biii). In some instances, these thinner fibers have a feathery appearance, suggesting initiation of branching.
Figure 7. TGF-β treatment and pCG-SRp40 transfections alter fibril formation.
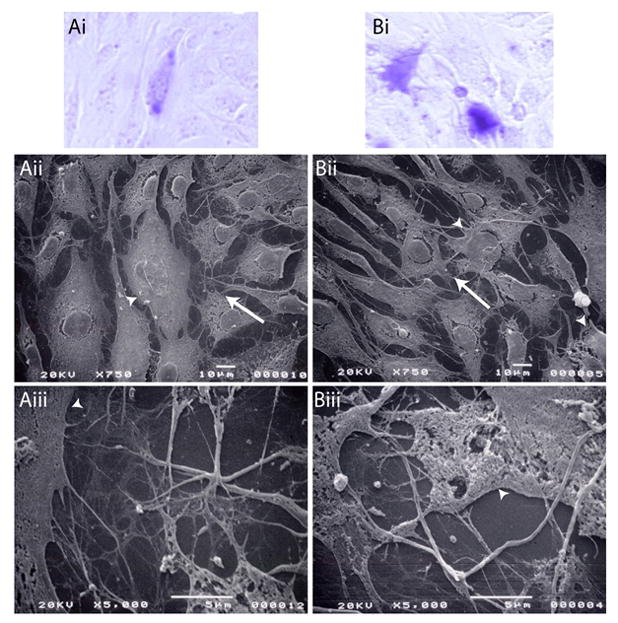
ATDC5 cells were transfected with β-galactosidase + pCG-SRp40. Transfected cells were allowed to proliferate for 72 h in the absence (A) or presence (B) of 10 ng/ml TGF-β1. Cells were fixed, transfected cells stained for β-galactosidase, fields marked, and cells mounted for SEM. Pictures shown are of the transfected cells stained for β-galactosidase (Ai, Bi), and the parallel fields visualized by SEM at 750x (Aii, Bii) or 5000x (Aiii, Biii). Arrowheads indicate transfected cells identified in Ai and Bi, whereas the arrow indicates the area in Aii or Bii that is examined at higher magnification in Aiii or Biii. In cells transfected with pCG-SRp40 + β-galactosidase (Ai), a fine network of intersecting fibers and/or cellular extensions extends between neighboring cells (Aii), appearing to be comprised of intersecting thick fibers with a dense network of finer fibers (Aiii). After TGF-β1 treatment (Bi), the intercellular region around the transfected cells appears to be occupied by a similar array of heavy and fine fibers that sometimes have an appearance suggestive of branching (Bii, Biii).
In cells transfected with pCG-SRp40LF (Figure 8Ai, Bi), the fibers appeared to be neither as abundant nor as well organized as either the control cultures or the cultures transfected with pCG-SRp40. As in the immunofluorescent images, the fibril-like structures appear to be very thick and associated with cellular extensions (Figure 8Aii, Aiii). After TGF-β treatment, the thick fibril-like structures remained, with additional very fine branched fibrils throughout the intercellular space (Figure 8Bii, Biii).
Figure 8. TGF-β treatment and transfection with pCG-SRp40LF alters fibril formation.
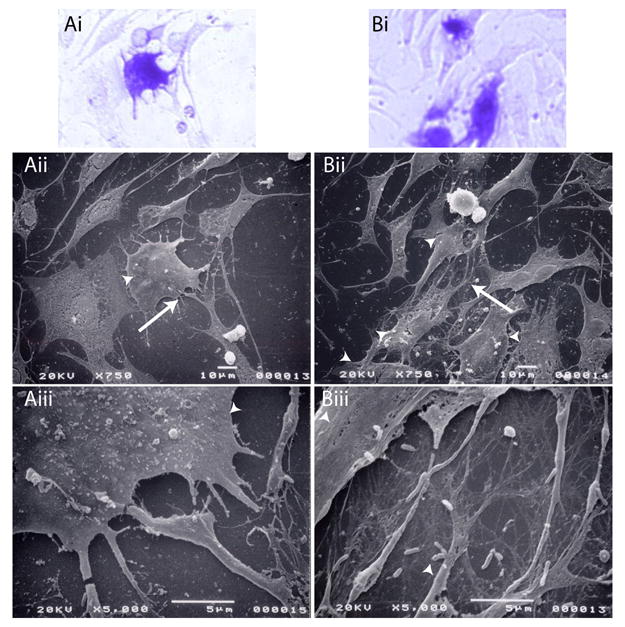
ATDC5 cells were transfected with β-galactosidase + pCG-SRp40LF. Transfected cells were allowed to proliferate for 72 h in the absence (A) or presence (B) of 10 ng/ml TGF-β1. Cells were fixed, transfected cells stained for β-galactosidase, fields marked, and cells mounted for SEM. Pictures shown are of the transfected cells stained for β-galactosidase (Ai, Bi), and the parallel fields visualized by SEM at 750x (Aii, Bii) or 5000x (Aiii, Biii). Arrowheads indicate transfected cells identified in Ai and Bi, whereas the arrow indicates the area in Aii or Bii that is examined at higher magnification in Aiii or Biii. In cells transfected with pCG-SRp40LF (Ai, Bi), fibers appear relatively sparse and poorly organized. The fibril-like structures appear to be very thick and associated with cellular extensions (Aii, Aiii). After TGF-β treatment, the thick fibril-like structures are apparent, as are very fine branched fibrils (Bii, Biii).
Because (1) TGF-β1 appeared to regulate SRp40 isoform expression, (2) TGF-β1 affected FN organization and (3) pCG-SRp40 and pCG-SRp40LF expression regulated FN organization in concert with TGF-β1, we next examined the effects of overexpression of the two SRp40 isoforms on FN EDA organization (Figure 9). In cells transfected with GFP alone, EDA-positive fibrils were diffusively present with some EDA staining apparent either as focal bundles or fibrils (Figure 9A, arrowhead and arrow, respectively). In GFP-expressing cells treated with TGF-β1, fewer fibrils and greater numbers of focal bundles that stained intensely for FN EDA were present (Figure 9D, arrowhead). When ATDC5 cells were co-transfected with GFP and pCG-SRp40, EDA-containing fibrils were more abundant and longer, as represented by the field shown in Figure 9B (arrowheads). While fibrils remained long after TGF-β1 treatment, (Figure 9E), the EDA-containing matrix around pCG-SRp40 transfected cells showed increased numbers of clusters of short fibrils that stained intensely for FN EDA. When cells were co-transfected with GFP and pCG-SRp40LF (Figure 9C), FN EDA-containing fibrils, when present, were shorter and thicker than the parallel field transfected with SRp40 or GFP alone. Areas of focal FN EDA staining were present not only in the transfected cell, but in cells throughout the fields (9B arrowheads). After TGF-β1 treatment, both short fibrils and areas of focal staining were apparent (9F). As was described for Figure 6, overexpression of pCG-SRp40 or pCG-SRp40LF affected FN EDA organization throughout the culture, with the transfected cell exemplifying the effect. Importantly, in keeping with our data that suggested that TGF-β1 increased SRp40 LF isoform expression at early times, fields of cells in which pCG-SRp40LF was overexpressed had similar FN organization to cells treated with TGF-β1.
Figure 9. TGF-β treatment and SRp40 overexpression regulates FN EDA matrix organization.
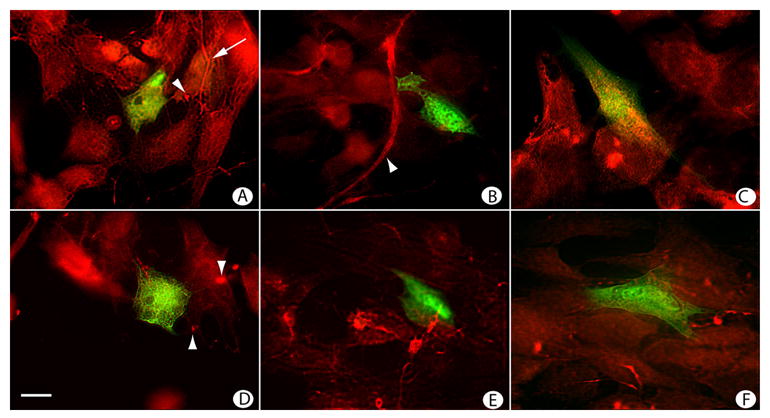
ATDC5 cells transfected with GFP (A,D), GFP + pCG-SRp40 (B,E), or GFP + pCG-SRp40LF (C,F) were allowed to proliferate for 72 h in the absence (A,B,C) or presence (D,E,F) of 10 ng/ml TGF-β1. Cells were fixed, permeabilized, and stained for FN EDA and imaged by double immunofluorescence. (A) Cultures expressing GFP showed diffuse EDA staining apparent either as focal bundles or fibrils (arrowhead and arrow, respectively). (B) Cultures expressing GFP + pCG-SRp40 showed EDA-containing fibrils that were more abundant and longer. (C) Cultures expressing GFP + pCG-SRp40LF appeared to have EDA-containing fibrils that were shorter and thicker than those observed under the other conditions. Areas of focal staining for EDA were apparent both adjacent to the transfected cell and throughout the field. (D) Cultures expressing GFP followed by treatment with TGF-β1 showed fewer fibrils and greater numbers of focal bundles that stained intensely for FN EDA. (E) Cultures expressing GFP + pCG-SRp40 after treatment with TGF-β1 continued to show long, thick FN EDA-containing fibrils, along with increased frequency of these intensely staining FN-EDA-containing bundles. (F) Cultures expressing GFP + pCG-SRp40LF showed both short fibrils and areas of focal staining. Magnification: bar = 10 μm
DISCUSSION
TGF-β1 is a potent osteogenic and chondrogenic factor that accelerates early cell commitment and differentiation; later stages of maturation appear to be inhibited by TGF-β1 in both osteoblastic and chondrogenic cells [26, 28–30]. Associated with chondrogenic maturation is a staged production of extracellular matrix which interestingly includes alternative splicing of both collagen type II and FN to yield matrices unique to the developing cartilage. In the case of collagen type II, the switch to collagen type IIB production is characteristic of the maturing matrix[31]. With FN splicing, the picture is more complex. Specifically, loss of the FN EDA exon and maintenance of the FN EDB exon is characteristic of the mesenchymal to chondrocytic transition and we and others have reported on FN isoform expression in this cell population [5, 32].
When induced to differentiate by culturing in α-MEM containing ITS, ATDC5 cells acquire a more chondrogenic phenotype as characterized by increased Alcian blue staining, decreased collagen type I expression[21] and an increase in the relative levels of collagen type IIB. TGF-β1 appears to accelerate the early event associated with chondrogenesis both in the clonal ATDC5 cells in their mesenchymal state[20] and, after addition of ITS to induce chondrogenesis. We have specifically examined the effects of TGF-β1 on FN isoform expression during chondrogenic maturation to determine to what extent altered chondrogenic maturation paralleled changes in FN isoform expression.
FN isoforms arise from alternative splicing from three regions, two of which we have assessed. Specifically, loss of the FN EDA exon is characteristic of the mesenchymal to cartilage transition and TGF-β1 accelerates this loss of the EDA exon. Inclusion of the EDB exon is more complex and the percentage of EDB-containing FN isoforms appears to be dependent on the species of cartilage assessed[19]. The maturing murine ATDC5 cells appear to express ~ 20% of FN that retains the EDB exon
While the phenotypic effects of TGF-β1 on ATDC5 cells combined with insulin are known with respect to inorganic phosphate transport[33] and TGF-β signaling and expression[34], this is the first report of the effects of TGF-β1 on FN splicing during the chondrogenic proliferation to hypertrophy program. TGF-β1 slightly increased the appearance of alcian blue staining and decreased expression of collagen type I, suggesting an acceleration of the transit through the proliferative phase. Because the presence of the many factors in serum could influence ATDC5 differentiation, we also performed mRNA expression analysis over the first 4 days of culture in the presence and absence of serum which showed similar outcomes to that observed in serum-containing medium (Han and Hickok, unpublished results).
As chondrocyte maturation progresses, FN isoform expression switches from one that is predominantly A+B+ to one that is predominantly A-; amounts of B+ isoforms are variable according to species and tissue[19]. Again, TGF-β1 has been shown in multiple systems to influence FN splicing [17, 19, 27, 35–38]. Interestingly, this influence has been to favor inclusion of the EDA exon, and when measured, the EDB exon[19]. In the maturing ATDC5 cell, TGF-β1 treatment favored exclusion of both the EDA and EDB exons. A mechanism for the regulation of the alternative splicing is suggested by our finding that during the proliferative phase, TGF-β1 treatment increased expression of SRp40 LF, while decreasing SRp40 mRNA.
This finding is important because SRp40 expression has been associated with regulation of FN EDA[11] [Liang et al., accompanying ms] and EDB[39–41]. Specifically, SRp40 increases EDA inclusion while SRp40LF inhibits this inclusion. Endogenous levels of SRp40LF increased in chick limb mesenchymal cells within two days of being plated at high density, coincident with the initiation of chondrogenic condensations (Liang et al). Both SRp40 isoforms enhanced the formation of such condensations when overexpressed. Here we have demonstrated that overexpression of both SRp40 isoforms affected extracellular fibril organization as assessed by SEM, and affected total FN and EDA-containing FN organization in ATDC5 cells, as assessed by immunofluorescent staining. Notably, overexpression of the LF isoform had the most marked affect on FN organization, with the culture exhibiting some of the characteristics of cultures treated with TGF-β1.
These transfection studies thus suggest a functional link between regulation of SRp40 isoform expression, FN isoform expression, and chondrocyte matrix assembly. As a number of alternative splicing events occur during chondrocyte maturation, our findings would suggest that a possible constriction point could be the regulation of the ratio of the alternatively-spliced forms of SRp40. As a first step in this, it will be important to determine if collagen type II isoform expression responds to changes in SRp40 isoform expression.
Acknowledgments
This work was supported by NIH grants AR45181 (NJH) AR44360 (CJW), AR39740 (CJW and NJH), AR46821 (PAN), DE-13310 (CSA), DE-10875 (CSA), and DE-05748 (CSA). We also gratefully acknowledge sponsorship of this work by the Department of the Army, Award # DAMD17-03-1-0713 (NJH, TF and CSA). The U.S. Army Medical Research Acquisition Activity, 820 Chandler Street, Fort Detrick MD 21702-5014 is the awarding and administering acquisition office. The content of the information in this manuscript does not necessarily reflect the position or the policy of the Government, and no official endorsement should be inferred.
Footnotes
Publisher's Disclaimer: This is a PDF file of an unedited manuscript that has been accepted for publication. As a service to our customers we are providing this early version of the manuscript. The manuscript will undergo copyediting, typesetting, and review of the resulting proof before it is published in its final citable form. Please note that during the production process errors may be discovered which could affect the content, and all legal disclaimers that apply to the journal pertain.
References
- 1.Pankov R, Yamada KM. Fibronectin at a glance. J Cell Sci. 2002;115:3861–3863. doi: 10.1242/jcs.00059. [DOI] [PubMed] [Google Scholar]
- 2.Manabe R, Oh-e N, Sekiguchi K. Alternatively spliced EDA segment regulates fibronectin-dependent cell cycle progression and mitogenic signal transduction. J Biol Chem. 1999;274:5919–5924. doi: 10.1074/jbc.274.9.5919. [DOI] [PubMed] [Google Scholar]
- 3.Manabe R, Ohe N, Maeda T, Fukuda T, Sekiguchi K. Modulation of cell-adhesive activity of fibronectin by the alternatively spliced EDA segment. J Cell Biol. 1997;139:295–307. doi: 10.1083/jcb.139.1.295. [DOI] [PMC free article] [PubMed] [Google Scholar]
- 4.Chen W, Culp LA. Adhesion to fibronectin's EDb domain induces tyrosine phosphorylation of focal adhesion proteins in Balb/c 3T3 cells. Clin Exp Metas. 1998;16:30–42. doi: 10.1023/a:1006507917700. [DOI] [PubMed] [Google Scholar]
- 5.Burton-Wurster N, Lust G, Macleod JN. Cartilage fibronectin isoforms: in search of functions for a special population of matrix glycoproteins. Matrix Biology. 1997;15:441–454. doi: 10.1016/s0945-053x(97)90018-4. [DOI] [PubMed] [Google Scholar]
- 6.Bennett VD, Pallante KM, Adams SL. The splicing pattern of fibronectin mRNA changes during chondrogenesis resulting in an unusual form of the mRNA in cartilage. J Biol Chem. 1991;266:5918–5924. [PubMed] [Google Scholar]
- 7.Peters JH, Hynes RO. Fibronectin isoform distribution in the mouse. I The alternatively spliced EIIIB, EIIIA, and V segments show widespread codistribution in the developing mouse embryo. Cell Adh Commun. 1996;4:103–125. doi: 10.3109/15419069609010766. [DOI] [PubMed] [Google Scholar]
- 8.Peters JH, Chen GE, Hynes RO. Fibronectin isoform distribution in the mouse. II Differential distribution of the alternatively spliced EIIIB, EIIIA, and V segments in the adult mouse. Cell Adh Comm. 1996;4:127–148. doi: 10.3109/15419069609010767. [DOI] [PubMed] [Google Scholar]
- 9.Xia P, Culp LA. Adhesion activity in fibronectin's alternatively spliced domain EDa (EIIIA): complementarity to plasma fibronectin functions. Exp Cell Res. 1995;217:517–527. doi: 10.1006/excr.1995.1117. [DOI] [PubMed] [Google Scholar]
- 10.White DG, Hershey HP, Moss JJ, Daniels H, Tuan RS, Bennett VD. Functional analysis of fibronectin isoforms in chondrogenesis: Full-length recombinant mesenchymal fibronectin reduces spreading and promotes condensation and chondrogenesis of limb mesenchymal cells. Differentiation. 2003;71:251–261. doi: 10.1046/j.1432-0436.2003.7104502.x. [DOI] [PubMed] [Google Scholar]
- 11.Kuo BA, Uporova TM, Liang H, Bennett VD, Tuan RS, Norton PA. Alternative splicing during chondrogenesis: modulation of fibronectin exon EIIIA splicing by SR proteins. J Cell Biochem. 2002;86:45–55. doi: 10.1002/jcb.10188. [DOI] [PubMed] [Google Scholar]
- 12.Suzuki F. Effects of various growth factors on a chondrocyte differentiation model. Adv Exp Med Biol. 1992;324:101–106. doi: 10.1007/978-1-4615-3398-6_10. [DOI] [PubMed] [Google Scholar]
- 13.Denker AE, Nicoll SB, Tuan RS. Formation of cartilage-like spheroids by micromass cultures of murine C3H10T1/2 cells upon treatment with transforming growth factor-beta 1. Differentiation. 1995;59:25–34. doi: 10.1046/j.1432-0436.1995.5910025.x. [DOI] [PubMed] [Google Scholar]
- 14.Mackay AM, Beck SC, Murphy JM, Barry FP, Chichester CO, Pittenger MF. Chondrogenic differentiation of cultured human mesenchymal stem cells from marrow. Tissue Engineering. 1998;4:415–428. doi: 10.1089/ten.1998.4.415. [DOI] [PubMed] [Google Scholar]
- 15.Li J, Tripathi BJ, Tripathi RC. Modulation of pre-mRNA splicing and protein production of fibronectin by TGF-β2 in porcine trabecular cells. Inv Ophthal Vis Sci. 2000;41:3437–3443. [PubMed] [Google Scholar]
- 16.Borsi L, Castellani P, Risso AM, Leprini A, Zardi L. Transforming growth factor-beta regulates the splicing pattern of fibronectin messenger RNA precursor. FEBS Letters. 1990;261:175–178. doi: 10.1016/0014-5793(90)80664-5. [DOI] [PubMed] [Google Scholar]
- 17.Balza E, Borsi L, Allemanni G, Zardi L. Transforming growth factor beta regulates the levels of different fibronectin isoforms in normal human cultured fibroblasts. FEBS Letters. 1988;228:42–44. doi: 10.1016/0014-5793(88)80580-5. [DOI] [PubMed] [Google Scholar]
- 18.Burger A, Wagner C, Viedt C, Reis B, Hug F, Hansch GM. Fibronectin synthesis by human tubular epithelial cells in culture: effects of PDGF and TGF-β on synthesis and splicing. Kidney Intl. 1998;54:407–415. doi: 10.1046/j.1523-1755.1998.00009.x. [DOI] [PubMed] [Google Scholar]
- 19.Zhang DW, Burton-Wurster N, Lust G. Alternative splicing of ED-A and ED-B sequences of fibronectin pre-mRNA differs in chondrocytes from different cartilaginous tissues and can be modulated by biological factors. J Biol Chem. 1995;270:1817–1822. doi: 10.1074/jbc.270.4.1817. [DOI] [PubMed] [Google Scholar]
- 20.Han F, Adams CS, Tao Z, Williams CJ, Zaka R, Tuan RS, Norton PA, Hickok NJ. Transforming growth factor β1 (TGF-β1) regulates ATDC5 chondrogenic differentiation and fibronectin isoform expression. J Cell Biochem. 2005;95:750–762. doi: 10.1002/jcb.20427. [DOI] [PubMed] [Google Scholar]
- 21.Atsumi T, Miwa Y, Kimata K, Ikawa Y. A chondrogenic cell line derived from a differentiating culture of AT805 teratocarcinoma cells. Cell Diff Develop. 1990;30:109–116. doi: 10.1016/0922-3371(90)90079-c. [DOI] [PubMed] [Google Scholar]
- 22.San Antonio JD, Tuan RS. Chondrogenesis of limb bud mesenchyme in vitro: stimulation by cations. Develop Biol. 1986;115:313–324. doi: 10.1016/0012-1606(86)90252-6. [DOI] [PubMed] [Google Scholar]
- 23.Screaton GR, Caceres JF, Mayeda A, Bell MV, Plebanski M, Jackson DG, Bell JI, Krainer AR. Identification and characterization of three members of the human SR family of pre-mRNA splicing factors. EMBO J. 1995;14:4336–4349. doi: 10.1002/j.1460-2075.1995.tb00108.x. [DOI] [PMC free article] [PubMed] [Google Scholar]
- 24.Lee JD, Hwang O, Kim SW, Han S. Primary cultured chondrocytes of different origins respond differently to bFGF and TGF-β. Life Sciences. 1997;61:293–299. doi: 10.1016/s0024-3205(97)00385-8. [DOI] [PubMed] [Google Scholar]
- 25.van Osch GJ, van der Veen SW, Buma P, Verwoerd-Verhoef HL. Effect of transforming growth factor-β on proteoglycan synthesis by chondrocytes in relation to differentiation stage and the presence of pericellular matrix. Matrix Biol. 1998;17:413–424. doi: 10.1016/s0945-053x(98)90101-9. [DOI] [PubMed] [Google Scholar]
- 26.Hanada K, Solchaga LA, Caplan AI, Hering TM, Goldberg VM, Yoo JU, Johnstone B. BMP-2 induction and TGF-β1 modulation of rat periosteal cell chondrogenesis. J Cell Biochem. 2001;81:284–294. doi: 10.1002/1097-4644(20010501)81:2<284::aid-jcb1043>3.0.co;2-d. [DOI] [PubMed] [Google Scholar]
- 27.Magnuson VL, Young M, Schattenberg DG, Mancini MA, Chen DL, Steffensen B, Klebe RJ. The alternative splicing of fibronectin pre-mRNA is altered during aging and in response to growth factors. J Biol Chem. 1991;266:14654–14662. [PubMed] [Google Scholar]
- 28.Moses HL, Serra R. Regulation of differentiation by TGF-β. Curr Op Genet Develop. 1996;6:581–586. doi: 10.1016/s0959-437x(96)80087-6. [DOI] [PubMed] [Google Scholar]
- 29.Ber R, Kubota T, Sodek J, Aubin JE. Effects of transforming growth factor-beta on normal clonal bone cell populations. Biochem Cell Biol. 1991;69:132–140. doi: 10.1139/o91-020. [DOI] [PubMed] [Google Scholar]
- 30.Yang X, Chen L, Xu X, Li C, Huang C, Deng CX. TGF-β/Smad3 signals repress chondrocyte hypertrophic differentiation and are required for maintaining articular cartilage. J Cell Biol. 2001;153:35–46. doi: 10.1083/jcb.153.1.35. [DOI] [PMC free article] [PubMed] [Google Scholar]
- 31.Valcourt U, Gouttenoire J, Aubert-Foucher E, Herbage D, Mallein-Gerin F. Alternative splicing of type II procollagen pre-mRNA in chondrocytes is oppositely regulated by BMP-2 and TGF-β1. FEBS Letters. 2003;545:115–119. doi: 10.1016/s0014-5793(03)00510-6. [DOI] [PubMed] [Google Scholar]
- 32.Gehris AL, Oberlender SA, Shepley KJ, Tuan RS, Bennett VD. Fibronectin mRNA alternative splicing is temporally and spatially regulated during chondrogenesis in vivo and in vitro. Develop Dynamics. 1996;206:219–230. doi: 10.1002/(SICI)1097-0177(199606)206:2<219::AID-AJA11>3.0.CO;2-Y. [DOI] [PubMed] [Google Scholar]
- 33.Palmer G, Guicheux J, Bonjour JP, Caverzasio J. Transforming growth factor-β stimulates inorganic phosphate transport and expression of the type III phosphate transporter Glvr-1 in chondrogenic ATDC5 cells. Endocrinology. 2000;141:2236–2243. doi: 10.1210/endo.141.6.7495. [DOI] [PubMed] [Google Scholar]
- 34.Kawai J, Akiyama H, Shigeno C, Ito H, Konishi J, Nakamura T. Effects of transforming growth factor-β signaling on chondrogenesis in mouse chondrogenic EC cells, ATDC5. Eur J Cell Biol. 1999;78:707–714. doi: 10.1016/s0171-9335(99)80039-9. [DOI] [PubMed] [Google Scholar]
- 35.Inoue T, Nabeshima K, Shimao Y, Koono M. Hepatocyte growth Factor/Scatter factor (HGF/SF) is a regulator of fibronectin splicing in MDCK cells: comparison between the effects of HGF/SF and TGF-β1 on fibronectin splicing at the EDA region. Biochem Biophys Resh Comm. 1999;260:225–231. doi: 10.1006/bbrc.1999.0881. [DOI] [PubMed] [Google Scholar]
- 36.Borsi L, Balza E, Allemanni G, Zardi L. Differential expression of the fibronectin isoform containing the ED-B oncofetal domain in normal human fibroblast cell lines originating from different tissues. Exp Cell Res. 1992;199:98–105. doi: 10.1016/0014-4827(92)90466-l. [DOI] [PubMed] [Google Scholar]
- 37.Inoue T, Nabeshima K, Shimao Y, Kataoka H, Koono M. Cell density-dependent regulation of fibronectin splicing at the EDA region in fibroblasts: cell density also modulates the responses of fibroblasts to TGF-β and cancer cell-conditioned medium. Cancer Letters. 1998;129:45–54. doi: 10.1016/s0304-3835(98)00079-2. [DOI] [PubMed] [Google Scholar]
- 38.Wang A, Cohen DS, Palmer E, Sheppard D. Polarized regulation of fibronectin secretion and alternative splicing by transforming growth factor. J Biol Chem. 1991;266:15598–15601. [PubMed] [Google Scholar]
- 39.Du K, Leu JI, Peng Y, Taub R. Transcriptional up-regulation of the delayed early gene HRS/SRp40 during liver regeneration. Interactions among YY1, GA-binding proteins, and mitogenic signals. J Biol Chem. 1998;273:35208–35215. doi: 10.1074/jbc.273.52.35208. [DOI] [PubMed] [Google Scholar]
- 40.Lim LP, Sharp PA. Alternative splicing of the fibronectin EIIIB exon depends on specific TGCATG repeats. Mol Cell Biol. 1998;18:3900–3906. doi: 10.1128/mcb.18.7.3900. [DOI] [PMC free article] [PubMed] [Google Scholar]
- 41.Du K, Peng Y, Greenbaum LE, Haber BA, Taub R. HRS/SRp40-mediated inclusion of the fibronectin EIIIB exon, a possible cause of increased EIIIB expression in proliferating liver. Mol Cell Biol. 1997;17:4096–4104. doi: 10.1128/mcb.17.7.4096. [DOI] [PMC free article] [PubMed] [Google Scholar]
- 42.Gehris AL, Brandli DW, Lewis SD, Bennett VD. The exon encoding the fibronectin type III-9 repeat is constitutively included in the mRNA from chick limb mesenchyme and cartilage. Biochim Biophys Acta. 1996;1311:5–12. doi: 10.1016/0167-4889(95)00183-2. [DOI] [PubMed] [Google Scholar]