

Abstract
Background
Even in areas where screening is available, many prostate cancers are diagnosed after the symptoms begin. However, the risk posed by particular symptoms is largely unknown, especially in unselected populations such as primary care.
Aim
To identify and quantify the features of prostate cancer before diagnosis, both individually and in combination.
Design of study
Population-based case-control study.
Setting
All 21 general practices in Exeter, Devon, UK.
Methods
We studied all 217 prostate cancer patients diagnosed between 1998 and 2002, and 1080 male controls, matched by age and general practice. The full medical record for 2 years before diagnosis was coded, using the International Classification of Primary Care. We calculated odds ratios for variables independently associated with cancer, using conditional logistic regression, and calculated the positive predictive values for these, both individually and in combination.
Results
Eight features were associated with prostate cancer before diagnosis. Their positive predictive values against a background risk of 0.35% were: urinary retention 3.1% (95% confidence interval [CI] = 1.5 to 6.0); impotence 3.0% (95% CI = 1.7 to 4.9); frequency 2.2% (95% CI = 1.3 to 3.5); hesitancy 3.0% (95% CI = 1.5 to 5.5); nocturia 2.2% (95% CI = 1.2 to 3.6); haematuria 1.0% (95% CI = 0.57 to 1.8); weight loss 0.75% (95% CI = 0.38 to 1.4); abnormal rectal examination, deemed benign 2.8% (95% CI = 1.6 to 4.6); abnormal rectal examination, deemed malignant 12% (95% CI = 5.0 to 37): all P <0.001, except for hesitancy P = 0.032, nocturia P = 0.004 and haematuria P = 0.009. Loss of weight, impotence, frequency and abnormal rectal examination remained associated with cancer after excluding the final 180 days from analysis.
Conclusion
Most men with prostate cancer present with symptoms. The predictive values for these symptoms will help guide GPs and patients about the value of further investigation.
Keywords: diagnosis, primary health care, prostate cancer
INTRODUCTION
Prostate cancer is common worldwide, with over 30 000 new cases, and 9940 deaths each year in the UK.1 There has been much debate on the benefits (and possible disbenefits) from early diagnosis of prostate cancer. This debate has been mostly linked to discussion of the merits of screening.2 Once prostate cancer has become symptomatic, however, there seems little advantage in delaying the diagnosis. Surgical treatment of early prostate cancer has been shown to be beneficial, in terms of reductions in prostate cancer mortality, local tumour progression and metastases.3 Mortality is also strongly related to the stage at diagnosis, further suggesting that early diagnosis is important.
Screening of asymptomatic men, using prostate specific antigen (PSA) has been accepted widely in the US and some parts of Europe.4,5 In the UK, screening is not recommended: most cancers are identified after presentation to primary care with symptoms.2,6 Once prostate cancer is suspected, diagnostic tests include PSA testing (this is quite different from using PSA for screening), ultrasound and biopsy. The latter two require referral to secondary care. Ideally, such referral would be based upon knowledge of the risk posed by particular presenting clinical features. However, no study has reported which clinical features in primary care are associated with prostate cancer, nor have the risks posed by such features been quantified.7
Against this background, we sought both to identify, and to quantify, the pre-diagnostic clinical features of prostate cancer, and thus guide GPs on PSA testing and referral.
METHOD
Subjects
This was a population-based case-control study, involving all 21 general practices in Exeter, Devon, UK. It was performed in parallel with similar studies on colorectal and lung cancer.8,9 The total population in Exeter in mid-2000 was 128 700, with 60 548 aged 40 years or over. All patients aged 40 years or over with prostate cancer, diagnosed from 1998 to 2002 inclusive, were identified from the cancer registry at the Royal Devon and Exeter Hospital. This is the only hospital offering urological services to Exeter patients. Computerised searches at every practice identified any cases missing from the register. Cases without positive histology were included if the records contained a consultant urologist diagnosis of cancer based on strong clinical evidence.
Five male controls were matched to each case on general practice and on age (to 1-year bands if possible, increased in 1-year multiples to a maximum of 5 years). Controls were eligible if they were alive at the time of diagnosis of their case: this did not preclude their being dead at the time of study. Exclusion criteria for both cases and controls were: unobtainable records; no consultations in the 2 years before diagnosis; previous prostate cancer; or residence outside Exeter at the time of diagnosis. Ineligible controls were replaced. If an ineligible control was dead at the time of study, a reserve control, also dead, was used.
Collection and coding of medical data
We made anonymised photocopies of the full primary care records for 2 years before diagnosis. Four research assistants, blinded to case/control status, coded all entries using the International Classification of Primary Care-2.10 Within each practice the same researcher coded both cases and controls, so that any inter-observer variation in coding style would affect both cases and controls equally.
Analysis
Identification of independent associations with cancer
Only variables occurring in >2.5% of cases or controls were analysed. Differences between cases and controls were analysed using conditional logistic regression. Variables associated with cancer in univariable analyses, with a P-value <0.1 entered the multivariable analysis. In the multivariable analyses, a P-value <0.05 was used as a significance threshold.
How this fits in
Most prostate cancers in the UK present with symptoms. The risk of cancer posed by these symptoms is largely unknown, so it is difficult for a GP to advise on the need for further testing. Most lower urinary tract symptoms had a risk of cancer in the order of 3% suggesting that further testing for prostate cancer is warranted. A new finding was of the link between previous impotence and later prostate cancer.
The results from PSA testing were not used in the multivariable modelling. PSA testing in this study was largely undertaken after presentation with symptoms, and so after prostatic cancer was suspected. Furthermore, by excluding PSA results from the main analysis, the resulting model can act as a guide as to whether to measure a PSA.
Modelling was performed in stages, first collecting similar variables together, such as those which could represent urinary obstruction. These were then analysed to identify variables to progress to the second stage. These variables were re-grouped into symptoms, signs and investigations. Further multivariable analyses were then performed. Using this approach, a final model was derived including all the variables independently associated with prostate cancer. All discarded variables were then checked against the final model. Finally, seven clinically plausible interactions were tested. Analyses were repeated excluding data from the last 180 days of the 730-day period studied. A third analysis of the effect of verification bias excluded the 39 patients who had clinically unsuspected cancer found solely by histology of material from a prostatectomy.11
Calculation of positive predictive values (PPVs)
This was possible because we had identified all cases occurring in the population. PPVs were calculated from the likelihood ratios and the observed annual incidence of cancer during the study. As all cases had consulted in primary care, but 6.5% of initially selected controls had not, PPVs were divided by 0.935 to give the value for the population actually consulting in primary care. Confidence intervals (CIs) for these were calculated using Markov Chain Monte Carlo methods in WinBUGS. Stratified analyses by age (over and under 70 years) were performed for individual features, but these were not performed if any cell in the 2×2 table was below 10.
Sample size calculations
Sample size calculations led to a target of 225 cases, giving 80% power to identify a change in the prevalence of a rare variable from 5% in one group to 11% in the other, and 79% power for a common variable from 30 to 40%, both with a two-sided 5% α. Analyses were performed using Stata, version 8.
RESULTS
Cases and controls
Two hundred and forty-eight cases of prostate cancer were identified from the cancer register (n = 247) and practice searches (n = 1). Thirty-one were ineligible: nine had previous prostate cancer; five had other or unconfirmed cancers; six resided outside Exeter at diagnosis; and in 11 the records were unobtainable (10 had left Exeter, one had died). For the 217 eligible cases, 1080 controls were studied (in five elderly cases only four controls were available within the maximum 5-year age band). Originally generated were 1272 controls but 192 were ineligible: 18 had previous prostate cancer; 83 (6.5%) had not consulted in the 2 years; 20 resided outside Exeter; and in 71 the records were unobtainable (58 had left Exeter, 13 had died). These totals include 44 (20%) patients and 106 (9.8%) controls who had died but whose notes were retrievable.
Two hundred and five cases (94%) had histological proof of cancer. The remaining 12 had strong clinical evidence for the diagnosis, with at least two of the following: an extremely high PSA, a prostate deemed malignant by a consultant urologist, or radiology results suggestive of bony metastases. Biopsy had not been performed because of concurrent ill-health: all had been treated with depot anti-androgens. Eighteen (8%) cases had been identified by PSA screening in asymptomatic men and 39 (18%) were identified solely by histology after prostatectomy: 20 after an elective prostatectomy for presumed benign hyperplasia, and 19 semi-urgently after admission for retention. These cancers had been clinically unsuspected.11 Patient details are shown in Table 1.
Table 1.
Characteristics of patients with prostate cancer and matched controls.
| Characteristic | Patients (n = 217) | Controls (n = 1080) |
|---|---|---|
| Age in years at diagnosis | n (%) | n (%) |
| <60 | 15 (7) | 79 (7) |
| 60–69 | 51 (24) | 253 (23) |
| 70–79 | 100 (46) | 494 (46) |
| ≥80 | 51 (24) | 254 (24) |
| Number of consultations per patient | Median (IQR) | Median (IQR) |
| In the 2 years | 14 (10–21) | 10 (5–17) |
| Excluding last 180 days | 9 (5–14) | 7 (4–13) |
| Number of ICPC codes per patient | Median (IQR) | Median (IQR) |
| In the 2 years | 28 (18–42) | 18 (9–32) |
| Excluding last 180 days | 17 (9–28) | 13 (7–24) |
For all the summary consultation and code measures there was strong evidence of higher occurrence in cases than controls: over the whole 2 years P<0.001 for both measures. This was not so once the last 180 days were excluded from analysis: P = 0.41 for consultations, P = 0.12 for codes (Mann–Whitney U test).
IR = interquartile range.
ICPC = International Classification of Primary Care.
IQR = interquartile range.
Quality of coding
Inter-observer variation in coding was tested by repeat coding of 188 randomly selected codes by all four coders. The reliability coefficient was 0.83 (95% CI = 0.75 to 0.90).12
Identification of independent associations with cancer
In 2.5% or more of either cases or controls, 172 variables occurred. Abnormal rectal examination findings were classified as benign or malignant depending on the doctor's description. Hard, craggy or nodular glands were classified as malignant. From univariable conditional logistic regressions, 60 variables were considered for multivariable analyses. Selected univariable analyses are shown in Table 2.
Table 2.
Univariable analyses of selected variables.
| Variable | Controls (n = 1080) n (%) | Patient (n = 217) n (%) | Positive likelihood ratio (95% CI) |
|---|---|---|---|
| Symptoms: | |||
| Urinary retention | 33 (15.2) | 18 (1.7) | 9.1 (5.2 to 16) |
| Hesitancy | 37 (17.1) | 21 (1.9) | 8.8 (5.2 to15) |
| Impotence | 67 (30.9) | 38 (3.5) | 8.8 (6.1 to 13) |
| Frequency | 102 (47.0) | 77 (7.1) | 6.6 (5.1 to 8.5) |
| Nocturia | 63 (29.0) | 49 (4.5) | 6.4 (4.5 to 9.0) |
| Haematuria | 33 (15.2) | 54 (5.0) | 3.0 (2.0 to 4.6) |
| First presentation, weight loss | 21 (9.7) | 48 (4.4) | 2.2 (1.3 to 3.6) |
| Second presentation, weight loss | 11 (5.0) | 9 (0.83) | 6.1 (2.6 to 15) |
| Examination findings: | |||
| Rectal examination deemed benign enlargement | 61 (28.1) | 37 (3.4) | 8.2 (5.6 to 12) |
| Rectal examination deemed malignant enlargement | 41 (18.9) | 5 (0.5) | 41 (16 to 100) |
| Investigations: | |||
| PSA >4 ng/ml | 132 (60.8) | 23 (2.1) | 29 (19 to 43) |
| PSA >2 ng/ml | 133 (61.3) | 35 (3.2) | 19 (13 to 27) |
All the variables were more common in cases: P-values <0.001 for all except for the first presentation with loss of weight, with P = 0.002 (conditional logistric regression).
Multivariable analyses
The first and second records of loss of weight were both associated with prostate cancer in the univariable analyses. When they were both added to the same multivariable model, an independent association with prostate cancer was only identified for the second record. Thus the second record was used for all multivariable modelling. In the final model (Table 3), no interactions were found.
Table 3.
Multivariable conditional logistic regression analysis of pre-diagnostic features of prostate cancer.
| Variable | Odds ratio | 95% CI | P-value |
|---|---|---|---|
| Symptoms: | |||
| Urinary retention | 11 | 5.0 to 25.5 | <0.001 |
| Second presentation with loss of weight | 9.2 | 2.7 to 31 | <0.001 |
| Impotence | 5.3 | 2.8 to 9.8 | <0.001 |
| Frequency | 3.2 | 1.9 to 5.4 | <0.001 |
| Hesitancy | 2.9 | 1.1 to 7.5 | 0.032 |
| Nocturia | 2.6 | 1.3 to 5.0 | 0.004 |
| Haematuria | 2.4 | 1.3 to 4.7 | 0.009 |
| Signs: | |||
| Abnormal rectal examination | <0.001 | ||
| No abnormal rectal examination | 1 | ||
| Deemed benign | 3.7 | 1.9 to 7.3 | |
| Deemed malignant | 70 | 13 to 380 | |
A separate multivariable analysis added the results of PSA testing to the variables in Table 3. This model included only the 208 subjects who had been PSA tested (137 patients and 71 controls). In this model, using unmatched regression, the only variable associated with prostate cancer was a PSA >4 ng/ml, with an odds ratio of 29 (95% CI = 3.9 to 220): P = 0.001.
Timing of variable occurrence
Multivariable analysis using data excluding the last 180 days is shown in Table 4. The timings of the four variables from Table 4, in relation to the date of diagnosis, are shown in Figure 1. These graphs show the monthly moving average number of presentations to primary care for each variable.
Table 4.
Multivariable conditional logistics regression analysis of pre-diagnositc features of prostate cancer axcluding the final 180 days.
| Variable | Odds ratio | 95% CI | P-value |
| Symptoms: | |||
| Second presentation with loss of weight | 4.5 | 1.2 to 17 | 0.029 |
| Impotence | 3.3 | 1.8 to 6.0 | <0.001 |
| Frequency | 2.8 | 1.7 to 4.5 | <0.001 |
| Sign: | |||
| Abnormal rectal examination deemed benign enlargement | 2.8 | 1.4 to 5.6 | 0.004 |
Figure 1.
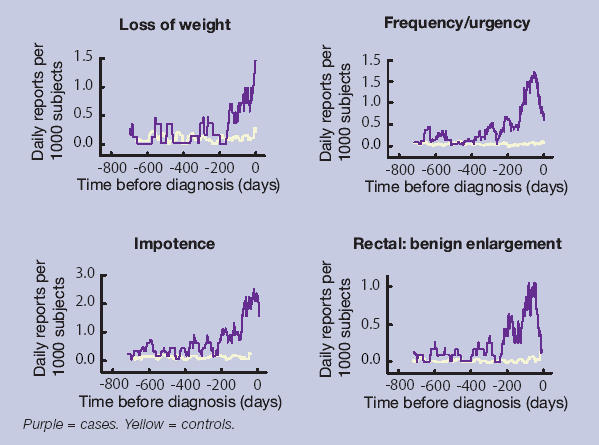
Timing of symptom presentation to primary care in cases and controls.
PPVs for patients consulting a doctor in primary care
The PPVs for particular features of prostate cancer are shown in Figure 2, both individually and together with a second variable. The variables in Figure 2 were selected from the multivariable analysis, after the exclusion of retention (PPV = 3.1%, 95% CI = 1.5 to 6.0) and impotence (PPV = 3.0%, 95% CI = 1.7 to 4.9). PPVs for retention with a second symptom were not calculated, as retention generally requires hospital admission, as a result of which a prostate cancer is likely to be identified. Impotence was generally an isolated symptom: the maximum number of cases reporting both impotence and any second symptom was two. Lower urinary tract symptoms had the highest univariable PPV, which rose considerably when accompanied by a prostate examination, which the GP considered to be malignant.
Figure 2.
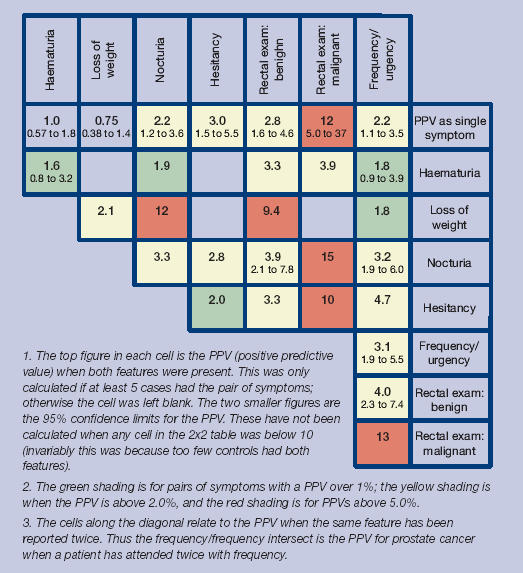
Positive predictive values (%) for prostate cancer for individual features, repeat presentations and for pairs of features (against a background risk of 0.35%).
The following PPVs were higher in older patients: impotence 1.1% aged 40–69 years (against a background risk of 0.12%), 8.4% aged ≥70 years (against a background risk of 1.1%); frequency 0.61% and 7.4%; nocturia 1.1% and 5.9%, rectal examination, deemed benign 0.85% and 8.7%, respectively. There were too few younger patients with the other variables for reliable analysis.
In the sub-analysis excluding the 39 patients who had previously unsuspected cancer identified at prostatectomy, the PPVs of symptoms were little changed (available from authors), other than for retention, which fell to 1.6%.
DISCUSSION
Summary of main findings
Eight clinical features were independently associated with prostate cancer. Four of these remained so 180 days before diagnosis. As well as identifying these features, we were able to quantify the risk they posed, both alone and in combination.
Strengths and limitations of the study
This is the first study to examine the features of prostate cancer in an unselected population. Furthermore, we identified all the cases occurring in a well-defined population, and studied almost all of them. We were also able to calculate PPVs for the consulting population. The study took place in an area where very little PSA screening was undertaken, so the results can be used to inform clinicians about the risk of prostate cancer in symptomatic patients.
The first potential weakness is that recording of symptoms and signs may vary between practices. The matched design will have partly compensated for this. However, doctors may record symptoms more thoroughly if they consider cancer to be a possibility. If this were so, the PPVs will have been over-estimated. The converse, of more recording of symptoms when no diagnosis is apparent, is also possible, but less likely.
Post-mortem studies suggest small foci of cancer are present in a third of men over the age of 50 years.13 Most of these are clinically insignificant cancers. It is likely that identification of prostate cancer was prompted by the presence of lower urinary tract symptoms in some patients in whom the cancer was not the cause of the symptoms. This is a form of verification bias, which has previously been noted for raised PSA tests.14 The most obvious example of this bias will have been the patients who had previously unsuspected cancer identified after a prostatectomy. The sub-analysis excluding these patients made very little difference to the overall results, other than a halving of the PPV for retention. That particular finding was to be expected, as acute retention prompted 19 of the prostatectomies.
Furthermore, verification bias assumes that some controls have covert cancer, which has not been identified, as they were not tested. However, our study examined cancers occurring over a 5-year period, and considered presenting symptoms in the 2-years before the diagnosis of the cancer. Controls who developed prostate cancer were excluded from study. Therefore, our controls had a de facto follow-up period extending from 2–7 years, during which no prostate cancer was diagnosed. That does not exclude the possibility of a cancer in controls entirely, as some prostate cancers are very slow growing, but it does reduce it. Nonetheless, it is likely some verification bias has occurred, with the effect of artificially raising the PPVs for lower urinary tract symptoms.
The large number of variables eligible for multivariable analysis raises the possibility of false positive associations. The extensive analysis should have reduced this problem, to the extent that it removed confounded relationships. In the final model, there were a manageable number of variables, all with very strong evidence of associations both in terms of magnitude and statistical significance. All these clinical features have been reported with prostate cancer before, albeit from secondary care.
Comparison with existing literature
Symptoms
Most of the cases had a lower urinary tract symptom, and this was the main reason that their prostate cancer was uncovered. Four of these symptoms, urinary retention, frequency, hesitancy and nocturia, probably represent enlargement of the prostate gland. Retention had the strongest association of these with cancer. Clearly, cancer needs to be considered as a possibility when the PPV for retention is 3.1%. However, the initial management of acute retention is catheterisation, which generally takes place in secondary care. Assessment there, would usually identify any prostate cancer, either immediately, or later at prostatectomy. The other three lower urinary tract symptoms had odds ratios from 2.6 to 3.2. These symptoms were recorded in 6.4–8.8% of controls. This high frequency in controls meant that the PPV for each of these symptoms was relatively low at 2.2–3.0%, but still several times higher than the background risk of 0.35%. This large increase in the risk of prostate cancer was seen in both age groups, though the background risk was much higher in older men. This finding is important, as the measurement of the PSA when a patient has lower urinary tract symptoms is controversial. Protagonists argue that PSA testing in men with lower urinary tract symptoms should be standard procedure,15 yet others believe it is the equivalent of screening and therefore inappropriate.16 Given that treatment of a malignant gland is different from that of a benign one, our results support diagnostic PSA testing in these circumstances. Our results also show that some cases were reporting their symptoms over 6 months before diagnosis. It is not possible to know if advancing the diagnosis by such a time period improves mortality, but it should at least allow for earlier remission of symptoms.
The strong association between impotence and prostate cancer was unexpected. An association has been reported before in hospital case series, but impotence has been considered to be a late symptom, related to invasion of the neurovascular bundle.17 Furthermore, impotence may occur long before diagnosis, as shown by the analysis excluding the last 180 days. It is unlikely that the symptom of impotence leads directly to the diagnosis of cancer (in the way that retention can) as the routine management of impotence in primary care does not usually include either a rectal examination or PSA testing. It was also generally unaccompanied by reporting of urinary symptoms. Whatever the explanation for this finding, impotence is an important and early marker for prostate cancer, and investigation for possible prostate cancer should be considered.
Haematuria has long been recognised as a risk marker for urological cancer, with a primary care PPV of 10.3% for all urological cancers reported from a Belgian study.18 Our PPV of 1% for prostate cancer accords with that figure, as bladder and renal cancers will account for the majority of malignant causes of haematuria.
Rectal examination
Abnormal findings on rectal examination had the strongest association with prostate cancer. The PPV for an apparently benignly enlarged prostate was 2.8%, and for an apparently malignant one, 12%. This provides good evidence that GPs can discriminate between the two. That 3% of apparently benignly enlarged prostates transpire to be malignant is no surprise, given that several of these patients will have had a prostatectomy. For such cases, it would have been very difficult to disentangle the symptoms of benign prostatic hyperplasia from the symptoms (if any) of the cancer. There is little or no true association between the benign prostatic hyperplasia and prostate cancer, other than benign prostatic hyperplasia increasing the likelihood of a cancer being uncovered.19–21 This may also explain the counterintuitive finding that enlargement of the prostate deemed benign by the examining GP was predictive of cancer in the dataset excluding the last 180 days, yet glands thought to be malignant were not. The glands deemed malignant will have been investigated speedily, which may not have been the case for those deemed benign. Not surprisingly, the multivariable model, which included PSA as a variable did not include benign enlargement of the prostate, implying that once the PSA is tested, the apparently benignly enlarged glands were correctly classified.
PSA testing
Indeed, once the PSA result was added to the multivariable modelling, it was the only variable retaining an association with cancer. This finding suggests a logical sequence of clinical care for a patient consulting with a symptom that may possibly represent prostate cancer. If one of the symptoms from Table 3 is present, or if the prostate gland is enlarged, then the approximate risk of prostate cancer can be taken from Figure 2. If doctor and patient then proceed to PSA testing, the symptoms that prompted testing are no longer pertinent to the risk of prostate cancer — it is the PSA result that matters.
Implications for clinical practice
Most diagnostic research on prostate cancer has been on screening: symptomatic cancer has been largely ignored. Our results show that lower urinary tract symptoms have a small — but real — risk of cancer. Impotence is also an important early symptom of prostate cancer. Given that the treatment of malignant prostatic enlargement is different from benign prostatic enlargement, our results suggest that PSA testing in men with lower urinary tract symptoms is appropriate. Counselling of men before a PSA test can also now include a discussion of the actual risk involved.
Acknowledgments
We wish to thank all 21 general practices in Exeter, the Dendrite personnel, and the Patients and Practitioners Service Authority, and S. Stapley, J. Barrett, B. Laws, H. Massie, C. Stabb and A. Waterlow for their professional work as research staff.
Funding body
Project funding from the Department of Health (policy research programme – 19). The funding source had no role in study design, data collection, analysis or writing of the report. All authors had full control of the data, and take final responsibility for publication. William Hamilton was funded through his research practice (Barnfield Hill, Exeter) and RCGP/BUPA and NHS Fellowships. The views expressed in the publication are those of the authors and not necessarily those of the Department of Health
Ethics committee
This was obtained from North and East Devon Local Research Ethics Committee (2001/8/121)
Competing interests
The authors have stated that there are none
REFERENCES
- 1.Cancer Research UK. CancerStats monograph 2004. London: Cancer Research UK; 2004. [Google Scholar]
- 2.Frankel S, Smith GD, Donovan J, Neal D. Screening for prostate cancer. Lancet. 2003;361:1122–1128. doi: 10.1016/S0140-6736(03)12890-5. [DOI] [PubMed] [Google Scholar]
- 3.Bill-Axelson A, Holmberg L, Ruutu M, et al. Radical prostatectomy versus watchful waiting in early prostate cancer. N Engl J Med. 2005;352:1977–1984. doi: 10.1056/NEJMoa043739. [DOI] [PubMed] [Google Scholar]
- 4.Walsh PC. Surgery and the reduction of mortality from prostate cancer. N Engl J Med. 2002;347:839–840. doi: 10.1056/NEJMe020089. [DOI] [PubMed] [Google Scholar]
- 5.Gjengsto P, Eide J, Frugard J, et al. The potentially curable prostate cancer patient and the pathways leading to diagnosis and treatment. Scand J Urol Nephrol. 2004;38:15–18. doi: 10.1080/00365590310019990. [DOI] [PubMed] [Google Scholar]
- 6.Selley S, Donovan J, Faulkner A, et al. Diagnosis, management and screening of early localised prostate cancer. Health Technol Assess. 1997;1:1–96. [PubMed] [Google Scholar]
- 7.Hamilton W, Sharp D. Symptomatic diagnosis of prostate cancer in primary care: a structured review. Br J Gen Pract. 2004;54:617–621. [PMC free article] [PubMed] [Google Scholar]
- 8.Hamilton W, Round A, Sharp D, Peters T. Clinical features of colorectal cancer before diagnosis: a population-based case-control study. Br J Cancer. 2005;93(4):399–405. doi: 10.1038/sj.bjc.6602714. [DOI] [PMC free article] [PubMed] [Google Scholar]
- 9.Hamilton W, Peters T, Sharp D, Round A. What are the clinical features of lung cancer before the diagnosis is made? A population-based case-control study. Thorax. 2005;60(12):1059–1065. doi: 10.1136/thx.2005.045880. [DOI] [PMC free article] [PubMed] [Google Scholar]
- 10.WONCA. ICPC-2. International Classification of Primary Care. Prepared by the Classification Committee of WONCA. Oxford: Oxford University Press; 1998. [Google Scholar]
- 11.Barrett J, Hamilton W. Pathways to the diagnosis of prostate cancer in an English city: a population based survey. Scand J Urol Nephrol. 2005;39:267–270. doi: 10.1080/00365590510031282. [DOI] [PubMed] [Google Scholar]
- 12.Streiner D, Norman G. Health measurement scales. 3rd edn. Oxford: Oxford University Press; 2003. [Google Scholar]
- 13.Sakr WA, Haas GP, Cassin BF, et al. The frequency of carcinoma and intraepithelial neoplasia of the prostate in young male patients. J Urol. 1993;150:379–385. doi: 10.1016/s0022-5347(17)35487-3. [DOI] [PubMed] [Google Scholar]
- 14.Punglia RS, D'Amico AV, Catalona WJ, et al. Effect of verification bias on screening for prostate cancer by measurement of prostate-specific antigen. N Engl J Med. 2003;349:335–342. doi: 10.1056/NEJMoa021659. [DOI] [PubMed] [Google Scholar]
- 15.Farmer A. 10-minute consultation: prostatic symptoms. BMJ. 2001;322:1468. doi: 10.1136/bmj.322.7300.1468. [DOI] [PMC free article] [PubMed] [Google Scholar]
- 16.Jenkins L, Rose P, Wilson T. Screening by the back door. BMJ. 2001;322:750–751. [PMC free article] [PubMed] [Google Scholar]
- 17.Brawer MK. The diagnosis of prostatic carcinoma. Cancer. 1993;71(3 Suppl):899–905. doi: 10.1002/1097-0142(19930201)71:3+<899::aid-cncr2820711406>3.0.co;2-6. [DOI] [PubMed] [Google Scholar]
- 18.Bruyninckx R, Buntinx F, Aertgeerts B, Van Casteren V. The diagnostic value of macroscopic haematuria for the diagnosis of urological cancer in general practice. Br J Gen Pract. 2003;53:31–35. [PMC free article] [PubMed] [Google Scholar]
- 19.Coley CM, Barry MJ, Fleming C, et al. Early detection of prostate cancer. Part II: estimating the risks, benefits, and costs. American College of Physicians. Ann Intern Med. 1997;126(6):468–479. doi: 10.7326/0003-4819-126-6-199703150-00010. [DOI] [PubMed] [Google Scholar]
- 20.Guess HA. Benign prostatic hyperplasia and prostate cancer. Epidemiol Rev. 2001;23(1):152–158. doi: 10.1093/oxfordjournals.epirev.a000782. [DOI] [PubMed] [Google Scholar]
- 21.Chokkalingam AP, Nyren O, Johansson JE, et al. Prostate carcinoma risk subsequent to diagnosis of benign prostatic hyperplasia: a population-based cohort study in Sweden. Cancer. 2003;98(8):1727–1734. doi: 10.1002/cncr.11710. [DOI] [PubMed] [Google Scholar]