Abstract
Aim: To identify retinal exudates automatically from colour retinal images.
Methods: The colour retinal images were segmented using fuzzy C-means clustering following some key preprocessing steps. To classify the segmented regions into exudates and non-exudates, an artificial neural network classifier was investigated.
Results: The proposed system can achieve a diagnostic accuracy with 95.0% sensitivity and 88.9% specificity for the identification of images containing any evidence of retinopathy, where the trade off between sensitivity and specificity was appropriately balanced for this particular problem. Furthermore, it demonstrates 93.0% sensitivity and 94.1% specificity in terms of exudate based classification.
Conclusions: This study indicates that automated evaluation of digital retinal images could be used to screen for exudative diabetic retinopathy.
Keywords: diabetic retinopathy, exudates, segmentation, neural networks
Intraretinal fatty (hard) exudates are a visible sign of diabetic retinopathy and a marker for the presence of co-existent retinal oedema. If present in the macular area, they are a major cause of treatable visual loss in the non-proliferative forms of diabetic retinopathy. It would be useful to have an automated method of detecting exudates in digital retinal images produced from diabetic retinopathy screening programmes.
Sinthanayothin1 identified exudates in grey level images based on a recursive region growing technique. The sensitivity and specificity reported were 88.5% and 99.7%; however, these measurements were based on 10×10 windows where each window was considered as an exudate or a non-exudate region. The reported sensitivity and specificity only represent an approximate accuracy of exudate recognition, because any particular 10×10 window may be only partially affected by exudates. Gardner et al2 used a neural network (NN) to identify the exudates in grey level images. The authors reported a sensitivity of 93.1%. Again this was the result of classifying whole 20×20 regions rather than a pixel level classification. One novelty of our proposed method here is that we locate exudates at pixel resolution rather than estimate for regions. We evaluate the performance of our system applying both lesion based and image based criteria in colour retinal images.
MATERIALS AND METHODS
We used 142 colour retinal images obtained from a Canon CR6-45 non-mydriatic retinal camera with a 45° field of view as our initial image dataset. This consisted of 75 images for training and testing our NN classifier in the exudate based classification stage. The remaining 67 colour images were employed to investigate the diagnostic accuracy of our system for identification of images containing any evidence of retinopathy. The image resolution was 760×570 at 24 bit RGB.
Preprocessing
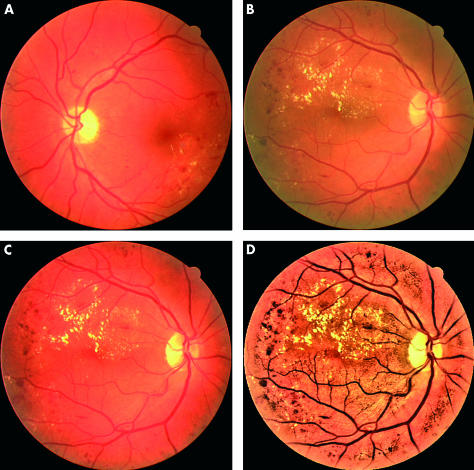
Typically, there is wide variation in the colour of the fundus from different patients, related to race and iris colour. The first step is therefore to normalise the retinal images across the set. We selected a particular retinal image as a reference and then used histogram specification3 to modify the values of each image in the database such that its frequency histogram matched the reference image distribution (Fig 1C). In the next preprocessing step, local contrast enhancement was performed to distribute the values of the pixels around the local mean to facilitate later segmentation.4 This operation was applied only on the intensity channel I of the image after it was converted from RGB to the hue-saturation-intensity (HSI) colour space, so it would not affect the colour attributes of the image.
Figure 1.
Colour normalisation and local contrast enhancement: (A) reference image, (B) typical retinal image (including exudates), (C) colour normalised version, (D) after contrast enhancement.
Image segmentation
Image segmentation is a process of partitioning image pixels based on one or more selected image features and in this case the selected segmentation feature is colour. The objective is to separate pixels that have distinct colours into different regions and, simultaneously, group pixels that are spatially connected and have a similar colour into the same region. Fuzzy C-means (FCM) clustering allows pixels to belong to multiple classes with varying degrees of membership.5 The segmentation approach is based on a coarse and a fine stage. The coarse stage is responsible for evaluating Gaussian smoothed histograms of each colour band of the image, in order to produce an initial classification into a number of classes and the centre for each cluster.6 In the fine stage, FCM clustering assigns any remaining unclassified pixels to the closest class based on the minimisation of an objective function.
Figure 2A illustrates an example result after this colour segmentation stage, showing the division into three classes (cf Fig 1D). Figure 2B shows the candidate exudate regions overlaid on the original image and Figure 2C illustrates the result of final classification after some exudate candidate regions are eliminated (details later).
Figure 2.
Colour image segmentation: (A) FCM segmented image, (B) candidate exudate regions overlaid on the original image, and (C) final classification (after subsequent neural network classification).
Feature extraction
To classify the segmented regions into exudate or non-exudate classes we must represent them using relevant and significant features that produce the best class separability. It is worth noting that after FCM, false positive exudate candidates arise because of other pale objects including retinal light reflections, cotton wool spots and, most significantly, the optic disc. The optic disc regions were removed before classification using our automatic optic disc localisation method.7 The segmented regions are differentiated using features such as colour, size, edge strength, and texture. We experimented with a number of colour spaces including RGB, HIS, Lab, and Luv and found that colour spaces which separate luminance and chrominance are more suitable (for example, Luv). After a comparative study of the discriminative attributes of different possible features, 18 were chosen (Table 1).
Table 1.
Selected feature set
| Feature | Description |
| 1–3 | Mean Luv value inside the region (Lμi,Uμi,Vμi) |
| 4–6 | Standard deviation of Luv value inside the region (Lσi,Uσi,Vσi) |
| 7–9 | Mean Luv value outside the region (Lμo,Uμo,Vμo) |
| 10–12 | Standard deviation of Luv value outside the region (Lσo,Uσo,Vσo) |
| 13–15 | Luv values of region centroid (Lc,Uc,Vc) |
| 16 | Region size (S) |
| 17 | Region compactness (C) |
| 18 | Region edge strength(E) |
Classification
In the object classification stage we used a three layer perceptron neural network8 with 18 input nodes corresponding to our feature set. We experimented with a hidden layer with a range of 2–35 hidden units to find the optimum architecture (15 hidden units). A single output node gave the final classification probability. FCM clustering was applied to the 75 colour images of our prepared image dataset including 25 normal and 50 abnormal images. The outcome of the segmentation step was 3860 segmented regions consisting of 2366 exudates and 1494 non-exudates, which were considered negative cases. These regions were then labelled as exudate or non-exudate by a clinician to obtain a fully labelled dataset of examples. Two different learning methods, including standard back propagation (BP) and scaled conjugate gradient (SCG) descent8 were investigated for training the NNs. Table 2 summarises the optimum results obtained on the test set for our NN configurations. For each NN the output threshold (T) value giving the balance between sensitivity and specificity is also shown. The BP-NN with 15 hidden units represented better balance between sensitivity and specificity. On the other hand, SCG could represent a higher level of sensitivity accuracy.
Table 2.
Performance comparison of different classifiers (values as %)
| Classifier | Sensitivity | Specificity | |
| NN-BP (15 hidden) | (T = 0.50) | 93.0 | 94.1 |
| NN-SCG (15 hidden) | (T = 0.45) | 97.9 | 85.2 |
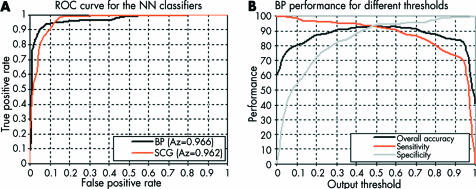
The optimum threshold value depends on the diagnostic requirements and can be defined based on the requirements set by medical experts. In order to demonstrate how changing this value can affect the performance of a NN classifier and the balance between sensitivity and specificity criteria, a receiver operating characteristic (ROC) curve9 was produced. The bigger the area under the ROC curve (Az), the higher is the probability of making a correct decision. Figure 3A compares the behaviour of the NN classifiers for the full range of output threshold values. The BP-NN achieved a very good performance with Az = 0.966. Figure 2C illustrates the final classification result for a typical retinal image using this BP network classifier. Similarly, the SCG network with 15 hidden units, also demonstrated a high generalisation performance with Az = 0.962. Figure 3B illustrates the behaviour of the BP classifier and provides a guide for selecting the most appropriate output threshold based on the problem requirements and the related diagnostic accuracy including sensitivity and specificity.
Figure 3.
Performance of the BP neural network as a function of output threshold.
So far we have discussed pixel by pixel based lesion classification. We can use this to evaluate the effectiveness of our proposed approach by assessing the image based accuracy of the system. A population of 67 different retinal images, from our initial dataset, was considered (27 normal 40 abnormal). Each retinal image was evaluated using the BP neural network classifier and a final decision was made to determine whether the image had some evidence of diabetic retinopathy. The BP classifier could identify affected retinas (including exudates) with 95.0% sensitivity while it correctly classified 88.9% of normal images—that is, the specificity.
RESULTS AND DISCUSSION
We presented a study in detecting retinal exudates using FCM segmentation and a NN based on different learning methods. The best diagnostic accuracy was 93.0% sensitivity and 94.1% specificity in terms of lesion based classification, and 95.0% sensitivity and 88.9% specificity for the identification of patients with evidence of retinopathy, where the trade off between sensitivity and specificity was appropriately balanced for this particular problem.
At present, the full computation comprising segmentation, removal of false positives (for example, the optic disc), and NN classification takes around 11 minutes on a 700 MHz PC which includes an unoptimised step in the optic disc removal stage7 lasting around 10 minutes.
The results demonstrated here indicate that automated diagnosis of exudative retinopathy based on colour retinal image analysis can be very successful in detecting exudates. Hence, the system could be used to evaluate digital retinal images obtained in screening programmes for diabetic retinopathy and used by non-experts to indicate which patients require referral to an ophthalmologist for further investigation and treatment.
Acknowledgments
A Osareh is on a scholarship funded by the Iranian Ministry of Science, Research and Technology. The authors also thank the UK National Eye Research Center for their support.
REFERENCES
- 1.Sinthanayothin C. Image analysis for automatic diagnosis of diabetic retinopathy. PhD Thesis. London: King’s College, 1999.
- 2.Gardner GG, Keating D, Williamson TH, et al. Automatic detection of diabetic retinopathy using an artificial neural network: a screening tool. Br J Ophthalmol 1996;86:940–4. [DOI] [PMC free article] [PubMed] [Google Scholar]
- 3.Jain AK. Fundamentals of digital image processing New York: Prentice-Hall, 1989.
- 4.Sinthanayothin C, Boyce J, Williamson CT. Automated localisation of the optic disc, fovea, and retinal blood vessels from digital colour fundus images. Br J Ophthalmol 1999;38:902–10. [DOI] [PMC free article] [PubMed] [Google Scholar]
- 5.Bezdek J, Keller J, Krisnapuram R, et al. Fuzzy model and algorithms for pattern recognition and image processing London: Kluwer Academic Publishers, 1999.
- 6.Lim YW, Lee SU. On the colour image segmentation algorithm based on the thresholding and the fuzzy c-means techniques. Pattern Recognition 1990;23:935–52. [Google Scholar]
- 7.Osareh A, Mirmehdi M, Thomas B, et al. Comparison of colour spaces for optic disc localisation in retinal images. In: 16th International Conference on Pattern Recognition 2002:743–6.
- 8.Bishop CM. Neural networks for pattern recognition Oxford: Clarendon Press, 1995.
- 9.Henderson AR. Assessing test accuracy and its clinical consequences: a primer for receiver operating characteristics curve analysis. Ann Clin Biochem 1993;30:521–39. [DOI] [PubMed] [Google Scholar]


