

Abstract
Background
An essential first step in the genomic characterisation of a new species, in this case Atlantic halibut (Hippoglossus hippoglossus), is the generation of EST information. This forms the basis for subsequent microarray design, SNP detection and the placement of novel markers on genetic linkage maps.
Results
Normalised directional cDNA libraries were constructed from five different larval stages (hatching, mouth-opening, midway to metamorphosis, premetamorphosis, and post-metamorphosis) and eight different adult tissues (testis, ovary, liver, head kidney, spleen, skin, gill, and intestine). Recombination efficiency of the libraries ranged from 91–98% and insert size averaged 1.4 kb. Approximately 1000 clones were sequenced from the 5'-end of each library and after trimming, 12675 good sequences were obtained. Redundancy within each library was very low and assembly of the entire EST collection into contigs resulted in 7738 unique sequences of which 6722 (87%) had matches in Genbank. Removal of ESTs and contigs that originated from bacteria or food organisms resulted in a total of 7710 unique halibut sequences.
Conclusion
A Unigene collection of 7710 functionally annotated ESTs has been assembled from Atlantic halibut. These have been incorporated into a publicly available, searchable database and form the basis for an oligonucleotide microarray that can be used as a tool to study gene expression in this economically important aquacultured fish.
Background
Atlantic halibut is a cold-water flatfish native to the North Atlantic that shows excellent potential for production in aquaculture due to its highly prized white flesh. Flatfish have long been a choice food fish, with many members of the group e.g., halibuts, flounders, soles, turbot, and plaice, having great commercial value especially in Asia. With the general worldwide decline in the wild fishery, and the predicted global collapse of all currently fished species by the year 2048 [1], it is crucial that alternatives such as aquaculture be pursued. Investigations into producing flatfish by aquaculture have been underway for the last fifteen to twenty years. Aquaculture production of Japanese flounder, turbot, Atlantic halibut and others has now been successfully achieved, although improvements in efficiency are still clearly required.
Production of Atlantic halibut is relatively recent and is currently underway in Norway, Iceland, Scotland and Canada. Significant hurdles must still be overcome, particularly with regard to judging when to spawn females, reproduction and sex determination [2], nutrition [3,4], and enhancing disease resistance. The application of genomics technologies to thoroughly characterize the biological processes of reproduction, development, nutrition, and immunity promises to improve our knowledge of this poorly understood fish and provide for long-term enhancements in aquaculture production.
Flatfish, members of the order Pleuronectiformes, comprise a biologically interesting group of fish. During development, in a process known as metamorphosis, these fish reorient themselves to lie on one side, the body flattens, and the eye migrates to the other side of the body. This settling of the fish on the side vacated by the migrating eye requires a complex reorganization of skeletal, nervous and muscle tissues [5]. Significant losses due to mortality in the early larval stages, as well as developmental abnormalities such as malpigmentation [6,7], bone deformities [8], and incomplete eye migration [8], have hampered the successful production of flatfish. A better understanding of these processes at the molecular level and the impact that rearing conditions have on survival, metamorphosis, and growth will improve the commercial feasibility of flatfish aquaculture.
Expressed sequence tag (EST) surveys of species of interest provide a great deal of information-rich data on the expressed portion of an organism's genome [9] and are invaluable in comparative genomics [10]. In addition, they can be an important source of microsatellites and single nucleotide polymorphisms (SNPs) that can be used for genetic mapping [11]. EST surveys in teleosts have been performed from both non-normalised cDNA libraries and libraries generated by suppression subtractive hybridisation [12] in order to elucidate genes involved in immunity [13-28], muscle formation [29], endocrinology [30-32], and toxin production [33]. The most highly represented teleost in dbEST is the zebrafish, Danio rerio, with over 1.3 million ESTs. Salmonids are also well-represented with over half a millions ESTs. Economically important fish species such as catfish, cod, Japanese flounder, sea bream and sea bass have increasingly been the subject of genomic studies and these species are now represented by several thousand or even tens of thousands of ESTs.
Among the flatfish, considerable effort has been made to determine ESTs for Japanese flounder [13,17,22]. There are currently 8842 ESTs for this species, although most are unannotated. Furthermore, the majority of these sequences arise from non-normalised cDNA libraries or those constructed from immune-stimulated fish; few ESTs have been sequenced from non-immune tissues or different developmental stages of flatfish. For turbot, the other main commercially relevant flatfish, there are no published EST studies and most of the sequences from this species in GenBank are microsatellites or rRNA.
As a first step towards developing genomics tools for Atlantic halibut, a large-scale EST survey was performed, annotations undertaken where possible, and a searchable database set up. Considerable effort has been made to annotate these ESTs and associate them with Gene Ontology (GO) terms to facilitate subsequent microarray analyses. The species-independent structured GO vocabulary [34] is widely accepted and used in most large scale genome annotation projects.
Results
cDNA libraries and ESTs
Normalized cDNA libraries were constructed from eight Atlantic halibut tissues and five developmental stages. For all libraries, the percentage of clones with inserts was high, ranging from 91 to 98%, with average insert sizes between 1.3 and 1.6 kb (Table 1). After trimming and vector removal, 12675 good sequences were obtained. Average read length after trimming for each library was approximately 600–700 bp with the majority of reads compiled from all 13 libraries being between 700 and 800 bp (Figure 1). Clustering of the sequences using Paracel transcript assembler yielded 7738 unique sequences (redundancy factor of 1.6), demonstrating the excellent normalization achieved by this approach. Twenty-eight ESTs or EST clusters, mostly from later larval stages, had matches to food organisms such as Artemia and were removed from the database. The 7710 remaining unique ESTs consisted of 2556 unique clusters and 5154 singletons. The normalization of the libraries precludes an accurate analysis of transcript abundance, although sequences present multiple times in the normalized libraries presumably correspond to high abundance transcripts. Of the clones that were represented 5 times or more in a given library, the most common were a lectin-like protein, a 14 Kda apolipoprotein, tropomyosin, parvalbumin, and apolipoprotein A1 (Table 2). Parvalbumin, lectin-like protein and the 14 Kda apolipoprotein were each over-represented in two libraries.
Table 1.
Characteristics of Atlantic halibut normalised cDNA libraries
| Redundancy | ||||||||
| Library | Recom. Eff. | # Clones | Avg. insert size (kb) | 2 | 3 | 4 | 5 to 15 | |
| Tissue | Gill | 95 | 933 | 1.4 | 42 | 5 | 0 | 1 |
| Head Kidney | 94 | 932 | 1.4 | 23 | 2 | 0 | 0 | |
| Intestine | 91 | 910 | 1.3 | 45 | 9 | 0 | 0 | |
| Liver | 95 | 906 | 1.3 | 69 | 13 | 4 | 3 | |
| Ovary | 98 | 1609 | 1.5 | 154 | 27 | 6 | 4 | |
| Skin | 97 | 945 | 1.4 | 32 | 6 | 1 | 1 | |
| Spleen | 91 | 898 | 1.4 | 29 | 4 | 0 | 0 | |
| Testis | 95 | 1532 | 1.5 | 84 | 11 | 1 | 0 | |
| Larval | Hatching | 96 | 953 | 1.6 | 67 | 9 | 1 | 3 |
| Mouth-opening | 97 | 950 | 1.4 | 39 | 5 | 3 | 5 | |
| Midway to Metamorphosis | 97 | 915 | 1.6 | 41 | 0 | 1 | 0 | |
| Premetamorphosis | 94 | 929 | 1.4 | 47 | 3 | 0 | 0 | |
| Postmetamorphosis | 96 | 915 | 1.5 | 30 | 5 | 1 | 3 | |
The recombination efficiency represents the number of clones containing inserts. The number of clones sequenced, the average insert size in kb (based on analysis of 96 clones), and the number of clones represented more than once (redundancy) for each library are presented.
Figure 1.
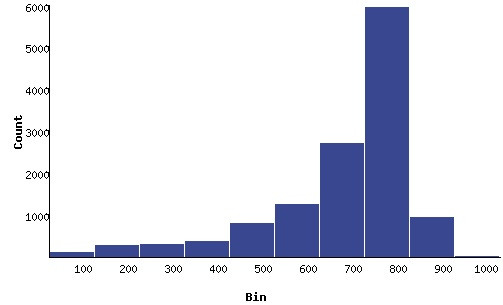
Representation of sequencing read lengths of Atlantic halibut Expressed Sequence Tags (ESTs). Read lengths were binned in 100 base pair (bp) increments. Most of the ESTs fall into the 700–800 bp bin.
Table 2.
Most highly represented clones found in each cDNA library
| Library | Gene | Accession # | # hits |
| Gill | lectin-like protein | AAI15054.1 | 7 |
| Liver | epoxide hydrolase | NP_957362.1 | 5 |
| 14 kDa apolipoprotein | CAH57705.1 | 16 | |
| Ovary | ribosomal protein L3 | CAF95545.1 | 5 |
| transaldolase 1 | AAH68191.1 | 5 | |
| fish eggshell protein | AAS55644.1 | 5 | |
| unknown EST | AW012936.1 | 6 | |
| Skin | lectin-like protein; | AAI15054.1 | 7 |
| Hatch | NAD(P)H dehydrogenase quinone 1 | ABD43173.1 | 5 |
| lipocalin family | CAF97961.1 | 6 | |
| Mouth-opening | parvalbumin beta | AAK63087.1 | 5 |
| myosin heavy chain | BAB12571.1 | 5 | |
| 14 kDa apolipoprotein | CAH57705.1 | 6 | |
| apolipoprotein AI precursor | CAH59609.1 | 8 | |
| tropomyosin | BAB20881.1 | 13 | |
| Post-metamorphosis | alpha actin 1 | AAH45406.1 | 5 |
| myosin light chain 2 | CAD32552.1 | 6 | |
| parvalbumin beta | AAK63087.1 | 10 |
Genes that were represented more than five times in a given cDNA library are listed.
Screening of EST sequences for short tandem repeats (2 – 5 bp) identified 129 that contained microsatellite sequences. Of these, 60 had 2 bp repeats (mostly GT or GA), 58 had 3 bp repeats, 7 had 4 bp repeats and 4 had 5 bp repeats. Sixty of these loci were polymorphic and were incorporated into our halibut linkage map (D. Reid, C. Smith, D. Martin-Robichaud, M. Reith, unpublished). All EST data have been deposited in GenBank (accession numbers EB029285–EB041700 &EB080851–EB080975), and preliminary annotations are available on the Pleurogene website [35].
Annotation
All ESTs and clusters were initially annotated with AutoFACT, which carries out a series of Blast analyses to identify the EST and attempts to assign function and/or pathway information. AutoFACT provided product or gene names for 4786 sequences (62%) and 254 additional sequences had domain names associated with them (Table 3). Of the remaining sequences, 28 matched ribosomal RNAs, 824 matched unassigned proteins, 802 matched unknown ESTs, and 1016 had no database hits ("unclassified").
Table 3.
Classification of Atlantic halibut unique sequences
| Classification | Classification Method | GO source | Number of Sequences | |||
| Unclassified | No BLAST hit | 1016 | ||||
| Ribosomal RNA | rRNA hit | 28 | ||||
| Unassigned protein | BLAST hit >e-10 to unknown protein | 824 | ||||
| Unknown EST | BLAST hit >e-10 to unknown EST | 802 | ||||
| Functionally annotated protein | BLAST hit >e-10 to known protein | 5040 | ||||
| Informative terms | 4786 | |||||
| Domain name-containing protein | 254 | |||||
| Gene Ontology (107) | 3878 | |||||
| AutoFACT | 1640 | |||||
| Goblet | 1736 | |||||
| InterPro | 605 | |||||
| KEGG (185) | 578 | |||||
| COG (22) | 1191 | |||||
| Total | 7710 | 5040 | ||||
Numbers of sequences associated with AutoFact classification. The method of classifying functionally annotated proteins is indicated and the numbers of categories identified by GO, KEGG and COG are given in brackets. GO classifications were obtained using Goblet and Interpro information as well as AutoFACT.
Of the 5040 functionally annotated and domain name-containing sequences, Gene Ontology (GO) classifications were found for 3878 using AutoFACT, Goblet and InterPro. The distribution of sequences among GO classifications are represented in Figures 2, 3, 4. Sequences with GO terms corresponding to cellular component fell into 27 categories (Figure 2), molecular function into 34 categories (Figure 3) and biological process into 46 categories (Figure 4). Clusters of Orthologous Groups (COG; [36]) categories were determined for 1191 sequences, and Kyoto Encyclopedia of Genes and Genomes (KEGG; [37]) categories were found for 578 sequences. Sequences assigned to COG fell into 22 categories and those assigned to KEGG fell into 185 pathways (Table 3).
Figure 2.
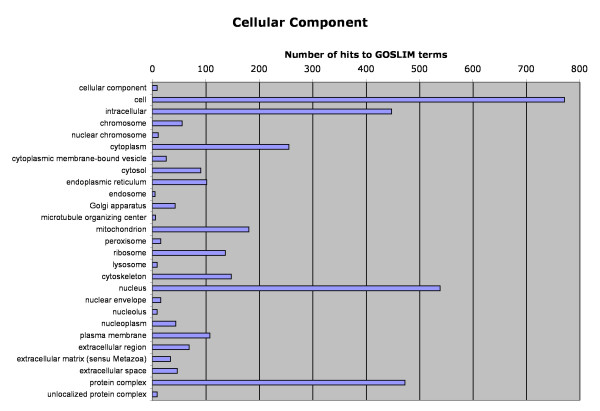
Classification of Atlantic halibut unique sequences according to Gene Ontology (GO) category: cellular component.
Figure 3.
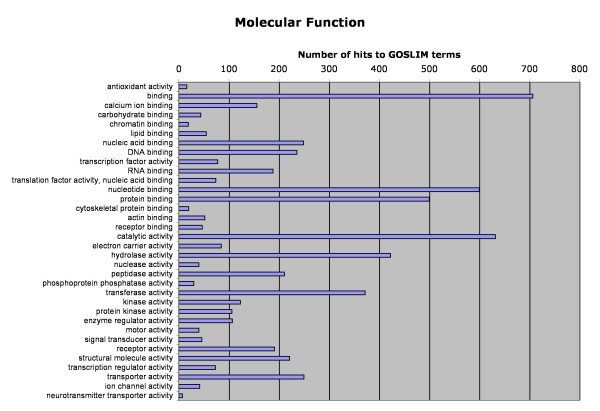
Classification of Atlantic halibut unique sequences according to Gene Ontology (GO) category: molecular function.
Figure 4.
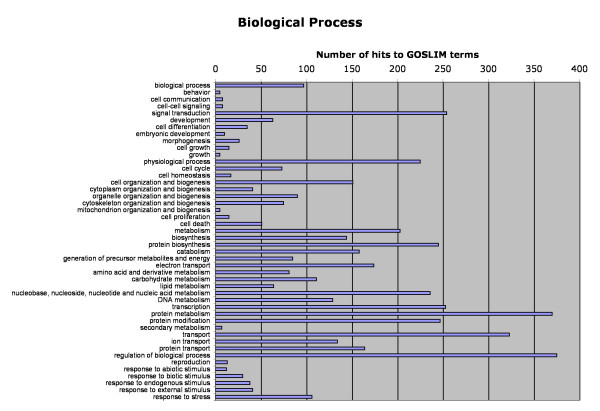
Classification of Atlantic halibut unique sequences according to Gene Ontology (GO) category: biological process.
We also performed a similar analysis on the 4110 partially annotated Atlantic halibut sequences deposited in GenBank by other groups. After assembly, a unigene set of 2337 sequences was obtained of which 40 were rRNA, 781 were unclassified, 80 matched unassigned proteins and 1436 were informative annotations. However, of the informative annotations, 531 fell into five clusters: nuclease diphosphate kinase B (73), cytochrome c oxidase subunit III (109), cytochrome c oxidase subunit II (182), cytochrome c oxidase subunit I (62) and cytochrome b (105). Similarly, of the 788 sequences that received COG annotations, over half (487) were associated with energy production and conversion, and were predominantly of mitochondrial origin.
When the complete EST set of 12675 sequences was searched for GO terms using the GOSLIM classification, two libraries were substantially more enriched in GOSLIM terms than others: the ovary library had 4496, and the testis library had 3371 hits to GOSLIM terms, respectively. Some of this enrichment can be explained by the increased number of ESTs sequenced from these libraries (50%), but even taking this into account, there are still many more GOSLIM terms in each of these libraries than the other tissue-specific libraries, which have between 1017 (gill) and 1871 (liver) terms. Of the larval libraries, that from the mouth-opening stage had 2415 hits to GOSLIM terms. Interestingly, the library constructed from larvae midway to metamorphosis had only 443 hits to GOSLIM terms. The remainder of the libraries had between 1444 and 1788 GOSLIM terms.
Functional categories of cDNAs
The functional categories included in the COG and GO classification schemes are not entirely congruent and thus not directly comparable. Broadly speaking, the COG classification gave a good overview of the cellular processes represented in the EST library. As can be seen from Table 4, approximately one third of the ESTs are associated with a COG category related to transport, metabolism and energy, 44% of the ESTs are associated with nucleic acid processes, and 4% of the ESTs are associated with cell structure. The remainder of the classified ESTs represent genes involved in signal transduction, defense and intracellular trafficking. KEGG annotations were found for 578 different sequences, the most common pathways represented are shown in Table 5.
Table 4.
Classification of Atlantic halibut unique sequences according to COG
| Category | # | % |
| Amino acid transport and metabolism | 72 | 6.05 |
| Carbohydrate transport and metabolism | 61 | 5.12 |
| Coenzyme transport and metabolism | 22 | 1.85 |
| Inorganic ion transport and metabolism | 27 | 2.27 |
| Lipid transport and metabolism | 42 | 3.53 |
| Nucleotide transport and metabolism | 43 | 3.61 |
| Secondary metabolites biosynthesis, transport and catabolism | 13 | 1.09 |
| Energy production and conversion | 128 | 10.75 |
| Total metabolism and energy | 408 | 34.26 |
| Cell cycle control, cell division, chromosome partitioning | 10 | 0.84 |
| Chromatin structure and dynamics | 14 | 1.18 |
| Replication, recombination and repair | 41 | 3.44 |
| RNA processing and modification | 6 | 0.50 |
| Transcription | 51 | 4.28 |
| Translation, ribosomal structure and biogenesis | 188 | 15.79 |
| Posttranslational modification, protein turnover, chaperones | 211 | 17.72 |
| Total nucleic acid processes | 521 | 43.74 |
| Cell wall/membrane/envelope biogenesis | 6 | 2.14 |
| Cytoskeleton | 40 | 3.36 |
| Total cell structure | 46 | 3.86 |
| Intracellular trafficking, secretion, and vesicular transport | 37 | 3.11 |
| Signal transduction mechanisms | 33 | 2.77 |
| Defense mechanisms | 4 | 0.34 |
| General function prediction only | 132 | 11.08 |
| Function unknown | 10 | 0.84 |
| Total | 1191 | 100.00 |
Categories were broadly grouped into metabolism and energy, nucleic acid processes and cell structure. The number (#) and percent (%) of ESTs in each category is shown.
Table 5.
Most commonly represented KEGG classifications of Atlantic halibut unique sequences
| Category | # | % |
| Oxidative phosphorylation | 101 | 17.5 |
| Ribosome | 58 | 10.0 |
| Purine & pyrimidine metabolism | 41 | 7.1 |
| Proteasome | 27 | 4.6 |
| Cell communication | 21 | 3.6 |
| SNARE interactions and vesicular transport | 17 | 2.9 |
| Arginine and proline metabolism | 16 | 2.8 |
| Transcription factors | 16 | 2.8 |
| Complement and coagulation cascades | 13 | 2.2 |
| Glycan structures | 12 | 2.1 |
| Arachidonic acid metabolism | 11 | 1.9 |
Categories with more than ten sequences out of a total of 578 are listed. The number (#) and percent (%) of ESTs in each category is shown.
Discussion
To improve our understanding of flatfish biology and the problems associated with their development and rearing, a comparative genomics program focusing on Atlantic halibut and Senegal sole (Solea senegalensis) has been initiated (see [35]). As a prelude to construction of a DNA microarray, the EST survey reported here has been carried out.
Two previous EST surveys have been conducted in Atlantic halibut: one from a study of the effect of vaccination [28], resulting in approximately 1000 sequences, and a second from an investigation of muscle somite formation [38], resulting in approximately 4250 sequences. The study reported here greatly enriches the genomic resources for this commercially important flatfish by adding more than 12,000 ESTs to the partially annotated sequences that had already been deposited.
Over 5000 of the 7710 unique transcripts represented by the ESTs have been functionally annotated. These annotations and the development of a searchable database containing all of the information associated with each EST add enormous value to such a study. The main categories of genes represented in the ESTs are involved in binding, catalytic activity, transport, metabolism, response to stimuli, signal transduction, nucleic acid processes, and cellular biogenesis. Again, this adds substantially to the Atlantic halibut sequences from other research groups, many of which were of mitochondrial origin, and which contained slightly over 900 informative AutoFACT annotations.
With only modest resources for EST sequencing available, we choose to normalize our cDNA libraries so as to maximize the number of different ESTs sequenced. The normalization method used (Evrogen Trimmer kit) was very effective at reducing the number of highly expressed cDNAs. Since the libraries are well-normalised (redundancy factor of only 1.5), it is not possible to gain insights into the actual abundance of different types of transcripts; however, the enrichment in GO terms in the reproductive tissues and one of the larval libraries indicates that these libraries represent a broad diversity of transcripts, indicative of the high metabolic and proliferative characteristics of ovary and testis tissues. Larvae at the early mouth-opening stage of development are also undergoing tremendous metabolic changes as they transition from the yolk-sac to first-feeding stages. On the other hand, the library made from larvae midway to metamorphosis has very few GO terms associated with it, possibly because a large number of genes associated with the unusual metamorphic process in flatfish have not yet been described.
A number of ESTs were restricted to only a single tissue library and as such, may be good tissue-specific markers for in situ hybridisation and aid in tracking the appearance of different tissues during development [39,40]. For example, ESTs for a renal organic ion transporter and nephrosin are only found in the head kidney library. Several transporters (for amino acids and various solutes), binding proteins (for lipid, sterol and lipoproteins) as well as digestive enzymes (elastases, peptidase, aminopeptidase N, carboxypeptidase B, triglyceride lipase) are only found in the intestine library. Various complement components, apolipoproteins, fatty acid binding protein, alpha-2-macroglobulin and biliverdin reductase A are only present in the liver library. A single EST unique to spleen was identified – metaxin 2, similar to the von Willebrand clotting factor. Unique to the ovary library were a number of ESTs specific to reproduction – zona pellucida protein, vitelline envelope protein, chorion protein, choriolytic enzyme, aquaporin, alveolin, estrogen receptor binding protein and luteinizing hormone beta. Similarly, the testis library uniquely contained ESTs specific to reproduction – spindlin protein C, testis intracellular mediator protein, a cysteine and glycine-rich protein, and periostin. The gill library uniquely contained two ESTs involved in chloride transport and the skin uniquely contained keratin, epithelial membrane protein-3, epiplakin and dermatopontin.
The liver, head kidney and spleen libraries proved to be an excellent source of genetic information concerning hematopoiesis and immune function in this fish. The head kidney is the major site of hematopoiesis in fish and an EST survey of zebrafish kidney revealed many insights into this process in fish [41]. From our Atlantic halibut EST survey, many complement components, immune type receptors, lectins, defense proteins, MHC I and II components, cytokines, chemokines as well as signal transduction molecules and transcription factors involved in expression of immune genes were identified. It should be noted that ESTs for components of the immune system were also found in other tissue libraries, particularly those exposed to the environment such as skin and gill; these arose from circulating or resident immune cells in these tissues. This new sequence information will greatly enhance our understanding of the immune system of flatfish and provide molecular tools for further studying disease resistance.
The identification of microsatellite sequences in the Atlantic halibut ESTs will aid in the completion of a genetic linkage map of Atlantic halibut that is currently being constructed. Since these microsatellites are linked to genes, they are useful as Type I markers.
Conclusion
The addition of over 7700 ESTs, of which 5040 are functionally annotated, significantly enhances the genomic tools available for non-model fish species. Given the high degree of sequence similarity between flatfish species, the Atlantic halibut ESTs will be of great interest to the flatfish researchers in general, as well as the halibut aquaculture research community. The publicly accessible, searchable database also adds substantial value to the genomic data generated in this study. This EST survey has provided a number of microsatellite markers that have been placed on the Atlantic halibut genetic linkage map (Reith, pers. comm.) as well as probes for cellular localisation studies by in situ hybridisation. It has also laid the groundwork for the design and construction of a microarray for studying gene expression under different environmental conditions to better understand the impact of nutrition, stress, and environmental conditions on aquaculture production.
Methods
Fish rearing and sampling
Larvae were reared at Scotian Halibut Limited (Clarks Harbour, NS, Canada) in constant light (approximately 1000 lux at the surface) in 7 m3 tanks with flow-through salt water (32 ppt) maintained at 11 ± 0.2°C using a heat exchanger. Larvae were fed Artemia until weaning onto artificial feed at 65 DPH. The ages and sizes of the larvae at the different stages were as follows: hatching (1 dph; 10 mm), mouth-opening (21 dph;15 mm), midway to metamorphosis (64 dph; 20 mm), premetamorphosis (91 dph; 25 mm), and post-metamorphosis (104 dph; 30–35 mm).
Livers were sampled from one male (104 cm; 18 kg) and one female (130 cm; 31 kg) adult broodstock maintained at St. Andrews Biological Station, St. Andrews, NB, Canada. All other tissues were sampled from 3 male and 3 female immature fish (672–945 g) reared at the Institute for Marine Biosciences Marine Research Station (Sambro, NS, Canada). Immediately before sampling, fish were transferred to a bucket containing an overdose of TMS-Aqua MS-222 (Syndel, Vancouver, BC, Canada). Ovaries from 3 females were pooled, as were testes from 3 males. Gill, head kidney, intestine, skin, and spleen samples from each group of 6 fish were pooled, and all tissue samples preserved in RNALater (Ambion, Austin, TX, USA), and stored at -80°C until use. Larvae were pooled and preserved in RNALater, and stored at -80°C until use. All animal procedures were approved by the NRC Institute for Marine Biosciences Animal Care Committee.
cDNA library construction
For liver, mRNA was extracted from one female and one male halibut using the FastTrack kit (Invitrogen, Burlington, ON, Canada) and equal amounts of mRNA were combined. For spleen, total RNA was extracted from pooled tissues using Trizol Reagent (Invitrogen). For other tissues, mRNA was extracted from pooled tissues using the Micro-FastTrack kit (Invitrogen). For larval libraries, RNA was extracted from pooled samples (~20 larvae each for post-hatch and mouth-opening stages, 15 larvae for midway to metamorphosis, and 5 larvae each for pre- and post-metamorphosis) using Trizol Reagent. All RNA isolation kits were used according to the manufacturer's protocols.
First strand cDNA was prepared from 0.25–0.4 μg mRNA or 2 μg total RNA using the Creator SMART cDNA method (Clontech, Palo Alto, CA, USA) and PowerScript reverse transcriptase (Clontech). The CDS-3M adaptor, included in the TRIMMER-DIRECT kit (Evrogen, Moscow, Russia), was used instead of the SMART CDSIII primer. cDNA was amplified by LD-PCR according to the Creator SMART cDNA method (Clontech) using the 5' PCR primer as the forward and reverse primer. The optimal number of cycles to yield sufficient cDNA for normalisation, but remain within the exponential phase of amplification, was determined by analysing aliquots of the PCR reaction after every second cycle on agarose gels. In all cases, sufficient cDNA was obtained in 18 cycles or less, ensuring even the rarest messages were represented. Amplified cDNA was purified using the QIAquick PCR purification kit (Qiagen, Valencia, CA, USA), quantitated using a NanoDrop® ND-1000 spectrophotometer (NanoDrop® Technologies Inc, Wilmington, DE, USA) and normalized using the TRIMMER-DIRECT protocol (Evrogen). After digestion with SfiI, products smaller than 500 bp were removed using the Chroma Spin-400 column column as described in the Creator SMART protocol.
The resulting cDNAs were directionally cloned into the SfiI sites of pDNR-LIB (Clontech) and transformed into ElectroMAX DH10B T1 phage-resistant cells (Invitrogen) by electroporation using the Cell Porator and Voltage Booster system (Gibco BRL). The Cell Porator settings were 400 V, 330 μF capacitance, low Ω impedance and fast charge rate, and the Voltage Booster was set at 4 kΩ. For each library, 106 primary transformants were amplified by the semi-solid amplification method described in Stratagene's pBluescript XR cDNA library construction kit manual. Randomly picked clones (96 from each library) were screened for insert size by protoplasting [42] or by PCR using the M13 forward and reverse primers flanking the multiple cloning site of the vector.
Sequencing
Individual bacterial colonies were picked into 96- or 384-well plates containing LB/glycerol using the QPix colony picker (Genetix Ltd., New Milton, Hampshire, UK). A 96-well test plate was prepared from each library for sequencing and if the quality of the library was good, clones were sequenced from two additional 96-well and two 384-well plates, giving a total of 1056 reads. Two additional 384-well plates were sequenced from each of the ovary and testis libraries. Plates were incubated overnight at 37°C. The resulting bacterial suspensions were inoculated into lysis buffer and denatured at 95°C for 5 minutes. DNA from each clone was amplified using TempliPhi™ DNA polymerase (GE Healthcare, Baie d'Urfe, QC, Canada) according to manufacturer's instructions. DNA sequencing was performed using ET terminator chemistry (GE Healthcare) in the 5' direction (primer sequence GGCCGCATAACTTCGTATAGC). Reactions were processed using Sera-Mag™ magnetic carboxylate-modified microparticles (Seradyn™, Indianapolis, IN, USA) to remove excess fluorescent terminators before loading onto GE Healthcare MegaBACE 4000 capillary DNA sequencers. Clones from each library were replicated into glycerol stocks and stored at -80°C.
ESTs and annotation
ESTs were clustered using Paracel Transcript Assembler 3.0 (Paracel Inc., Pasadena, CA), which is based on the CAP4 clustering algorithm [43]. Annotation was performed using AutoFACT [44] and the default parameters with UniProt's UniRef90, NCBI's nr, KEGG, COG, PFAM, LSU, SSU and, for contigs, est_others. AutoFACT summary results are stored in our database [35]. Each sequence has one or more AutoFACT results associated with it. Each AutoFACT result is related to the most informative BLAST hit from each of the queried set of databases. Those hits are also stored in the Pleurogene database. GO annotations associated with either the contributing hits or the AutoFACT results are stored in a separate table.
Due to the low level of GO annotation obtained with AutoFACT (1640 sequences out of 7710), we chose to run the unannotated sequences through Goblet [45] using the vertebrate database and a BLAST cutoff of e-10. This increased the annotation level by 1736 sequences. Because the default criteria for a match in Goblet is lower than in AutoFACT and these sequences had already passed through AutoFACT, these GO annotations should be regarded as less reliable. GO terms were also identified for an additional 502 sequences by searching InterPro. Functionally annotated ESTs with GO annotations were classified using GOSlim and each category with more than 5 hits was plotted. Individual ESTs in each library (13,000 total) were also searched for GOSLIM terms and compiled by library.
Identification of microsatellite sequences
Short tandem repeats (2 – 5 bp) were detected using Tandem Repeats Finder [46].
Authors' contributions
SED and MER conceived of and designed the project. LCK constructed cDNA libraries. JK and MER carried out bioinformatic analyses. SED wrote the manuscript. MER and SED edited the manuscript. All authors read and approved the manuscript.
Acknowledgments
Acknowledgements
This project entitled: PLEUROGENE :Flatfish genomics – Enhancing commercial culture of Atlantic halibut and Senegal sole, was funded by the Genome Canada-Genome España joint program. We thank Debbie Martin-Robichaud (St. Andrews Biological Station) and Scotian Halibut Ltd., Clark's Harbour, Nova Scotia for tissue and larval samples of Atlantic halibut and Jeff Gallant and Harry Murray for storage and inventory of samples. Sequencing by The Atlantic Genome Centre, Halifax, Nova Scotia, a partnership between Genome Atlantic and the Canadian National Research Council Institute for Marine Biosciences, is gratefully acknowledged. This is NRC publication number 2007-42694.
Contributor Information
Susan E Douglas, Email: susan.douglas@nrc-cnrc.gc.ca.
Leah C Knickle, Email: Leah.Knickle@nrc-cnrc.gc.ca.
Jennifer Kimball, Email: Jennifer.Kimball@nrc-cnrc.gc.ca.
Michael E Reith, Email: Michael.Reith@nrc-cnrc.gc.ca.
References
- Worm B, Barbier EB, Beaumont N, Duffy JE, Folke C, Halpern BS, Jackson JBC, Lotze HK, Micheli F, Palumbi SR, Sala E, Selkoe KA, Stachowicz JJ, Watson R. Impacts of biodiversity loss on ocean ecosystem services. Science. 2006;314:787–790. doi: 10.1126/science.1132294. [DOI] [PubMed] [Google Scholar]
- Hendry CI, Martin-Robichaud DJ, Benfey TJ. Hormonal sex reversal of Atlantic halibut (Hippoglossus hippoglossus L.) Aquaculture. 2003;219:769–781. doi: 10.1016/S0044-8486(02)00344-7. [DOI] [Google Scholar]
- Gara B, Shields RJ, McEvoy L. Feeding strategies to achieve correct metamorphosis of Atlantic halibut, Hippoglossus hippoglossus L., using enriched Artemia. Aquaculture Research. 1998;29:935–948. doi: 10.1046/j.1365-2109.1998.29120935.x. [DOI] [Google Scholar]
- Hamre K, Opstad I, Espe M, Solbakken J, Hemre G-I, Pittman K. Nutrient composition and metamorphosis success of Atlantic halibut (Hippoglossus hippoglossus, L.) larvae fed natural zooplankton or Artemia. Aquaculture Nutrition. 2002;8:139–148. doi: 10.1046/j.1365-2095.2002.00201.x. [DOI] [Google Scholar]
- Okada N, Takagi Y, Seikai T, Tanaka M, Tagawa M. Asymmetrical development of bones and soft tissues during eye migration of metamorphosing Japanese flounder, Paralichthys olivaceus. Cell Tissue Research. 2001;304:59–66. doi: 10.1007/s004410100353. [DOI] [PubMed] [Google Scholar]
- Naess T, Lie O. A sensitive period during first feeding for the determination of pigmentation pattern in Atlantic halibut, Hippoglossus hippoglossus L., juveniles: the role of diet. Aquaculture Research. 1998;29:925–934. doi: 10.1046/j.1365-2109.1998.29120925.x. [DOI] [Google Scholar]
- Venizelos A, Benetti D. Pigment abnormalities in flatfish. Aquaculture. 1999;176:181–188. doi: 10.1016/S0044-8486(99)00060-5. [DOI] [Google Scholar]
- Saele O, Solbakken JS, Watanabe K, Hamre K, Pittman K. The effect of diet on ossification and eye migration in Atlantic halibut larvae (Hippoglossus hippoglossus L.) Aquaculture. 2003;220:683–696. doi: 10.1016/S0044-8486(02)00584-7. [DOI] [Google Scholar]
- Adams MD, Kelley JM, Gocayne JD, Dubnick M, Polymeropoulos MH, Xiao H, Merril CR, Wu A, Olde B, Moreno RF, et al. Complementary DNA sequencing: expressed sequence tags and human genome project. Science. 1991;252:1651–1656. doi: 10.1126/science.2047873. [DOI] [PubMed] [Google Scholar]
- Marra MA, Hillier L, Waterston RH. Expressed sequence tags – ESTablishing bridges between genomes. Trends in Genetics. 1998;14:4–7. doi: 10.1016/S0168-9525(97)01355-3. [DOI] [PubMed] [Google Scholar]
- Serapion J, Kucuktas H, Feng J, Liu Z. Bioinformatic mining of type I microsatellites from expressed sequence tags of channel catfish (Ictalurus punctatus) Marine Biotechnology. 2004;6:364–377. doi: 10.1007/s10126-003-0039-z. [DOI] [PubMed] [Google Scholar]
- Diatchenko L, Lau Y-FC, Campbell AP, Chenchik A, Moqadam F, Huang B, Lukyanov S, Lukyanov K, Gurskaya N, Sverdlov ED, Siebert PD. Suppression subtractive hybridization: A method for generating differentially regulated or tissue-specific cDNA probes and libraries. Proceedings of the National Academy of Science of the USA. 1996;93:6025–6030. doi: 10.1073/pnas.93.12.6025. [DOI] [PMC free article] [PubMed] [Google Scholar]
- Nam B-H, Yamamoto E, Hirono I, Aoki T. A survey of expressed genes in the leukocytes of Japanese flounder, Paralichthys olivaceus, infected with Hirame rhabdovirus. Developmental and Comparative Immunology. 2000;24:13–24. doi: 10.1016/S0145-305X(99)00058-0. [DOI] [PubMed] [Google Scholar]
- Kono T, Sakai M. The analysis of expressed genes in the kidney of Japanese flounder, Paralichthys olivaceus, injected with the immunostimulant peptidoglycan. Fish and Shellfish Immunology. 2001;11:357–366. doi: 10.1006/fsim.2000.0314. [DOI] [PubMed] [Google Scholar]
- Davey GC, Caplice NC, Martin SA, Powell R. A survey of genes in the Atlantic salmon (Salmo salar) as identified by expressed sequence tags. Gene. 2001;263:121–130. doi: 10.1016/S0378-1119(00)00587-4. [DOI] [PubMed] [Google Scholar]
- Aoki T, Hirono I, Kim M-G, Katagiri T, Tokuda Y, Toyohara H, Yamamota E. Identification of viral induced genes in Ig+ leucocytes of Japanese flounder Paralichthys olivaceus, by differential hybridisation with subtracted and un-subtracted cDNA probes. Fish and Shellfish Immunology. 2000;10:623–630. doi: 10.1006/fsim.2000.0279. [DOI] [PubMed] [Google Scholar]
- Aoki T, Nam B-H, Hirono I, Yamamota E. Sequences of 596 cDNA clones (565,977 bp) of Japanese flounder (Paralichthys olivaceus) leukocytes infected with Hirame rhabdovirus. Marine Biotechnology. 1999;1:477–488. doi: 10.1007/PL00011804. [DOI] [PubMed] [Google Scholar]
- Bayne CJ, Gerwick L, Fujiki K, Nakao M, Yano T. Immune-relevant (including acute phase) genes identified in the livers of rainbow trout, Oncorhynchus mykiss, by means of suppression subtractive hybridization. Developmental and Comparative Immunology. 2001;25:205–217. doi: 10.1016/S0145-305X(00)00057-4. [DOI] [PubMed] [Google Scholar]
- Douglas SE, Belanger JC, Tsoi SCM, Williams J, Ewart KV. Sixth International Marine Biotechnology Conference – Aquatic Genomics Symposium; Sept 20–27, 2003. Tokyo, Japan. Marine Biotechnology; 2003. Identification of differentially expressed genes involved in Atlantic salmon (Salmo salar) host-pathogen interaction using microarray technology; pp. S335–339. [Google Scholar]
- Gerwick L, Steinhauer R, LaPatra SE, Sandell T, Ortuno J, Hajiseyedjavadi N, Bayne CJ. The acute phase response of rainbow trout (Oncorhynchus mykiss) plasma proteins to viral, bacterial and fungal inflammatory agents. Fish and Shellfish Immunology. 2002;12:229–242. doi: 10.1006/fsim.2001.0367. [DOI] [PubMed] [Google Scholar]
- Kocabas AM, Li P, Cao D, Karsi A, He C, Patterson A, Ju Z, Dunham RA, Liu Z. Expression profile of the channel catfish spleen: analysis of genes involved in immune functions. Marine Biotechnology. 2002;4:526–536. doi: 10.1007/s10126-002-0067-0. [DOI] [PubMed] [Google Scholar]
- Kono T, Sakai M, LaPatra SE. Expressed sequence tag analysis of kidney and gill tissues from rainbow trout (Oncorhynchus mykiss) infected with Infectious Hematopoietic Necrosis virus. Marine Biotechnology. 2000;2:493–498. doi: 10.1007/s101260000032. [DOI] [PubMed] [Google Scholar]
- Martin SA, Blaney SC, Houlihan DF, Secombes CJ. Transcriptome response following administration of a live bacterial vaccine in Atlantic salmon (Salmo salar) Molecular Immunology. 2006;43:1900–1911. doi: 10.1016/j.molimm.2005.10.007. [DOI] [PubMed] [Google Scholar]
- Savan R, Sakai M. Analysis of expressed sequence tags (EST) obtained from common carp, Cyprinus carpio L., head kidney cells after stimulation by two mitogens, lipopolysaccharide and concanavalin-A. Comparative Biochemistry and Physiology Part B. 2002;131:71–82. doi: 10.1016/S1096-4959(01)00488-2. [DOI] [PubMed] [Google Scholar]
- Suzuki T, Shin IT, Kohara Y, Kasahara M. Transcriptome analysis of hagfish leukocytes: a framework for understanding the immune system of jawless fishes. Developmental and Comparative Immunology. 2004;28:993–1003. doi: 10.1016/j.dci.2004.04.005. [DOI] [PubMed] [Google Scholar]
- Tsoi SC, Ewart KV, Penny S, Melville K, Liebscher RS, Brown LL, Douglas SE. Identification of immune-relevant genes from Atlantic salmon using suppression subtractive hybridization. Marine Biotechnology. 2004;6:199–214. doi: 10.1007/s10126-002-0101-2. [DOI] [PubMed] [Google Scholar]
- Chini V, Rimoldi S, Terova G, Saroglia M, Rossi F, Bernardini G, Gornati R. EST-based identification of genes expressed in the liver of adult seabass (Dicentrarchus labrax, L.) Gene. 2006;376:102–106. doi: 10.1016/j.gene.2006.02.010. [DOI] [PubMed] [Google Scholar]
- Park KC, Osborne JA, Tsoi SC, Brown LL, Johnson SC. Expressed sequence tags analysis of Atlantic halibut (Hippoglossus hippoglossus) liver, kidney and spleen tissues following vaccination against Vibrio anguillarum and Aeromonas salmonicida. Fish and Shellfish Immunology. 2005;18:393–415. doi: 10.1016/j.fsi.2004.10.003. [DOI] [PubMed] [Google Scholar]
- Fernandes JM, Mackenzie MG, Elgar G, Suzuki Y, Watabe S, Kinghorn JR, Johnston IA. A genomic approach to reveal novel genes associated with myotube formation in the model teleost, Takifugu rubripes. Physiological Genomics. 2005;22:327–338. doi: 10.1152/physiolgenomics.00087.2005. [DOI] [PubMed] [Google Scholar]
- Ju Z, Karsi A, Kocobas A, Patterson A, Li P, Cao D, Dunham R, Liu Z. Transcriptome analysis of channel catfish (Ictalurus punctatus): genes and expression profile from the brain. Gene. 2000;261:373–382. doi: 10.1016/S0378-1119(00)00491-1. [DOI] [PubMed] [Google Scholar]
- Karsi A, Li P, Dunham R, Liu ZJ. Transcriptional activities in the pituitaries of channel catfish before and after induced ovulation by injection of carp pituitary extract as revealed by expressed sequence tag analysis. Journal of Molecular Endocrinology. 1998;21:121–129. doi: 10.1677/jme.0.0210121. [DOI] [PubMed] [Google Scholar]
- Zhou L, Yao B, Xia W, Li CJ, Wang Y, Shi YH, Gui JF. EST-based identification of genes expressed in the hypothalamus of male orange-spotted grouper (Epinephelus coioides) Aquaculture. 256:129–139. doi: 10.1016/j.aquaculture.2006.01.022. [DOI] [Google Scholar]
- Magalhaes GS, Junqueira-de-Azevedo IL, Lopes-Ferreira M, Lorenzini DM, Ho PL, Moura-da-Silva AM. Transcriptome analysis of expressed sequence tags from the venom glands of the fish Thalassophryne nattereri. Biochimie. 2006;88:693–699. doi: 10.1016/j.biochi.2005.12.008. [DOI] [PubMed] [Google Scholar]
- Gene Ontology http://www.geneontology.org/
- Pleurogene http://www.pleurogene.ca
- Clusters of Orthologous Genes http://www.ncbi.nlm.nih.gov/COG/
- Kyoto Encyclopedia of Genes and Genomes http://www.genome.jp/kegg/
- Galloway TF, Bardal T, Kvam SN, Dahle SW, Nesse G, Randol M, Kjorsvik E, Andersen O. Somite formation and expression of MyoD, myogenin and myosin in Atlantic halibut (Hippoglossus hippoglossus L.) embryos incubated at different temperatures: transient asymmetric expression of MyoD. Journal of Experimental Biology. 2006;209:2432–2441. doi: 10.1242/jeb.02269. [DOI] [PubMed] [Google Scholar]
- Murray HM, Perez-Casanova JC, Gallant JW, Johnson SC, Douglas SE. Trypsinogen expression during the development of the exocrine pancreas in winter flounder (Pleuronectes americanus) Comparative Biochemistry and Physiology Part A. 2004;138:53–59. doi: 10.1016/j.cbpb.2004.02.020. [DOI] [PubMed] [Google Scholar]
- Murray HM, Gallant JW, Johnson SC, Douglas SE. Cloning and expression analysis of three digestive enzymes from Atlantic halibut during early development: predicting gastrointestinal functionality. Aquaculture. 2006;252:394–408. doi: 10.1016/j.aquaculture.2005.03.030. [DOI] [Google Scholar]
- Song HD, Sun XJ, Deng M, Zhang GW, Zhou Y, Wu XY, Sheng Y, Chen Y, Ruan Z, Jiang CL, Fan HY, Zon LI, Kanki JP, Liu TX, Look AT, Chen Z. Hematopoietic gene expression profile in zebrafish kidney marrow. Proceedings of the National Academy of Science of the USA. 2004;101:16240–16245. doi: 10.1073/pnas.0407241101. [DOI] [PMC free article] [PubMed] [Google Scholar]
- Sekar V. A rapid screening procedure for the identification of recombinant bacterial clones. BioTechniques. pp. 11–13.
- Huang X, Madan A. CAP3: A DNA Sequence Assembly Program. Genome Res. 1999;9:868–877. doi: 10.1101/gr.9.9.868. [DOI] [PMC free article] [PubMed] [Google Scholar]
- Koski LB, Gray MW, Lang BF, Burger G. AutoFACT: An Automatic Functional Annotation and Classification Tool. BMC Bioinformatics. 2005;6:151–161. doi: 10.1186/1471-2105-6-151. [DOI] [PMC free article] [PubMed] [Google Scholar]
- Groth D, Lehrach H, Hennig S. GOblet: a platform for Gene Ontology annotation of anonymous sequence data. Nucleic Acids Research. 2004;32:W313–317. doi: 10.1093/nar/gkh406. [DOI] [PMC free article] [PubMed] [Google Scholar]
- Benson G. Tandem repeats finder: a program to analyze DNA sequences. Nucleic Acids Research. 1999;27:573–580. doi: 10.1093/nar/27.2.573. [DOI] [PMC free article] [PubMed] [Google Scholar]