Abstract
The ability to use conformational flexibility is a hallmark of enzyme function. Here we show that protein motions and catalytic activity in a RNase are coupled and display identical solvent isotope effects. Solution NMR relaxation experiments identify a cluster of residues, some distant from the active site, that are integral to this motion. These studies implicate a single residue, histidine-48, as the key modulator in coupling protein motion with enzyme function. Mutation of H48 to alanine results in loss of protein motion in the isotope-sensitive region of the enzyme. In addition, kcat decreases for this mutant and the kinetic solvent isotope effect on kcat, which was 2.0 in WT, is near unity in H48A. Despite being located 18 Å from the enzyme active site, H48 is essential in coordinating the motions involved in the rate-limiting enzymatic step. These studies have identified, of ≈160 potential exchangeable protons, a single site that is integral in the rate-limiting step in RNase A enzyme function.
Keywords: Carr–Purcell–Meiboom–Gill dispersion, enzyme dynamics, NMR, protein motions, RNase A
Conformational motions in enzymes play an essential role in their function and are often the rate-limiting step to overall catalytic throughput (1–5). Many enzymes have sufficiently evolved such that the bond-making and -breaking steps are fast relative to the ability of the enzyme to undergo a conformational change, and, thus, steps other than the chemical transformation of substrate are rate-limiting (ref. 6 and references therein). In systems such as these, understanding enzyme function requires characterization of the relevant time-dependent protein fluctuations from the time-averaged three-dimensional structure. The ability of solution NMR spectroscopy to detect, with atomic resolution, motions over a wide timescale (picoseconds to seconds) makes it an ideal experimental technique to characterize conformational motions in proteins that can ultimately impact drug design, de novo enzyme construction, and enzyme engineering. In particular, relaxation-compensated Carr–Purcell–Meiboom–Gill (rcCPMG) dispersion experiments (7) are capable of informing on the kinetics, thermodynamics, and structural changes of protein motions in the microsecond-to-millisecond timescale.
RNase A is an enzyme example in which a conformational change is the bottleneck to overall conversion of substrate to product (see ref. 3 for a review). RNase A catalyzes the cleavage of single-stranded RNA and does not require metal ions or cofactors. This enzyme has been studied in great detail as a model for protein folding, structure, and stability (8, 9). In addition, homologs of RNase A have important cytotoxic and antitumor properties (10). The rate-limiting step for the RNase A reaction is a protein conformational change that is coupled to the product release step (1, 11). This conformational change involves multiple amino acid residues throughout the protein, including those distant from the active site (12–14). These mobile regions include two loops: loop 1, which is located 20 Å from the active site, and loop 4, which imparts specificity of RNase A for purine residues that are 5′ to the phosphoester cleavage site. Both loops move 2–3 Å between the liganded and unliganded forms (15–17), with an overall conformational change that results in compacting of the protein structure in the ligand-bound (closed) form (18). Detailed structural and NMR dynamics studies have demonstrated that this essential motion is concerted and that it occurs in the presence and absence of bound substrate (12, 16, 19). These motions allow RNase A to interconvert between an open form that is capable of binding substrate and a closed conformation from which catalysis occurs. Binding of substrate does not change the rate or mechanism of this motion but simply shifts the preexisting conformational equilibrium to favor the closed conformation (16). Thus, evolution has endowed RNase A and other enzymes (20–23) with the necessary flexibility, biased in such a manner, to sample the catalytically important conformations. The open and closed conformations have been structurally characterized from NMR and crystallography experiments, whereas the kinetics of interconversion and the equilibrium populations of the two conformations have been determined by dynamic NMR experiments. These studies have demonstrated that motion in RNase A is important for its enzymatic function. However, the mechanism of this rate-limiting motion in RNase A and other enzymes has not previously been addressed in detail.
Obviously, this conformational change does not involve changes in covalent bonding but rather entails alteration in sidechain and backbone bond angles and changes in hydrogen bonds. The involvement of hydrogen bonds in these conformational changes can be exploited to examine mechanistic aspects of this motion. If one or more of these H bonds are created or broken in the rate-limiting step for protein motion, then replacement with deuterium should slow down the rate of protein motion, i.e., show a kinetic solvent isotope effect (KSIE) (24), which can be detected by NMR relaxation experiments. Recently, conformational motion in RNase A was shown to exhibit a KSIE, indicating a sensitivity of the rate-limiting conformational change to motion of a solvent-exchangeable proton(s) (25). Here, these effects are investigated in more detail and combined with biochemical experiments. Together, these experiments uncover coupled motion of multiple amino acid residues that directly impact catalytic turnover. Importantly, an amino acid residue distant from the enzyme active site is identified that is involved in the rate-limiting conformational change and, therefore, in the catalytic process.
Results and Discussion
Millisecond Motions by NMR.
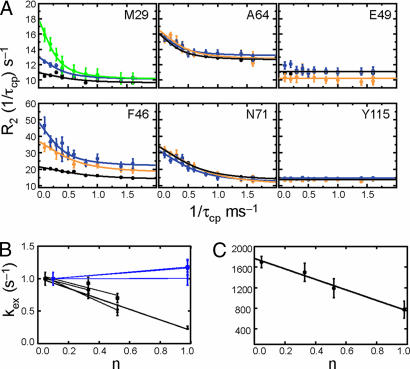
Motions (microsecond to millisecond) in proteins are effectively characterized by NMR CPMG dispersion experiments that monitor the transverse relaxation rate (R2) of single quantum coherence as a function of the timing (τcp) between refocusing pulses during the NMR relaxation period (see Materials and Methods). Many amino acids in RNase A experience millisecond motions and a subset (S15, S16, T17, N44, F46, A64, K66, N71, D83, T100, Q101, H105, I106, V108, and H119) is amenable to quantitative investigation. CPMG dispersion curves for several of these flexible residues and residues, such as Y115, which serve as a motionless control are shown in Fig. 1A. These flexible residues all experience a two-site motional process,
 |
with a similar exchange rate constant, kex (= kA + kB) ∼ 1,700 s−1, and similar fractional A/B populations 0.95:0.05, suggesting a global, concerted motion. Furthermore, the rate for this conformational motion (kex) is the same as the catalytic turnover rate constant (kcat) and the product release rate constant (koff), and, additionally, the activation barrier for motion is similar to the activation barrier for the product release step (4–5 kcal/mol) (26). Moreover, analysis of the magnitude and sign of the dynamic chemical shift difference (± Δω) (27), reveals that loop 1 in particular moves between the same two conformations in the presence or absence of substrate (16). These data indicate that the conformational change in RNase A is ligand-stabilized, because the effect of ligand is to selectively bind a particular conformation resulting in a population shift, which favors the closed conformation. The closed, active conformation is the dominant one when substrate is bound (16). Cumulatively, these data indicate that a conformational change that involves many amino acid residues is closely coupled to the function of RNase A. However, the details of this motion and its role in catalytic function remain unknown. Below, we use NMR relaxation dispersion measurements, biochemical experiments, and mutagenesis to characterize these conformational motions in RNase A.
Fig. 1.
Conformational motions in WT RNase A. (A) 15N and 13Cε rcCPMG relaxation dispersion data at 14.1 T for 5% (black), 33% (orange), 52% (blue), and 100% (green) 2H2O. Fitted lines to data points are from single field fits. (B) The dependence of kex on the fraction of 2H2O is shown. Blue, indicates residues for which kex does not depend on the atom fraction of 2H2O, whereas residues that show a decrease in kex are shown in black for S16 (circles), S22 (squares), F46 (diamonds), M29 (triangles), M30 (inverted triangles), A109 (open circles), A64 (open squares), and A20 (open diamonds). (C) Proton inventory data showing the dependence of kex on the 2H2O atom fraction from a global analysis of the isotope effect data.
Solvent Isotope Effects on Protein Motions.
As noted, the involvement of hydrogen bonds in this conformational change can be probed by measuring the KSIE on kex by NMR dispersion experiments. Furthermore, one could expect similar isotope effects on kcat and kex if protein motion and catalytic turnover are coupled processes. As expected, increasing the atom fraction (n) of 2H2O in the RNase A sample resulted in a decrease in the rate constant for protein motion as observed by a drop in the kex value for some but not all of these flexible residues [Fig. 1 A and B and supporting information (SI) Table 1]. Several atomic positions, including the backbone amides of S16, T17, A19, S22, N44, F46, and T100, and the Cε positions for M29 and M30, all show a similar decrease in kex with increasing atom fraction of 2H2O (Fig. 1 A and B). The KSIE determined from these experiments is of a similar magnitude for all affected residues (Fig. 1B). The observation that multiple residues exhibit the same rate reduction in heavy water indicates that these residues all participate in the same motional process. Therefore, these relaxation dispersion data were analyzed globally as described in ref. 16, and the kex dependence on n is shown in Fig. 1C. Fig. 1C shows a clear, decreasing linear dependence of kex on 2H2O with a global KSIE = 2.2 ± 0.3. In obvious contrast, some atoms, such as the Cβ position of A19, A20, A64, and A109, exhibit the same exchange rate constant at 10% and 100% 2H2O (Fig. 1B). These Cβ positions are primarily solvent-exposed, and their motions are not coupled to the motion exhibited by the other amino acids in the protein that are sensitive to the solvent deuterium content. In addition, flexible residues, such as A64 and N71, show similar exchange rate constants in low and high amounts of 2H2O, whereas E49 and Y115 show no evidence of motion regardless of solvent. As a control, to account for any solvent viscosity effects of 2H2O solutions relative to H2O, dispersion curves were measured in the presence and absence of sucrose, to mimic this viscosity increase (SI Fig. 7). These control experiments show no effect of viscosity on kex, indicating that the isotope effect on motion in RNase A is due to a hydrogen bond and not due to a macroscopic effect.
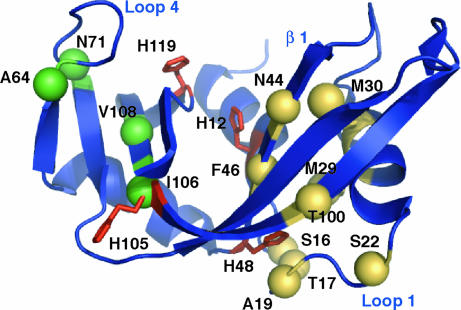
The atomic resolution of NMR facilitates a structural identification of solvent-sensitive residues. Strikingly, as shown in Fig. 2, residues that experience the same KSIE localize in a single region of RNase A, whereas those flexible residues in which kex is independent of solvent deuterium cluster in a different area. This observation indicates that there are two distinct motional processes, one that is sensitive to solvent deuterium and one that is not. Further analysis of the isotopic dependence of kex using the Gross–Butler treatment (28) (see Materials and Methods) showed a linear variation with n, indicating the involvement of a single proton in the transition state for this rate-determining motion with a transition state fractionation factor of 0.42 ± 0.04 (Fig. 1C). To compare the KSIE for this conformational exchange motion with that for kcat, the enzyme-catalyzed cleavage of the dinucleotide substrate uridylyl(3′-5′)adenosine was measured in H2O and 2H2O.
Fig. 2.
Location of flexible residues. Residues involved in chemical exchange are shown as spheres with the amino acid residue number indicated. Gold spheres indicate residues in which a normal 2H solvent isotope effect of 2 is observed. Spheres colored green are atoms that are flexible and do not exhibit a solvent isotope effect. The four histidine residues are depicted as red sticks. Select secondary structure elements are indicated.
Solvent Isotope Effects on Catalytic Rate.
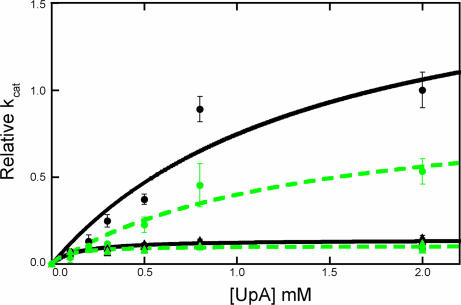
Previous experiments showed a KSIE on the RNase-A-catalyzed reaction (1). Here, we measured the isotope effect on kcat and dynamics under identical solution conditions and found it to be equivalent (kcatH/kcat2H = 2.0 ± 0.4) (Fig. 3, circles) to the KSIE on protein motions. These studies demonstrate that the rate-determining enzymatic step and the conformational change in RNase A are likely occurring in as part of the same reaction step. The pH dependence of the NMR chemical shift changes (12, 29) and the pH dependence of this conformational exchange process (data not shown) suggested the involvement of a histidine sidechain in this rate-limiting motion. RNase A has four histidine residues, two conserved at the active site (H12 and H119), one conserved but 18 Å from the active site and located in the vicinity of flexible loop 1 (H48) (Fig. 2), and one that is solvent-exposed (H105). H12 does not show evidence of motion in CPMG dispersion experiments (data not shown), and H105 is not involved in extensive interactions with the enzyme; thus, both are unlikely candidates. NMR resonances for H119 and H48 are both exchange-broadened, indicating the presence of millisecond motions. The role of these two histidine residues in the conformational exchange process in RNase A was explored further. H119 makes an important H bond with the γ-carboxyl of D121, which serves to connect H119 to loop 4 and the main body of the protein (19, 30). H119 is not located in a region of the enzyme involved in the isotope-sensitive motion. Nonetheless, for completeness, this interaction was tested for its potential role in RNase A motion by mutation of D121 to alanine. In this mutant, the kex value is similar to that for WT RNase A, and the KSIE on the protein motions is identical to that of WT (SI Figs. 8 and 9). Thus, because removal of the H bond to H119 by mutation of D121 results in no discernable difference in the KSIE from WT enzyme, we conclude that the H119–D121 interaction is not involved in the rate-limiting protein motion.
Fig. 3.
Solvent isotope effect on enzyme kinetics. Measured kcat in H2O (black) and 2H2O (green) for WT (circles) and H48A (triangles) RNase A.
H48 Modulates Motion and Enzyme Function.
H48 is located in the center of the isotope-sensitive residue cluster (Fig. 2). Biochemical studies previously suggested its involvement in a conformational change in RNase A (29, 31). H48 is located on β-strand 1, and its sidechain points into the region occupied by the flexible loop 1. Loop 1 shows distinct ligand-dependent conformations (16, 19) that are likely the result of active site changes that are propagated between β-1 through H48 to this loop. If the observed motions in RNase A are modulated by the sidechain of H48 and integral to catalytic throughput, then mutation of this residue should result in alteration of kcat and in the NMR-detected conformational exchange process. To test this possibility, H48 was mutated to alanine and the biochemical and NMR data revealed a notable effect on the KSIE, enzyme activity, and protein dynamics. Despite the significant distance (18 Å) of H48 from the active site, kcat decreases by >10-fold in this mutant (Fig. 3), indicating a change in the rate-determining conformational motion. The KSIE on kcat for H48A was measured and is nearly completely lost as a result of this mutation, decreasing from a value of kcatH/kcat2H = 2.0 ± 0.4 in WT to 1.3 ± 0.2 in H48A (Fig. 3). These kinetic studies indicate that H48 plays an essential role in the rate-limiting step for the overall conversion of substrate to product, which involves a conformational change that facilitates product release.
It is unlikely that H48 plays a direct role in the enzyme chemistry of RNase A. First, it is too distant from the active site to play a primary role in RNA cleavage. Second, NMR chemical shifts, which are very sensitive to their local environment, change little for active site residues between H48A and WT. Overall, outside of residues close to the site of mutation, there are very minor chemical shift changes between H48A and WT. The 10% trimmed protein-wide average chemical shift change (Δ) between WT and H48A is 0.03 ± 0.03 (SI Fig. 10). The measured values of Δ for three essential catalytic residues (H119, K41, and H12) are within this range (0.02, 0.01, and 0.06, respectively), indicating insignificant differences from WT enzyme, which imply WT-like pKa values for these residues. These data suggest that the essential aspects of chemistry at the active site are not altered by this mutation. In addition, consistent with this suggestion is the observation that H48A remains a very good catalyst (kcatH48A > 1010 × kuncat), indicating an intact functioning active site. Therefore, the decrease in activity is likely due to disruption of some other aspect of RNase A function.
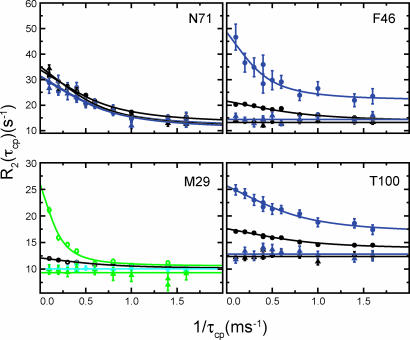
Interestingly, native protein motions also are altered by this mutation. First, mutation results in quenching of the dynamics in the isotope-sensitive region. The loss of motion is clearly seen for residues F46, M29, and T100, for which the flat dispersion curves indicate a lack of detectable motion in the H48A mutant (Fig. 4). Second, this mutation has no effect on the dispersion profiles for amino acids in the non-isotope-sensitive parts of the protein, as observed by the identical dispersion curves in WT and H48A enzymes for residues such as N71 (Fig. 4). This finding further indicates that motions in these separate areas of RNase A are distinct and, given the proximity of N71 to the active site (Fig. 2), suggests that the loop 4 region of the protein is behaving in a WT-like fashion. These studies provide clear evidence that H48 is a modulator of the rate-limiting motion in RNase A.
Fig. 4.
Solvent isotope and mutation effects. 15N and 13Cε rcCPMG relaxation for 5% (black), 10% (aqua), 52% (blue), and 100% (green) 2H2O. WT data are indicated by circles, and triangles are used to indicate H48A data. NMR CPMG dispersion data were collected at 18.8 T (open symbols) and 14.1 T (closed symbols) at 298 K.
To further address the differences in motional behavior between WT and H48A enzymes, we measured the differential multiple quantum relaxation rates (Rmq) (32). Differential multiple quantum relaxation depends on changes in both the 1H and 15N chemical shifts that result from protein motion. Because 1H chemical shifts are very sensitive to the local environment, these experiments are a good complement for the 15N single quantum experiments presented previously. These results for Rmq parallel those observed for 15N single quantum dispersion experiments. In loop 4 (the isotope-insensitive region) the differences between Rmq for WT and H48A are insignificant. In WT (H48A) enzyme, Rmq values for A64, C65, N67, and N71 are 11.3 ± 0.2 (11.6 ± 0.6), 20.3 ± 0.4 (21.5 ± 1.1), −5.2 ± 0.4 (−9.6 ± 1.0), and 39.9 ± 0.7 (49.4 ± 2.0) s−1, respectively. Whereas the isotope-sensitive loop 1 residues S15 and T17 have Rmq values of 56.1 ± 1.5 and −136.4 ± 6.6 s−1 for WT, and in H48A these values are not above background values (≈3–4 s−1) that are typical of nonexchanging residues. Because Rmq depends on the exchange effects for 1H and 15N, these experiments corroborate the 15N single quantum measurements, which indicate a lack of observable motion in loop 1 and surrounding regions for H48A.
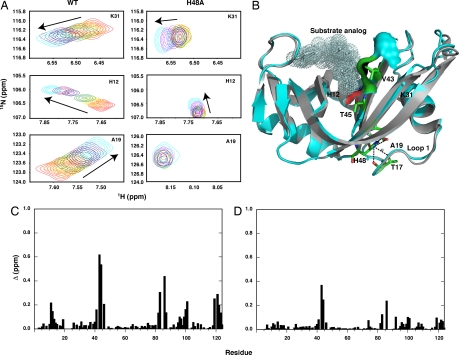
In WT as noted, the conformational change is part of the product release step. All of the H48A data imply that protein motion and function are no longer tightly coupled in this mutant and predict that the conformational change that accompanies ligand binding either does not take place or does not occur to the extent that it does in WT. To test this hypothesis, we measured the effects of binding of the product analog cytidine monophosphate (3′-CMP) to H48A and WT by NMR titration and subsequently by isothermal titration calorimetry (SI Materials and Methods). Fig. 5A shows peaks from a 1H–15N heteronuclear single quantum coherence spectrum for H12, A19, and K31 for WT and H48A. These data for H48A show that this mutant has a diminished or, in some cases such as residues in loop 1 (A19), negligible response to ligand binding. The location of these residues is depicted on the RNase A structure in Fig. 5B. The global effects of 3′-CMP binding are depicted in Fig. 5 C and D for WT and H48A, respectively. Thus, in the absence of the H48–T17 hydrogen bond, the necessary conformational changes do not take place in RNase A to the same extent that they do in WT. In addition, CPMG relaxation experiments on the RNase A/3′-CMP complex (SI Fig. 11) identical to those performed on apoH48A also show no evidence for protein motions. Thus, these motions appear to be absent in the apo and ligand-bound form of H48A, in contrast to WT enzyme (19). Based on chemical shifts for the mutant enzyme, we suggest that this stems from an increase in the population of the open conformation. Isothermal titration calorimetry binding data (not shown) indicate the WT enzyme interacts with ligand more tightly than H48A, again suggesting that the productive ligand-bound conformation is not as accessible to H48A as it is to the native enzyme.
Fig. 5.
Mutational effects on RNase A. (A) 3′-CMP titration for K31, H12, and A19 in WT and H48A for [CMP]/[RNase A] ratios of 0.0 (red) 0.2 (orange), 0.4 (yellow), 0.7 (green), 1.3 (blue), 2.7 (purple), 6.0 (magenta), and 12 (cyan). Arrows indicate the direction of resonance shift with increasing [CMP]. Residues in A are indicated on the RNase A structure in B. (B) Overlay of apo (gray) and substrate-bound (cyan) RNase A. The substrate analog, phosphothymidine pyrophosphoryl adenosine phosphate (16), is shown as a dotted surface representation. Residues V43 and T45 located on loop β-1 are shown in stick representation along with the corresponding surface contact made with substrate. Hydrogen bonds between H48 and loops 1 and β-1 are shown as black dashed lines. Crystallographically identified water molecules in the vicinity of H48 are shown as small spheres. (C and D) Chemical shift differences, Δ for 3′-CMP binding to WT (C) and H48A (D) RNase A (Δ is defined in SI Materials and Methods).
A potential mechanism for this motion in the function of RNase A comes from comparison of the apo and ligand-bound structures of RNase A, which shows conformational differences for loops 1 and 4 and β-1 (Figs. 1 and 5). The closed (bound) conformation is the conformation that ultimately leads to the production of cleaved RNA. Therefore disruption in the ability of the enzyme to access this conformation will have detrimental effects on kcat. In the enzyme–substrate conformation, β-1 moves closer to and makes direct contact with substrate, as shown by the interaction of V43 and T45 with bound ligand (Fig. 5B). T45 imparts specificity of RNase A for pyrimidine residues (33) and is in proximity with H48. The studies described here suggest that hydrogen bonds formed by the imidazole ring of H48 play a crucial role in coupling the interconversion between the open and closed conformations by connecting motions in loop 1 with β-1. Mutation of H48 removes this interaction and likely results in skewing of the enzyme population to favor the open conformation, consistent with the observed chemical shifts. A higher percentage of open conformer would result in the loss of amplitude in the dispersion curves, as was observed in these studies.
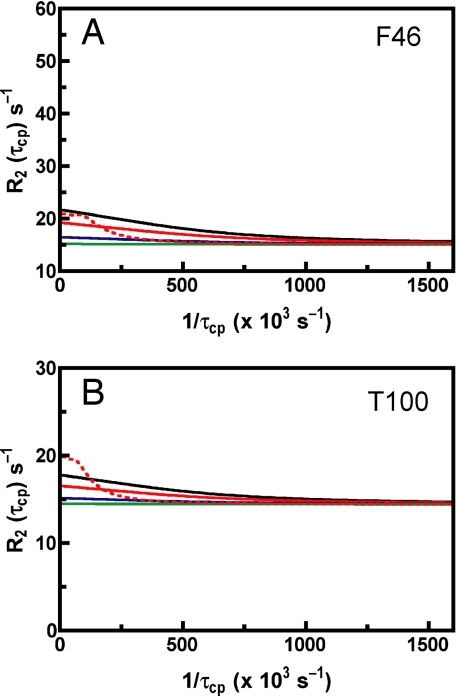
To assess the extent to which a shift in populations would render the dispersion curves flat, we simulated these curves under various conformational exchange conditions with the open conformation being progressively more populated (Fig. 6). These simulated data indicate that, for the experimentally observed exchange parameters in RNase A, once the population of the major conformer is >98% (blue and green curves) the dispersion curves would be essentially flat, just as we observe experimentally. This finding supports the interpretation of the role of H48 in allowing access to the closed conformation. It is likely that protonation/deprotonation of this residue acts as a switch to facilitate the open-to-closed transformation. These simulations also suggest that it is unlikely that mutation of H48 results in slowing of the protein motion such that koff would remain rate-limiting (i.e., kcat = kex = koff). In H48A, kcat = 130 s−1, and Fig. 6 shows that a kex = 130 s−1 (red dashed curve) would clearly lead to detectable dispersion curves in our NMR experiments. We suggest that motion of H48 in WT is propagated between loop 1, β-1, and the active site; in H48A there can be no such linkage.
Fig. 6.
Experimental and simulated CPMG dispersion curves. Curves are shown for F46 (A) and T100 (B) at 14.1 T. The solid black curves represent the WT, experimental curves, with exchange parameters Δω, kex, pA, and R20 equal to 510 s−1, 1,657 s−1, 0.95, and 15.1 s−1, respectively, for F46 and 356 s−1, 1,657 s−1, 0.95, and 14.4 s−1, respectively, for T100. The solid red, blue, and green curves were simulated by using Eq. 1 and the experimentally determined WT exchange parameters, except pA = 0.97, 0.99, and 0.999, respectively. The dashed red curve was generated by using Eq. 1 and the experimentally determined WT exchange parameters, with kex = 130 s−1.
A shift in population away from the active, enzyme–substrate conformation by 3% due to mutation as suggested by the simulated dispersion curves also is consistent with the drop in kcat from 1,700– 130 s−1 in H48A. Assuming that the loss in activity is due to a shift from the active, closed conformer to the more open form, a 13-fold decrease in kcat corresponds to a ΔG ≈ 1.5 kcal/mol, which is similar to the free energy change resulting from a 3% change in open-to-closed equilibrium. It is clear that in WT, kex, kcat, and koff are all part of the same process, and the role of H48 is to provide a link between regions of the protein, which optimize the open/closed ratio.
Conclusions
These experiments point to an undeniable role for H48 in modulating and coordinating the catalytically productive motions in WT enzyme. H48 is conserved in pancreatic RNases, in which the catalytic activity of these enzymes is important, and it is not conserved in RNases such as eosinophil cationic protein, in which RNase activity is not reported to be essential for function (34). Modulation of catalysis by residues distant from the active site has been demonstrated previously (35–37) and illustrates the structural and dynamical complexity encoded into enzymes. These studies have implicated a disruption of coupled motions that have a detrimental impact on enzyme function. The data presented here point to a clear connection between enzyme motions and the rate-limiting conversion of substrate to product in RNase A and further identify a role for millisecond dynamics in enzyme function.
Materials and Methods
NMR Dynamics Studies.
rcCPMG experiments were performed to measure spin relaxation rates of 15N of amide groups (7) on 15N-labeled protein, 13Cε nuclei of methionine side chains, and 13Cβ positions in alanine residues (38) using either 15N-labeled, 15N–13C-labeled, and alanine-specific-labeled WT or mutant RNase A. All rcCPMG experiments were acquired in a single interleaved pseudofour-dimensional experiment. Relaxation rate dispersion analysis was performed as previously described (16). To quantitate the contribution of microsecond-to-millisecond chemical exchange motion, R2(1/τcp) was measured by using the rcCPMG experiment performed as a function of interpulse delay, τcp (7). At all chemical exchange time scales, the value of R2(1/τcp) is related to the microscopic exchange parameters by (39–41):
 |
 |
and
in which pA and pB are the equilibrium populations of the two sites, Δω is the difference in chemical shifts between the two sites, and R2A0 and R2B0 are the intrinsic transverse relaxation rates of the two sites in the absence of chemical exchange, and kex is the microscopic exchange rate constant of the motional process. The exchange rate constant kex for nuclei in equilibrium between two magnetically inequivalent sites (A↔B) is the sum of the rate constants for the forward and reverse processes. In cases in which exchange is fast (kex > Δω), Eq. 6 is fit to the CPMG dispersion data.
in which φex = papbΔω2/kex.
Transverse spin-relaxation data using the rcCPMG experiment (7) for the WT, D121A, and H48A enzyme samples were acquired at 800 and 600 MHz at 298 K. At each static magnetic field, R2(1/τcp) relaxation rates were measured by acquiring two-dimensional experiments with interpulse delays, τcp, during the nitrogen relaxation period of 0.625, 0.714, 1.0, 1.25, 1.67, 2.0, 2.50, 3.33, 5.0, and 10.0 ms. Relaxation rates were determined from a reference experiment with a total relaxation time of 0.0 ms and one with the total relaxation time equal to 40.0 ms (42). The proton carrier frequency was set coincident with the water resonance. The 15N carrier was set to 120 ppm, and the 13C carrier was placed at 17 ppm for methionine and 54 ppm for alanine.
Differential multiple-quantum relaxation experiments were performed as described by Kloiber and Konrat (32). Peak intensities were measured for a reference and a cross-relaxation experiment representing the autorelaxation of multiple quantum coherence (decay of 2IxSx) and conversion of 2IxSx to 2IySy due to modulation of isotropic chemical shifts by conformational exchange phenomena. The ratio of peak intensities for the cross-relaxation (Icross) and autorelaxation (Iauto) at a 10-ms relaxation time (Tc) were used to determine the differential multiple quantum relaxation rate ΔRMQ,
Proton Inventory Analysis.
Conformational exchange rate constants, kex determined from CPMG dispersion analysis were determined as a function of atom fraction of 2H2O, n. From these data, the Gross–Butler (28) equation was fit to determine the transition state fractionation factor.
 |
In Eq. 8, kn is the measured rate constant in n-atom fraction of 2H2O, k0 is the rate constant in pure H2O, and φiR and φiT are the isotopic fractionation factors for the ith site in the reactant and transition state, respectively. In this analysis, it is reasonably assumed (43) that φiR ≈ 1. In this case, Eq. 8 predicts a linear dependence of the rate constant for a single proton.
Supplementary Material
Acknowledgments
We thank Thusitha Jayasundera for performing the isothermal titration calorimetry experiments. J.P.L. was supported by National Science Foundation CAREER Grant MCB0236966 and by the Alfred P. Sloan Foundation. E.D.W. was supported by National Institutes of Health Biophysics Training Grant 5T32GM008283.
Abbreviations
- CPMG
Carr–Purcell–Meiboom–Gill
- rcCPMG
relaxation-compensated CPMG
- KSIE
kinetic solvent isotope effect
- 3′-CMP
cytidine monophosphate.
Footnotes
The authors declare no conflict of interest.
This article is a PNAS Direct Submission.
This article contains supporting information online at www.pnas.org/cgi/content/full/0702551104/DC1.
References
- 1.Park C, Raines RT. Biochemistry. 2003;42:3509–3518. doi: 10.1021/bi026076k. [DOI] [PubMed] [Google Scholar]
- 2.Maister SG, Pett CP, Albery WJ, Knowles JR. Biochemistry. 1976;15:5607–5612. doi: 10.1021/bi00670a027. [DOI] [PubMed] [Google Scholar]
- 3.Hammes GG. Biochemistry. 2002;41:8221–8228. doi: 10.1021/bi0260839. [DOI] [PubMed] [Google Scholar]
- 4.Hammes GG. Nature. 1964;204:342–343. doi: 10.1038/204342a0. [DOI] [PubMed] [Google Scholar]
- 5.Benkovic SJ, Hammes-Schiffer S. Science. 2003;301:1196–1202. doi: 10.1126/science.1085515. [DOI] [PubMed] [Google Scholar]
- 6.Wolfenden R, Snider MJ. Acc Chem Res. 2001;34:938–945. doi: 10.1021/ar000058i. [DOI] [PubMed] [Google Scholar]
- 7.Loria JP, Rance M, Palmer AG. J Am Chem Soc. 1999;121:2331–2332. [Google Scholar]
- 8.Sela M, White FH, Jr, Anfinsen CB. Science. 1957;125:691–2. doi: 10.1126/science.125.3250.691. [DOI] [PubMed] [Google Scholar]
- 9.Richards FM, Wyckoff HW. In: The Enzymes. Boyer PD, editor. Vol 4. New York: Academic; 1971. pp. 647–806. [Google Scholar]
- 10.Ledoux L. Nature. 1955;175:258–259. doi: 10.1038/175258b0. [DOI] [PubMed] [Google Scholar]
- 11.Cathou RE, Hammes GG. J Am Chem Soc. 1965;86:3240–3245. doi: 10.1021/ja00949a003. [DOI] [PubMed] [Google Scholar]
- 12.Cole R, Loria JP. Biochemistry. 2002;41:6072–6081. doi: 10.1021/bi025655m. [DOI] [PubMed] [Google Scholar]
- 13.Kartha G, Bello J, Harker D. Nature. 1967;213:862–865. doi: 10.1038/213862a0. [DOI] [PubMed] [Google Scholar]
- 14.Kovrigin EL, Cole R, Loria JP. Biochemistry. 2003;42:5279–5291. doi: 10.1021/bi034027h. [DOI] [PubMed] [Google Scholar]
- 15.Zegers I, Maes D, Dao-Thi MH, Poortmans F, Palmer R, Wyns L. Protein Sci. 1994;3:2322–2339. doi: 10.1002/pro.5560031217. [DOI] [PMC free article] [PubMed] [Google Scholar]
- 16.Beach H, Cole R, Gill M, Loria JP. J Am Chem Soc. 2005;127:9167–9176. doi: 10.1021/ja0514949. [DOI] [PubMed] [Google Scholar]
- 17.Wlodawer A, Svensson LA, Sjolin L, Gilliland GL. Biochemistry. 1988;27:2705–2717. doi: 10.1021/bi00408a010. [DOI] [PubMed] [Google Scholar]
- 18.Dubins DN, Filfil R, Macgregor RB, Chalikian TV. J Phys Chem B. 2000;104:390–401. [Google Scholar]
- 19.Kovrigin EL, Loria JP. Biochemistry. 2006;45:2636–2647. doi: 10.1021/bi0525066. [DOI] [PubMed] [Google Scholar]
- 20.Eisenmesser EZ, Bosco DA, Akke M, Kern D. Science. 2002;295:1520–1523. doi: 10.1126/science.1066176. [DOI] [PubMed] [Google Scholar]
- 21.Eisenmesser EZ, Millet O, Labeikovsky W, Korzhnev DM, Wolf-Watz M, Bosco DA, Skalicky JJ, Kay LE, Kern D. Nature. 2005;438:117–121. doi: 10.1038/nature04105. [DOI] [PubMed] [Google Scholar]
- 22.Boehr DD, McElheny D, Dyson HJ, Wright PE. Science. 2006;313:1638–1642. doi: 10.1126/science.1130258. [DOI] [PubMed] [Google Scholar]
- 23.Williams JC, McDermott AE. Biochemistry. 1995;34:8309–8319. doi: 10.1021/bi00026a012. [DOI] [PubMed] [Google Scholar]
- 24.Wang M-S, Gandour RD, Rodgers J, Haslam JL, Schowen RL. Bioorg Chem. 1975;4:392–406. [Google Scholar]
- 25.Kovrigin EL, Loria JP. J Am Chem Soc. 2006;128:7724–7725. doi: 10.1021/ja061435a. [DOI] [PubMed] [Google Scholar]
- 26.Lee GC, Chan SI. Biochem Biophys Res Commun. 1971;43:142–148. doi: 10.1016/s0006-291x(71)80098-0. [DOI] [PubMed] [Google Scholar]
- 27.Skrynnikov NR, Dahlquist FW, Kay LE. J Am Chem Soc. 2002;124:12352–12360. doi: 10.1021/ja0207089. [DOI] [PubMed] [Google Scholar]
- 28.Gross P, Steiner H, Krauss F. Trans Faraday Soc. 1936;32:877–879. [Google Scholar]
- 29.Markley JL. Biochemistry. 1975;14:3554–3561. [Google Scholar]
- 30.Schultz LW, Quirk DJ, Raines RT. Biochemistry. 1998;37:8886–8898. doi: 10.1021/bi972766q. [DOI] [PMC free article] [PubMed] [Google Scholar]
- 31.Hammes GG, Walz FG. J Am Chem Soc. 1969;91:7179–7186. [Google Scholar]
- 32.Kloiber K, Konrat R. J Biomol NMR. 2000;18:33–42. doi: 10.1023/a:1008317212558. [DOI] [PubMed] [Google Scholar]
- 33.delCardayre SB, Raines RT. Biochemistry. 1994;33:6031–6037. doi: 10.1021/bi00186a001. [DOI] [PubMed] [Google Scholar]
- 34.Rosenberg HF. J Biol Chem. 1995;270:7876–7881. doi: 10.1074/jbc.270.14.7876. [DOI] [PubMed] [Google Scholar]
- 35.Venkitakrishnan RP, Zaborowski E, McElheny D, Benkovic SJ, Dyson HJ, Wright PE. Biochemistry. 2004;43:16046–16055. doi: 10.1021/bi048119y. [DOI] [PubMed] [Google Scholar]
- 36.Benkovic SJ, Hammes-Schiffer S. Science. 2006;312:208–209. doi: 10.1126/science.1127654. [DOI] [PubMed] [Google Scholar]
- 37.Wong KF, Selzer T, Benkovic SJ, Hammes-Schiffer S. Proc Natl Acad Sci USA. 2005;102:6807–6812. doi: 10.1073/pnas.0408343102. [DOI] [PMC free article] [PubMed] [Google Scholar]
- 38.Skrynnikov NR, Mulder FA, Hon B, Dahlquist FW, Kay LE. J Am Chem Soc. 2001;123:4556–4566. doi: 10.1021/ja004179p. [DOI] [PubMed] [Google Scholar]
- 39.Carver JP, Richards RE. J Magn Reson. 1972;6:89–105. [Google Scholar]
- 40.Davis DG, Perlman ME, London RE. J Magn Reson Ser B. 1994;104:266–275. doi: 10.1006/jmrb.1994.1084. [DOI] [PubMed] [Google Scholar]
- 41.Jen J. J Magn Reson. 1978;30:111–128. [Google Scholar]
- 42.Mulder FA, Skrynnikov NR, Hon B, Dahlquist FW, Kay LE. J Am Chem Soc. 2001;123:967–975. doi: 10.1021/ja003447g. [DOI] [PubMed] [Google Scholar]
- 43.Gandour RD, Schowen RL. Tranistion States of Biochemical Processes. New York: Plenum; 1978. p. 616. [Google Scholar]
Associated Data
This section collects any data citations, data availability statements, or supplementary materials included in this article.


