

Abstract
Biases in information processing undoubtedly play an important role in the maintenance of emotion and emotional disorders. In an attentional cueing paradigm, threat words and angry faces had no advantage over positive or neutral words (or faces) in attracting attention to their own location, even for people who were highly state-anxious. In contrast, the presence of threatening cues (words and faces) had a strong impact on the disengagement of attention. When a threat cue was presented and a target subsequently presented in another location, high state-anxious individuals took longer to detect the target relative to when either a positive or a neutral cue was presented. It is concluded that threat-related stimuli affect attentional dwell time and the disengage component of attention, leaving the question of whether threat stimuli affect the shift component of attention open to debate.
The nature of the relations between cognition and emotion has a long history. For example, in The Art of Rhetoric Aristotle (trans. 1991) foreshadowed contemporary cognitive theories of emotion with his assertion that one’s belief about an object determines the emotional reaction to that object. It is not the external object per se that is critical, but rather the individuals belief about that object (see Power & Dalgleish, 1997). This notion is reflected in many contemporary theories of emotion that argue that the initial appraisal of a situation or object (as benign, positive, or negative) is one of the major determinants of the emotional response to that situation (e.g., Lazarus, 1966; Mandler, 1984; Oatley & Johnson-Laird, 1987). These theories of normal emotion have their parallel in theories of emotional disorder, which argue that disordered emotions such as depression and anxiety might stem from disorders of thinking. To illustrate, the influential theory outlined by Aaron Beck (e.g., Beck, 1976) proposed that depression is characterized by dysfunctional schemata reflecting a cognitive triad that focuses on negative views of the self, of the world, and of the future. Beck’s cognitive theory of emotional disorders led to the testable prediction that people in depressive and anxious mood states should demonstrate very general mood congruent biases in cognitive processing. For instance, a depressed individual should be more likely to both notice and remember negative information in comparison with positive or neutral information. A large research literature has partially supported this prediction in finding mood congruent biases under some conditions. However, it turns out that the pattern of cognitive bias observed in emotional disorder is far more specific than Beck’s model predicts. As reviewed by Williams, Watts, MacLeod, and Mathews (1988, 1997) mood congruent memory biases are reasonably well established in depression (but not in anxiety), whereas mood congruent attentional biases are well established in anxiety (but not in depression). This more refined pattern of cognitive bias dovetails nicely with the notion that a subset of basic emotions evolved for different purposes (e.g., Darwin, 1872/1965; Ekman, 1992). As argued by Oatley and Johnson-Laird (1987), the adaptive function of emotions depends upon the particular emotion being studied. The idea is that basic emotions such as anger, fear, happiness, sadness, and disgust evolved for particular functions. It is likely, for example, that the basic emotion of fear evolved to enable an organism to rapidly detect and respond to danger in its environment (Le Doux, 1996). Much research has been conducted on the brain’s fear system in both animals and humans (e.g., Armony & Le Doux, 2000, for review). The fear system involves a range of neural areas, in particular the amygdala, and this system is especially sensitive to naturally occuring fear-relevant stimuli, such as snakes or angry faces (e.g., Morris, Ohman, & Dolan, 1998).
From this perspective, it should come as no surprise that different emotions may be characterized by quite different patterns of cognitive biases, rather than by the more general effects predicted by models such as Beck’s (1976). Because human anxiety probably reflects the activity of the fear system, we would expect a highly sensitized attentional system in states of heightened anxiety, with no particular reason to expect biases in memory. Thus, for those interested in understanding the cognitive mechanisms associated with human anxiety and in developing possible treatment strategies for anxiety disorders, the study of attentive processing is especially relevant (see Mogg & Bradley, 1999; Wells & Matthews, 1994; Williams et al., 1988, 1997).
The study of anxious individuals also has implications for understanding the basic mechanisms of human attention. It is widely thought that a main adaptive function of attentive processing is to facilitate fast and accurate perception of the environment and to maintain processing resources on relevant stimulus inputs (e.g., La Berge, 1995). Yantis (1996) pointed out that what gets selected by the attentional system at any given moment is determined by (a) the properties of the scene and (b) the expectations, beliefs, and goals of the observer. We would suggest that fear-relevant stimuli such as snakes, spiders, and angry faces might have a biological basis for being prioritized by the attentional system. Evidence comes from psychophysiological studies showing that autonomic responses can be easily conditioned by fear relevant stimuli, such as snakes, but not by fear-irrelevant stimuli, such as flowers (Esteves, Dimburg, & Ohman, 1994; Ohman & Soares, 1998). It is therefore natural to assume that the attentional system of anxious individuals might be particularly sensitive to the presence of fear-relevant stimuli in the environment. Thus, we suggest that for those interested in the fundamental mechanisms of attention, the study of people in an anxious mood state provides a good opportunity to observe highly sensitized attentional processes. Moreover, for those interested in clinical conditions of anxiety (e.g., phobias, generalized anxiety disorder, panic attacks, and posttraumatic stress disorder), the study of attentional mechanisms may provide a deeper understanding of the cognitive biases purportedly underlying these disorders, which may, in turn, be useful for the development of relevant clinical treatment strategies. With respect to this issue, recall that several theories assume fundamental biases in information processing play a key role in the etiology and maintenance of many emotional disorders (e.g., Beck, 1976; Brewin, 1988; Eysenck, 1992; Mogg & Bradley, 1999; Power & Dalgleish, 1997; Wells & Matthews, 1994; Williams et al. 1988, 1997). For the reasons outlined above, this article will focus primarily on visual attention and the processing of threat-related (i.e., fear-relevant) stimuli in relation to human anxiety.
Do Threat-Related Stimuli Draw Visual-Spatial Attention?
A primary function of visual-spatial attention is probably to enable rapid detection and analysis of new objects appearing in the environment (Yantis, 1996). It seems reasonable to assume that potentially dangerous stimuli may be particularly important contenders for the capture of the visual-attention system, as it is highly adaptive to rapidly detect and respond to threat-related stimuli. Empirical research in social cognition, cognitive and clinical psychology, as well as neurobiology (e.g., Le Doux, 1996; Pratto, 1994; Pratto & John, 1991; Williams et al., 1988, 1997) has suggested that threat-related stimuli have a special propensity to attract visual attentive processing. In this article, we directly address the validity of this assumption. Specifically, we ask whether threat-related stimuli tend to draw attentive processes toward themselves. An alternative possibility is that attentional processes take longer to disengage from threat-related stimuli. The latter would suggest that the bias in the attentional system occurs subsequent to the initial orienting of attention. We will argue that this is an important theoretical distinction that has not been directly investigated before.
Evidence for the propensity of threatening stimuli to attract attention comes from research using classic selective attention tasks in which threat and neutral stimuli are placed in competition with each other, and the participant has to select one and ignore the other. For example, Pratto and John (1991) presented various positive and negative trait adjectives in different colored ink to a group of young adults and found that color naming (i.e., Stroop-like interference) was longest on the negative trait adjectives. They concluded that the negative information captured the attention of the participants at an automatic level, leading to more interference on the color-naming task. Similar tasks have been presented to highly anxious individuals that demonstrate that both clinically anxious people, as well as nonclinical individuals with high levels of self-reported anxiety, take longer to name the colors of threat-related words relative to neutral words (see Williams, Mathews, & MacLeod, 1996, for review). Many theorists have assumed that these results reflect the automatic drawing of attentive processing toward threat-relevant or negative stimuli. MacLeod, Mathews, and Tata (1986) developed a dot-probe paradigm to more directly assess whether visual attention is indeed allocated toward the location of threat-related words in anxious people. In this task, two words (one neutral, one threat-related) are presented about 5 cm apart (one above the other) on a computer screen. The distribution of attention is measured by a secondary task involving the detection of a small dot that can appear in the spatial location of either the top or the bottom word after the display is terminated. Using this paradigm, MacLeod et al. (1986) found that anxious patients were faster to detect the dot when it appeared in the location in which a threat-related word had just appeared. This pattern was not observed in nonanxious control participants. Similar findings have been reported in groups of nonclinical participants with high levels of self-reported trait anxiety (e.g., Fox, 1993; MacLeod & Mathews, 1988). These and related findings have been taken as further evidence that anxious individuals are indeed characterized by a hypervigilant attentional system (e.g., Eysenck, 1992; Williams et al. 1988). Taken together, these studies suggest that there is a general tendency for negative or threat-related information to draw visual attention, and that this is particularly apparent in anxious individuals.
Further evidence comes from masked (subliminal) versions of both the Stroop (e.g., Bradley, Mogg, Millar, & White, 1995; MacLeod & Rutherford, 1992; Mogg, Bradley, Williams, & Mathews, 1993) and dot-probe paradigms (e.g., Bradley, Mogg, & Lee, 1997; Mogg, Bradley, & Williams, 1995). These studies report a similar pattern of results to the unmasked tasks even when the words are, at least subjectively, below the threshold of detection. This suggests that a bias toward threat-related stimuli occurs at a preconscious level of analysis and is often taken as evidence that anxiety is characterized by an initial orienting of attention toward threat stimuli. In summary, results from the Stroop and dot-probe tasks have been widely interpreted as evidence for an anxiety-related bias in the initial orienting of attention toward threat material.
Problems in Interpreting Stroop and Dot-Probe Results
There is a serious problem, however, in interpreting the Stroop (and dot-probe) results arising from the fact that the critical- to-be-ignored material is generally presented within foveal vision. Although foveal vision and attention are not the same thing, there is a general consensus that it is impossible not to attend to information presented within about a 1° radius from fixation (e.g., Eriksen & Eriksen, 1974; Treisman, 1969). Thus, with both the Stroop and the dot-probe tasks it is impossible to determine whether the threatening information draws attention or whether, once detected, threat-related information holds attention. Both processes would of course lead to longer color-naming times on a Stroop task and, similarly, longer latencies on the dot-probe tasks. The problem in interpreting the latter results is that, even though the two words are spatially separated, both locations are task relevant. Thus, an obvious strategy to be adopted by a participant would be to attend to both locations, or rapidly shift attention between the upper and lower locations. Arguably therefore, in the dot-probe task, the critical stimuli never appear in truly unattended locations.
An additional problem with early versions of the dot probe was that participants had to name aloud the upper word (i.e., attend to the upper location). This means that if the dot appeared in the lower location, any bias might reflect the shift component of attention, whereas a dot appearing in the upper location would likely reflect a bias in the hold or disengage component (see Wells & Matthews, 1994, for further discussion). Later experiments circumvented this problem by presenting a central fixation and requiring participants to discriminate a target appearing in the upper or lower locations (e.g., Bradley, Mogg, Falla, & Hamilton, 1998). However, even with this procedure the problem remains that in most studies the stimuli are presented for a relatively long time (500 ms) and both locations are task relevant. Thus, both locations are likely to receive attentive processing. The important point is that it is difficult to determine whether threat-related stimuli attract attention to themselves in the first place or whether once a threat stimulus has been detected, attention tends to then dwell in that location.
On this issue there is some indication that threat-related or negative stimuli may affect attentional dwell time rather than automatically attracting attentive processing. First, White (1996) replicated the Stroop results of Pratto and John (1991) by showing that participants took longer to name the colors of negative relative to positive trait adjectives. However, White (1996) then required participants to name centrally located color patches while ignoring spatially separate trait adjectives. If negative information does indeed draw attention, as implied by Pratto and John, then the spatially separate adjectives should also produce Stroop-like interference. However, the results showed no evidence for increased Stroop-like interference from negative adjectives when they were spatially separate from fixation (White, 1996). This finding casts some doubt on the assumption that negative information induces a faster shift of spatial attention to its own location. A similar doubt was raised by results reported by Fox (1994). In her study, threat-related and neutral words were presented to anxious and control participants in a spatially separate location from fixation. Under these conditions, neither high nor low trait-anxious participants showed any evidence for increased Stroop-like interference. These results (Fox, 1994; White, 1996) indicate that the presence of threat-related stimuli in the visual environment may not necessarily draw visual attentive processes to their location, thus arguing against the notion that anxiety may be characterized by a hypervigilance of the attentional system (Eysenck, 1992).
Is Exogenous Orienting of Attention Immune to the Influence of Higher Level Cognitive Variables?
It is our contention that the observation of anxiety-related attentional bias with foveal stimuli alongside the failure to find such a bias from spatially unattended stimuli is theoretically important. This is because it suggests that the bias may not be due to threat-related stimuli automatically drawing visual attention, but could well be due to the anxious individual’s inability to disengage attention from threatening stimuli once such stimuli have been attended. In other words, attending to threat-related stimuli may increase attentional dwell time resulting in a slower disengagement from negatively valenced stimuli. This hypothesis can be directly investigated in accordance with a relatively new model of visual-spatial attention (Posner & Petersen, 1990) that has not yet been widely applied to anxiety-related attentional bias. There is now substantial evidence that the human attention system is not unitary but instead consists of (at least) three components: attentional shifting, engagement, and disengagement (Posner & Petersen, 1990).
To assess the precise mechanism responsible for the attentional bias effects observed in anxiety, a modification of the exogenous cueing paradigm used by Posner, Inhoff, Friedrich, and Cohen (1987) was used. In this task, participants are required to detect a target (e.g., a square) that may appear to the left or to the right of a fixation point. On some trials, a cue (e.g. a flashing light) highlights the area in which the target will appear. A key feature of this arrangement is that the cue correctly predicts the target location only 80% of the time (i.e., a valid cue). In the remaining 20% of the trials, the target appears in the opposite location to the cue (i.e., an invalid cue). The typical finding is that a valid cue leads to a benefit in response times (RTs), whereas an invalid cue leads to a RT cost relative to an uncued condition. Simply put, an exogenous cue induces a covert orienting of attention to the cued location leading to faster RTs on valid trials and slower RTs on invalid trials. This is generally known as a cue validity effect.
Exogenous cues produce facilitatory effects that are strongest when the temporal separation between the cue and the target is less than about 200 ms. Moreover, cue validity effects occur regardless of whether the cue is actually informative; the cues are difficult to ignore even when the participant has been explicitly instructed to do so (see Jonides, 1981, for an overview). Because of these characteristics of exogenous cueing, it is widely assumed that peripheral cues reflect the operation of a reflexive orienting system that is immune to higher level cognitive influences (e.g., Briand & Klein, 1987; Posner, 1980). In other words, it is assumed that orienting of attention by means of exogenous cues reflects an encapsulated system that cannot be affected by other cognitive processes, such as voluntary control, for example.
If this is correct, then we would not expect the meaning or valence of a cue to affect the speed or accuracy of attentional orienting. However, in a recent study this assumption has been questioned. Stolz (1996) used an exogenous cueing paradigm to assess whether spatial attention processes can be influenced by higher level linguistic variables. Participants were required to fixate on a word at the center of a computer screen. An abrupt-onset word cue was then presented either above or below fixation, followed immediately by a target to be detected in either the cued or the uncued location. The key manipulation was that on one half of the trials, the word cue was semantically related to the fixation word. The results clearly demonstrated that the semantic relation between the fixation word and the cue word had a strong influence on the related cue’s ability to hold attention at the cued location. Thus, RTs on invalid related trials were slowed considerably, relative to invalid unrelated trials, suggesting that a related cue hindered the disengagement process. However, no differences were found between related and unrelated valid trials, suggesting that a related cue did not affect the ability of the cue to draw attention. Stolz concluded that the shift component of attention may be encapsulated (i.e., not affected by higher level variables) but that the disengage component is not encapsulated. These results are relevant to our study in that they suggest that we should not necessarily expect threat-related stimuli to draw spatial attention, but that such stimuli may well affect the disengage component of attention. This, of course, is exactly in line with our prediction.
The Present Study
The novelty of our modification of the exogenous cueing paradigm is that the valence of the cue was manipulated. Across five experiments, the cue was a word (or face) that was neutral, positive, or threat-related, whereas the target was a neutral geometric shape (circle). We included stimuli with a positive emotional valence to check that any bias we found was specific to threat material rather than to emotional material in general, regardless of valence (cf. Martin, Williams, & Clark, 1991; Russo, Patterson, Roberson, Stevenson, & Upward, 1996). We should note at this point that our negative stimuli, however, were always fear-relevant and, therefore, we did not assess whether negative but non threat-related stimuli (e.g., sad faces) might produce the same effect. From an evolutionary perspective, it can be predicted that fear-relevant stimuli might activate the fear-detection system, whereas more general negative stimuli should not (Ohman & Soares, 1993). We intend to address these issues in future studies; however, in the present study, we restrict ourselves to critical stimuli (threat-related words, angry faces) that should be fear-relevant for people in anxious mood states.
We suggest that the cueing paradigm should allow us to distinguish between two processes potentially responsible for previous demonstrations of attentional bias effects in anxiety. We expect no difference between anxious and nonanxious participants when the cue is a neutral word (or face). The critical trials are those in which the cue is a threat-related or positive stimulus. If threat-related (or positive) stimuli automatically draw the attention of anxious people then they might well be faster than control participants in responding to a target when the cue is valid. This result would indicate that anxious people are faster than control participants in shifting their attention to the location of a threat-related cue. On the other hand, if anxious participants have a problem in disengaging attention from threatening (or positive) information, then they should be slower than control participants in responding to the target on invalid cue trials. If threat (and not only emotion) is instrumental in inducing attentional bias in anxiety (or disrupting the disengagement of attention), then no difference between anxious and control participants should occur when either neutral or positively valenced cues are used.
In light of the evidence reviewed previously showing that the presence of threat-related stimuli in unattended locations does not involuntarily draw attention (Fox, 1994; White, 1996), it is predicted that attentional bias toward threat may be due to defective disengagement from threatening stimuli. Thus, we predict a difference on the disengage component of attention (i.e., invalidly cued trials), which should be stronger for high state-anxious participants than for low state-anxious participants. The evaluation of the shift component of attention is probably not best measured by the cueing paradigm, as RTs are generally very fast on valid trials. Expecting threat-related cues to further speed responding to a target is probably not realistic. On a more general level, however, our experiments provide a further test of the hypothesis that exogenous orienting is immune to the influence of higher order cognitive variables (cf. Stolz, 1996). Whereas Stolz examined variations in semantic features of cues, we examine variations in the emotional valence of cues.
State or Trait Anxiety?
In this article we focus on the construct of state-anxiety rather than trait-anxiety. Trait-anxiety is considered to be a personality disposition resulting in a higher frequency of episodes of increased situational or state-anxiety (Eysenck, 1992). There is some ambiguity about which type of anxiety drives attentional biases, with most researchers assuming that the interaction between trait- and state-anxiety is probably important (see Broadbent & Broadbent, 1988; MacLeod & Mathews, 1988; Mogg, Bradley, & Hallowel, 1994). In the present article, we felt that it was more appropriate to focus on state-anxiety because, on an intuitive level, elevations of state-anxiety would appear to be directly related to the activation of the fear-detection system. There is a substantial research base suggesting that the presence of biologically relevant threatening stimuli (e.g., a predator or an angry face) directly activates the fear-detection system at a neural level (e.g., Armony & Le Doux, 2000; Le Doux, 1996). It is activation of this system that we believe underlies the nature of the relationship between the attentional and the affective systems of the human brain. Although trait- and state-anxiety are highly correlated (Eysenck, 1992), we believe that state-anxiety provides a direct measure of the activation of the fear-detection system and thus allows us to relate our results more directly to both the social cognition (e.g., Pratto, 1994) and neurobiological literatures (e.g., Le Doux, 1996).
On a methodological point, we have collected state-anxiety measures on a large sample of participants (>300) gleaned from the same population as the participants in the present experiments. The median state-anxiety score of this sample was 37.5. Because it is difficult to categorize people scoring close to the median, we decided to analyze only the data from people scoring at or above 40 on the State-Anxiety scale (high state-anxious) and those scoring at or below 35 (low state-anxious) in the current experiments. Thus. any participant scoring from 36 to 39 on the State-Anxiety scale was not included in the data analysis.
Experiment 1
The aim of Experiment 1 is to determine (a) whether threat-related (or positive) words are more potent than neutral words in inducing an attentional shift to their own location, and (b) whether threat-related (or positive) words are more likely to hold visual attention than neutral words as measured by slower RTs on invalid trials (i.e., the disengage component). On the basis of the literature reviewed earlier, we made three specific predictions. First, we predicted that threat words will not be any more effective than neutral or positive words in attracting visual attention (i.e., equal RTs on neutral, positive, and negative word valid trials). Second, we predicted that RTs on invalid threat trials will be slower than RTs on invalid neutral or positive trials. Third, we predicted that the latter result will be significantly larger for high state-anxious relative than for low state-anxious participants. Because previous research has shown that attentional bias effects are strongest when state-anxiety is elevated above baseline levels (e.g., MacLeod & Mathews, 1988; Mogg et al., 1994), we attempted to induce an elevation of state-anxiety immediately prior to the cueing task. We presented participants with photographs of distressing scenes, which has been successful in inducing state-anxiety in previous studies in our lab (Fox, 1996).
Method
Participants
Participants were 59 undergraduate students from the University of Essex campus community, ranging in age from 17 to 34 years, with a modal age in the 20s. Those scoring at or above a score of 40 (n=26) on the Spielberger State-Anxiety scale immediately prior to the experiment and those scoring at or below 35 (n = 24) were classified as high and low state-anxious participants, respectively. These cutoffs resulted in the loss of 9 participants who scored between 35 and 40 on the State-Anxiety scale at test. Each person had normal or corrected-to-normal eyesight and participated in two experimental sessions consisting of 45 min and 15 min, respectively, for which they received payment of £4.
Materials
Mood induction
Ten A4 enlarged photographs of disaster scenes, urban terrorism, and riot police, selected from contemporary news magazines on the basis of their horrific content, were selected for the mood induction procedure. A brief questionnaire was also constructed to allow participants to rank order the photographs on the basis of how “frightening” they were.
Personality questionnaires
Each participant completed the Spielberger Trait-State Anxiety Inventory (STAI: Spielberger, Gorusch, Luchene, Vagg, & Jacobs, 1983), the Beck Depression Inventory (BDI: Beck, Ward, Mendelson, Mock, & Erbaugh, 1961), and the Marlowe-Crowne Scale of Social Desirability (MC: Crowne & Marlowe, 1964).
Stimuli for cueing experiment
A pilot study presented a list of 80 words selected from prior research to 10 people and asked them to rate each word on a 1 (low) to 7 (high) scale for (a) threat value and (b) emotionality. The Cronbach’s alpha was .86 showing good interrater reliability. From this pilot study, 16 neutral, 16 positive, and 16 threat words were selected for the experimental trials. There were no differences in terms of word frequency (Johansson & Hofland, 1989), word familiarity (Quinlan, 1992), or word length between the three categories, F(2, 45) = 1.8, F(2, 45) = 1.9, and F(2, 45) < 1.0, respectively. The positive and threat categories were comparable in terms of emotionality (5.8 and 5.3, respectively), and both were higher than the neutral words (2.1). The threat words were higher in terms of threat (6.2) than either the positive (1.3) or neutral (1.4) words (all ps < .05). The 48 stimulus words were divided into four sets of 12 words, each consisting of 4 neutral, 4 positive, and 4 threat words. A further set of 12 neutral words was selected for the practice trials.
Procedure
Participants were brought into a testing room and told that they were to rank order 10 photographs in terms of how frightening they were and to record their ranking on a standard response sheet. After this mood induction procedure, participants completed the STAI state-anxiety questionnaire. This provided a measure of state-anxiety at test.
After these two tasks, participants were asked to move to a computer in the same room for the reaction time experiment, where they were seated about 50 cm from a 35.6-cm serial video graphics array computer monitor. All stimulus presentation and data collection was controlled by Micro Experimental Laboratory (MEL) Version 2 software (Schneider, 1988). The participant’s task was to localize the side of the computer screen on which a target circle appeared by pressing the Z key for left and the “/” key for right on a standard computer keyboard. All displays were presented within three dark gray, square boxes, each subtending a visual angle of 5°. The edge to edge separation between the boxes was 3°, and the visual angle from the center of the middle box to the center of the peripheral boxes was 8°. The cueing display consisted of the same word printed in capital letters presented one line above and one line below the center of either the left or the right box. The target to be localized was a filled in white circle subtending an angle of 0.6° across the diameter. The sequence of events within each trial was as follows (see Figure 1): A fixation point (*) was presented at the center of the middle box and remained on the screen throughout the trial. The word cue was presented 1,000 ms after the onset of the fixation point in either the left or the right box for 100 ms. The cue was then blanked out, and 50 ms later the target circle was presented in the center of either the left or the right box until the participant responded (or until 2,000 ms elapsed). This gave a cue-target onset asynchrony of 150 ms. There was an intertrial interval of 1,000 ms before the next trial began.
Figure 1.
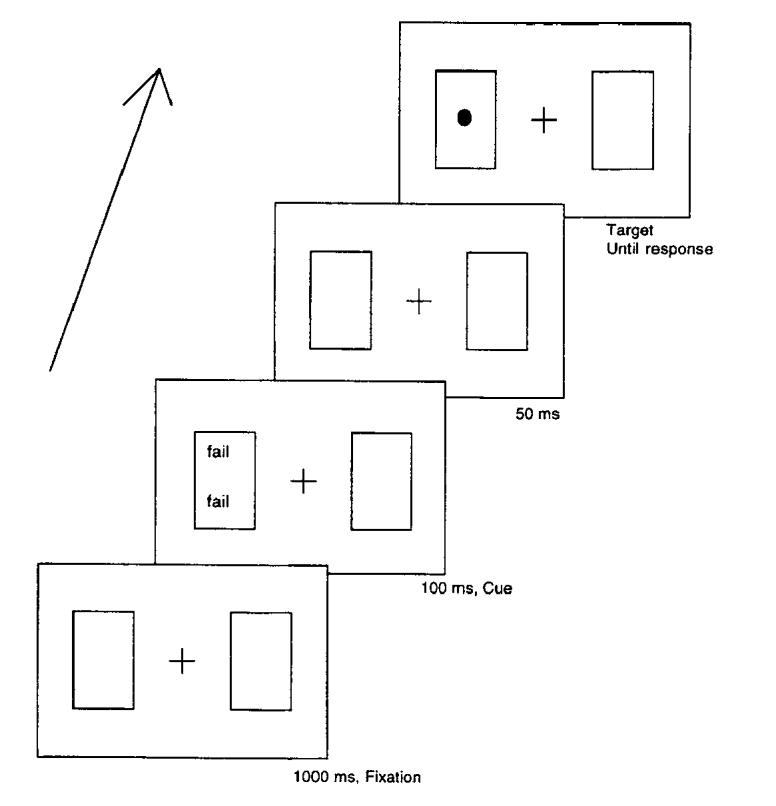
Example of a typical valid trial used in Experiment 1.
Each participant completed a block of 48 practice trials (all neutral word cues) followed by 16 blocks of experimental trials. The 48 word stimuli (16 neutral, 16 positive, 16 threat) were divided into four blocks, each consisting of 4 words from each category. All of the words were presented four times each within each block (i.e., 48 trials per block). Each of the four blocks was also presented four times each, which resulted in a total of 768 experimental trials. Each participant received a different randomized order of stimuli. For all participants, three fourths of the trials (576) were valid (i.e., the target appeared in the same spatial location as the cue) and one fourth (192) were invalid (i.e., the target appeared in the opposite spatial location to the cue). Neutral, positive, and threat cues appeared equally often on valid and invalid trials and in the left and righthand side boxes. Thus, each individual word was presented 16 times in the experimental trials: 12 times on the valid trials (6 on the left, 6 on the right) and 4 times on the invalid trials (2 on the left, 2 on the right).
After the computerized task, participants moved to another table in the same room and completed the STAI Trait-Anxiety scale, the BDI, and the MC scales. Approximately one week later, each individual returned to the same testing room and completed the STAI state-anxiety questionnaire again (baseline measure) and then completed the word ratings.
Design
A 2 (anxiety: high and low state-anxiety) × 2 (cue validity: valid and invalid) × 3 (cue valence: neutral, positive, threat) analysis of variance (ANOVA) factorial design was used. Anxiety was a between-subjects factor, and cue validity and cue valence were within-subjects factors. The prediction is that cue validity effects (i.e., faster RTs on valid relative to invalid trials) should be larger on threat cue trials than on neutral or positive cue trials. This larger validity effect is expected to be due to slower RTs on invalid threat cue trials rather than to faster RTs on valid threat cue trials. This pattern is expected to be particularly strong for high state-anxious participants.
Results
As shown in Table 1, the high state-anxious group scored significantly higher on measures of trait-anxiety, state-anxiety at baseline and at test, and on the BDI, whereas there was no difference between high and low state-anxious participants on the MC scale. A 2 (anxiety: high vs. low state-anxiety) × 2 (time: at test vs. baseline) ANOVA showed only a main effect for anxiety, F(1, 44) 51.3, MSE = 110.9, p < .001. There was no main effect for time and no Anxiety × Time interaction, suggesting that the mood induction procedure was not effective in increasing the level of state-anxiety above baseline.
Table 1.
Mean Scores, on the STAI Trait and State Anxiety Scales, the Beck Depression Inventory (BDI), and the Marlowe-Crown Social Desirability Scale (MC) for Experiments 1 and 2
| Group |
||||
|---|---|---|---|---|
| Measure | High state-anxious | Low state-anxious | t | df |
| Experiment 1 | ||||
| n | 26 | 24 | ||
| Trait anxiety | 47.6 (9.3) | 34.9 (6.3) | 5.6** | 48 |
| BDI | 11.6 (7.2) | 5.1 (3.6) | 4.0** | 48 |
| State anxiety (B) | 44.0 (12.0) | 30.3 (10.5) | 4.1** | 44 |
| State anxiety (T) | 46.8 (6.3) | 29.5 (4.3) | 11.2** | 48 |
| MC | 11.8 (5.5) | 13.0 (5.2) | <1 | 48 |
| Experiment 2 | ||||
| n | 17 | 19 | ||
| Trait anxiety | 48.3 (7.5) | 35.6 (9.8) | 4.3* | 34 |
| BDI | 10.2(4.2) | 6.1 (4.7) | 2.8* | 34 |
| State anxiety (T) | 46.2 (5.9) | 29.4 (4.1) | 10.0** | 34 |
| MC | 9.0(5.1) | 14.8(6.1) | 3.1* | 34 |
Note. STAI = State-Trait Anxiety Inventory; B = baseline; T = text. Standard deviations are in parentheses.
p < .01.
p < .001.
The RT data were filtered by removing all error trials and any data points less than 100 ms or greater than 2.5 SDs from that participant’s mean. The mean RT was then calculated for each participant as a function of each factor in the design. This filtering procedure was used in all subsequent experiments in this study. Errors tended to be very infrequent in this and subsequent experiments, and therefore the analysis focused on RT data only and not on error rates. Mean percentage error rates are presented alongside the RTs for each of the experiments in this series. However, there was not enough variability in the error rates to allow for parametric analysis. In the analysis of the RT data, in this and subsequent experiments, we used the Pillais multivariate test of significance (exact F test) if there was a violation of the sphericity assumption. Thus, if the Huynh-Feldt epsilon was less than 1.0, the Pillais exact F is reported. We used one-tailed t tests for all planned comparisons in which we had a specific prediction. For comparisons in which a specific a priori prediction was not made, the two-tailed t test was used. Finally, in this and all other experiments we included the higher order effects of cue location in the analysis. However, the location of the cue did not interact with any of the critical factors (or interactions) we were interested in, and therefore the data were collapsed across cue location for all of the analyses. The mean correct RT and error data for Experiment 1 are presented in Table 2. The RT data were subjected to a 2 (anxiety: high and low) × 2 (cue validity: valid and invalid) × 3 (cue valence: neutral, positive, negative) ANOVA. The only main effect to reach significance was for cue validity, F(1, 48) = 317.7, MSE = 1,172.6, p < .001, with participants responding about 70 ms faster on valid relative to invalid trials. There was also a significant two-way interaction between cue validity and cue valence, F(2, 96) = 3.9, MSE = 84.9, p < .024, which was not modified by anxiety, F(2, 96) < 1. Further analysis revealed that there was no main effect for cue type on the valid trials, F(2, 98) < 1. However, on the invalid trials there was a significant main effect for cue type, F(2, 98) 3.4, MSE = 116.1, p < .039, such that RTs following threat word cues were slower (375 ms) than RTs following either neutral (370 ms), t(49) = 1.6, p < .053, or positive (369 ms), t(49) = 2.6, p < .006, words. Planned contrasts revealed that the cue validity effect (i.e., the RT difference between valid and invalid trials) tended to be larger with threat cues (74 ms) than that observed for either neutral (70 ms), t(49) = 1.4, p < .08, or positive (67 ms), t(49) 2.9, p < .003, cues, whereas there was no difference between the neutral and positive cues.
Table 2.
Mean Correct Response Times (in Milliseconds) for the Three Types of Cue Word for High and Low State-Anxious Participants in Experiment 1
| Cue word |
|||
|---|---|---|---|
| Group | Neutral | Positive | Threat |
| High anxious | |||
| Valid trials | 297.0 (0.2) | 298.9 (0.3) | 297.2 (0.3) |
| Invalid trials | 365.3 (0.5) | 364.4 (0.5) | 371.1 (0.4) |
| Validity effect | 68.3 | 65.5 | 73.9 |
| Low anxious | |||
| Valid trials | 303.8 (0.1) | 305.3 (0.1) | 303.2 (0.1) |
| Invalid trials | 375.9 (0.1) | 373.9 (0.3) | 377.9 (0.3) |
| Validity effect | 72.1 | 68.6 | 74.7 |
Note. Percentage errors are in parentheses.
Discussion
The mood induction procedure was not successful in increasing state-anxiety above a baseline level in this experiment. Nevertheless, we did find a reliable Cue Valence × Cue Validity interaction in the predicted direction. When the cue was a threat word, participants took longer to localize the target on invalid trials relative to when the cue was either a positive word or a neutral word. Against prediction, there was no difference in this pattern of results between high and low state-anxious groups. Thus, under conditions in which a peripheral cue was valid 75% of the time, the valence of the cue made a difference to the speed at which people could localize a target in an uncued location. Presenting a threat word as a cue slowed down the localization of a target in an uncued location but did not speed up localization of the target in the cued location. These results support the notion that the orienting mechanism of attention may be encapsulated, whereas the disengage component may be influenced by higher level variables such as meaning or valence (see Stoltz, 1996). It should be noted at this point, however, that the use of a target localization task allows for a possible alternative interpretation of the cue validity effects. Rather than being due to the allocation of attention to the cued location, as we assume, it could be that the cue validity effects are due to the preparation of a response that was induced by the presentation of the cue (left or right). We circumvent this alternative interpretation in Experiment 4 by using a single response that is not associated with the location of the cue. However, we note that if the cue validity effects are being produced by motor-preparation effects, rather than by attentional effects, the current results are still of theoretical interest. In particular, it might be the case that the presentation of a threatening stimulus in the visual scene can disrupt the suppression of a prepared response to that location when the target appears in another location. We consider this issue more directly in Experiment 4 and in the General Discussion.
Experiment 2
The results of Experiment 1 revealed that threat words do indeed delay the response to a target appearing in an uncued location. This suggests that the emotional valence of a cue may influence the distribution of spatial attention or may influence response preparation effects. Contrary to our predictions, however, there was no difference in the pattern of results between high and low state-anxious participants. This may have been because we failed to induce state-anxiety above baseline levels in this experiment. An alternative approach is to use more biologically relevant stimuli such as facial expressions. There is evidence that facial expressions of emotion have strong attentional effects, and therefore these stimuli may be more appropriate in order to detect a difference between people varying in levels of naturally occurring state-anxiety (see Mogg & Bradley, 1999). We therefore decided to conduct an additional experiment with the current paradigm, except that schematic faces were used rather than words.
Faces were considered to be a good stimulus set to use for present purposes because there is evidence that humans are biologically hardwired for the recognition of facial expressions of emotion. For example, neuropsychological studies demonstrate that identity recognition and expression recognition are independent (e.g., Humphreys, Donnelly, & Riddoch, 1993). Neurophysiological studies with higher primates have shown that recognition of angry facial expressions is fast and automatic (e.g., Rolls, 1992), and similar results have been found with humans (e.g., Esteves et al., 1994). Finally, cognitive research has demonstrated that angry faces are especially easy to detect in visual search paradigms (e.g., Hansen & Hansen, 1988; but see Purcell, Stewart, & Skov, 1996). In the current experiment, we used simple schematic faces with neutral, happy, and angry expressions as cues in a Posner-type cueing paradigm (see Figure 2 for examples). In pilot work, we have found that people rate schematic faces (similar to those used here) with angry expressions as being more threatening than negative words. Moreover, these simple schematic faces with angry expressions have been found to be detected more efficiently in visual search tasks than faces with happy expressions (Fox et al., 2000).
Figure 2.
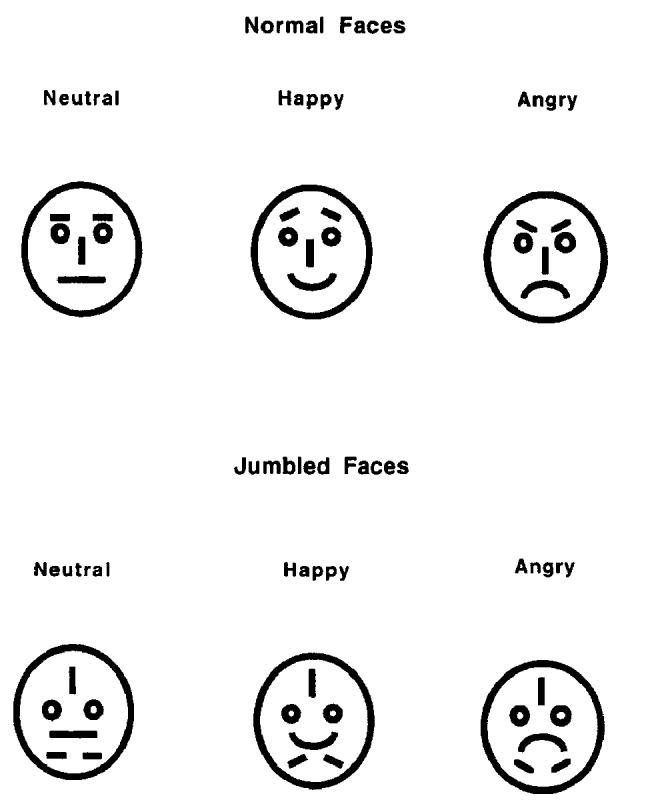
Example of the schematic face stimuli used in Experiments 2 and 3 (normal faces) and the jumbled faces used in Experiment 2 (jumbled faces).
It is reasonable to ask, of course, whether the cognitive mechanisms involved in decoding facial expressions of emotion are also engaged in processing schematic facial expressions. A number of studies have suggested that the use of schematic faces offers a useful methodology to study the particular facial features that may be important in conveying facial threat (e.g., Aronoff, Barclay, & Stevenson, 1988; Lundqvist, Esteves, & Ohman, 1999; McKelvie, 1973; Yamada, 1993). Moreover, recent experiments using a visual search paradigm have shown that threatening facial expressions are detected more efficiently than positive emotional expressions (happiness) when using schematic faces (Fox et al., 2000),which is similar to that observed with photographs of real faces (Hansen & Hansen, 1988). Thus, we argue that the use of schematic faces allows us to investigate mechanisms of face processing that are relevant to the processing of real faces. Experiment 4 provides more direct evidence for this assumption in showing a very similar pattern of results when real faces are used as the stimuli.
Method
Participants
Participants were 42 undergraduate students from the University of Essex campus community ranging in age from 17 to 31 years, with a modal age in the 20s. Those scoring at or above a score of 40 (n = 17) on the Spielberger State-Anxiety scale immediately prior to the experiment and those scoring at or below 35 (n = 19) were classified as high and low state-anxious participants, respectively. These cutoffs resulted in the loss of 6 participants who scored between 35 and 40 on the State-Anxiety scale at test. Each person had normal or corrected-to-normal eyesight and participated in one experimental session lasting about 45 min for which they received payment of £4.
Materials and Procedure
Schematic faces were created by assembling standardized facial features in a computerized drawing package. There were three main face types: neutral, happy, and angry, as shown in Figure 2. These simple schematic faces carrying emotional expressions were all reliably categorized as neutral, happy, and angry in a pilot test in which 12 people chose one of the following labels for each of the three faces: sad, happy, surprised, angry, disgusted, and neutral. Three jumbled faces were also constructed from the neutral, happy, and angry faces, respectively. The internal features of the faces were jumbled, but left-right symmetry was retained (see Figure 2). Each of the faces was 2.5 cm in height and 1.8 cm wide on the computer screen. The face stimuli were used as cues in the experiment. The target that participants had to detect was a white circle (MEL character #39) with a diameter of 0.3 cm. Cue and target stimuli were presented inside two dark gray squares that were 5.3 cm high and 3.0 cm wide and were displayed 2.0 cm to the left and the right of the central fixation point (cross shape). These squares were continuously present on the computer screen. All of the stimuli were presented on a Pentium P5/120 PC with a 28-cm color monitor and ATI Mach64 graphics card. All stimulus presentation and data collection was controlled by MEL software, Version 2 (Schneider, 1988).
On arrival at the laboratory, each participant completed the STAI Trait- and State-Anxiety scales, the BDI, and the MC Social Desirability scale. There was no mood induction procedure in this experiment. On completion of the questionnaires, participants were asked to move to a computer in the same room for the reaction time experiment, where they were seated about 50 cm from the computer monitor. The participant’s task was to localize the side of the computer screen on which the target circle appeared by pressing the Z key for left and the “/” key for right on a standard computer keyboard. The cue display consisted of one of the faces being presented in the upper half of either the left or the right box. The target circle later appeared in the lower half of either the left or the right box. This was to prevent any forward masking of the target by the face cue. The sequence of events within each trial was as follows: A fixation point (X) was presented at the center of the screen for 1,000 ms. A face cue was then presented in one of the peripheral boxes for either 100 ms or 250 ms, depending on the experimental condition (see below). The cue was then blanked out, and then either 200 ms or 50 ms later, depending on cue time, the target circle was presented in the lower half of either the left or the right box until the participant responded (or until 2,000 ms elasped). This gave a cue-target onset asynchrony of 300 ms. There was an intertrial interval of 1,000 ms before the next trial began.
There were two cue exposure durations (100 ms and 250 ms) used in this experiment, and these were presented in separate blocks. Each participant completed 10 blocks of 60 trials. These consisted of 1 practice block and 4 experimental blocks with a cue duration of 100 ms, and 1 practice and 4 experimental blocks with a cue duration of 250 ms. The order of the sets of blocks was fully counterbalanced across participants so that one half of the participants received the 1 practice and 4 blocks of trials with 100-ms cues first, followed by 1 practice and 4 experimental blocks of 250-ms cues. The other half of the participants received the reverse order. The practice blocks contained jumbled face cues only while the experimental blocks contained normal and jumbled faces randomly intermixed (neutral, happy, and angry). This resulted in 480 experimental trials: 240 with a cue duration of 100 ms, and 240 with a cue duration of 250 ms. Three fourths (75%) of each of these trials (180) were valid (i.e., the target appeared in the same spatial location as the cue) and one fourth (60) were invalid (i.e., the target appeared in the opposite spatial location to the cue). Normal neutral, normal happy, normal angry, jumbled neutral, jumbled happy, and jumbled angry cues appeared 30 times each on valid trials and 10 times each on invalid trials. The probability of any particular cue appearing in the left and right-hand side boxes was equal. Thus, each type of cue was presented 80 times in the experimental trials: 40 times on the right (30 valid, 10 invalid), and 40 times on the left (30 valid, 10 invalid).
Design
A 2 (anxiety: high and low state-anxiety) × 2 (order: 100-ms cues first and 250-ms cues first) × 2 (cue exposure: 100 ms and 250 ms) × 2 (face type: normal and jumbled) × 2 (cue validity: valid and invalid) × 3 (cue valence: neutral, happy, angry) ANOVA factorial design was used. Anxiety and order were between-subjects factors, and cue exposure, face type, cue validity, and cue valence were within-subjects factors. The main prediction is a Cue Validity × Cue Valence interaction for the normal face cues only, which should further interact with level of state-anxiety (i.e., an Anxiety × Face Type × Cue Validity × Cue Valence interaction). We expect that cue validity effects (i.e., faster RTs on valid relative to invalid trials) should be larger on angry face cue trials than on either neutral or happy face cue trials. This larger validity effect is expected to be due to slower RTs on invalid angry face cue trials rather than to faster RTs on valid angry face cue trials. As before, this pattern is expected to be particularly strong for high state-anxious participants. We expected no Cue Validity × Cue Valence interactions for the jumbled faces, which were included as a control for possible feature level differences between the different facial expressions. We had no specific predictions regarding the pattern of results for 100-ms and 250-ms cue exposure.
Results
A total of 42 people participated in Experiment 2, but the data of 6 participants were removed from the data set because their state-anxiety scores at the time of testing were between 35 and 40. The data of the remaining 36 participants were analyzed. As shown in Table 1, the high state-anxious group scored significantly higher on measures of trait-anxiety, state-anxiety at test, and on the BDI. In contrast to the previous experiment, there was also a difference between high and low state-anxious participants on the MC scale.
The mean correct RT data were filtered as before, and the mean RT and error data are presented in Table 3. The RT data were subjected to a 2 (anxiety: high and low state-anxiety) × 2 (order: 100-ms cues first and 250-ms cues first) × 2 (cue exposure: 100 ms and 250 ms) × 2 (face type: normal and jumbled) × 2 (cue validity: valid and invalid) × 3 (cue valence: neutral, happy, angry) ANOVA, with Participants as a random factor. There were main effects for anxiety, F(1, 32) = 4.9, MSE = 40,387.9, p < .034, such that participants with high state anxiety scores were slower (342 ms) than those with low state-anxiety scores (314 ms); cue exposure, F(l, 32) = 32.7. MSE = 2,370.2, p < .001, such that RTs were faster following 100-ms cue displays relative to 250-ms cue displays (319 ms and 338 ms, respectively); cue valence, F(2, 64) = 5.4, MSE = 184.3, p < .006, such that RTs were faster on neutral (327 ms) and happy (327 ms) than on angry (330 ms) trials; and cue validity, F(l, 32) = 172.9, MSE = 1,813.2,p < .001, such that RTs were faster following valid (308 ms) relative to invalid (348 ms) cues.
Table 3.
Mean Correct Response Times (in Milliseconds) for the Three Types of Cue Face as a Function of Whether Faces were Normal or Jumbled and Cue Presentation Time (100 ms or 250 ms) for High and Low State-Anxious Participants in Experiment 2
| Cue face |
|||
|---|---|---|---|
| Group and presentation time | Neutral | Happy | Angry |
| Normal faces | |||
| 100 ms | |||
| High anxious | |||
| Valid trials | 311 (0.2) | 314 (0.2) | 313 (0.2) |
| Invalid trials | 354 (0.3) | 345 (0.2) | 364 (0.2) |
| Validity effect | 43.0 | 31.0 | 51.0 |
| Low anxious | |||
| Valid trials | 287 (0.2) | 288 (0.2) | 288 (0.2) |
| Invalid trials | 312 (0.3) | 319 (0.2) | 329 (0.4) |
| Validity effect | 25.0 | 31.0 | 41.0 |
| 250 ms | |||
| High anxious | |||
| Valid trials | 326 (0.2) | 325 (0.2) | 328 (0.2) |
| Invalid trials | 370 (0.3) | 374 (0.2) | 398 (0.2) |
| Validity effect | 44.0 | 49.0 | 70.0 |
| Low anxious | |||
| Valid trials | 301 (0.2) | 305 (0.2) | 304 (0.2) |
| Invalid trials | 351 (0.3) | 339 (0.2) | 340 (0.4) |
| Validity effect | 50.0 | 34.0 | 36.0 |
| Jumbled faces | |||
| 100 Ms | |||
| High anxious | |||
| Valid trials | 314 (0.2) | 310 (0.2) | 315 (0.4) |
| Invalid trials | 356 (0.4) | 358 (0.3) | 343 (0.2) |
| Validity effect | 42.0 | 48.0 | 28.0 |
| Low anxious | |||
| Valid trials | 288 (0.2) | 287 (0.2) | 289 (0.2) |
| Invalid trials | 320 (0.4) | 326 (0.4) | 317 (0.4) |
| Validity effect | 32.0 | 39.0 | 28.0 |
| 250 ms | |||
| High anxious | |||
| Valid trials | 329 (0.2) | 328 (0.2) | 334 (0.2) |
| Invalid trials | 365 (0.3) | 369 (0.4) | 370 (0.4) |
| Validity effect | 36.0 | 41.0 | 36.0 |
| Low anxious | |||
| Valid trials | 306 (0.2) | 307 (0.2) | 303 (0.2) |
| Invalid trials | 340 (0.5) | 342 (0.4) | 347 (0.5) |
| Validity effect | 34.0 | 35.0 | 44.0 |
Note. Percentage errors are in parentheses.
There were several significant lower order interactions, but these were subsumed under a significant Anxiety × Cue Exposure × Face Type × Cue Validity × Cue Valence interaction, F(2, 64) = 3.2. MSE = 232.8, p < .049, which was not qualified by order, F(2, 64) < 1. In order to break down this complex interaction, we first collapsed the data across the two orders and examined the data for jumbled faces, only because we expected no critical Cue Validity × Cue Valence interactions with these control stimuli.
Jumbled Faces
A 2 (anxiety: high and low state-anxiety) × 2 (cue exposure: 100 ms and 250 ms) × 2 (cue validity: valid and invalid) × 3 (cue valence: neutral, happy, angry) ANOVA, with Participants as a random factor was conducted on the mean RTs for the jumbled face cues only. This analysis revealed main effects for cue exposure, F(1, 34) = 21.4, MSE = 164.5, p < .001, and cue validity, F(1, 34) = 94.9, MSE = 1,549.7, p < .001. No other effects were significant, although there was a trend for a Cue Exposure × Cue Valence × Validity interaction, Pillais F(2, 33) = 3.04, p < .061. This was due to a Cue Valence × Cue Validity interaction occurring for the short exposure time (100 ms) only, F(2, 68) = 3.26, MSE = 330.1, p < .045. Cue validity effects for happy cues (43 ms) were reliably larger than validity effects for angry cues (28 ms), t(35) = 2.63, p < .013 two-tailed, but were comparable to neutral cues (37 ms). No significant effects were found for the trials with long exposure (250 ms).
Normal Faces
A 2 (anxiety: high and low state-anxiety) × 2 (cue exposure: 100 ms and 250 ms) × 2 (cue validity: valid and invalid) × 3 (cue valence: neutral, happy, angry) ANOVA, with Participants as a random factor was conducted on the mean RTs for the normal face cues. This analysis revealed main effects for cue exposure, F(1, 34) = 41.1, MSE = 1,041.7, p < .001; cue validity, F(l, 34) = 225.0, MSE = 839.2, p < .001; and cue valence, F(2, 68) = 9.6, MSE = 229.2, p < .001. There were a number of lower order interactions, but these were subsumed within an Anxiety × Cue Exposure × Cue Validity × Cue Valence interaction, Pillais F(2, 33) = 4.2, p < .023.
In order to break down this interaction, we examined the data for short (100 ms) and long (250 ms) cue exposures separately. For the short cue exposure, there was a Cue Validity × Cue Valence interaction, F(2, 68) = 5.8, MSE = 185.3, p < .005, that was not qualified by anxiety group. Further analysis revealed that the cue validity effect for angry faces (46 ms) was larger than the cue validity effects for both neutral (34 ms), t(35) = 2.6, p < .007, and happy (31 ms), t(35) = 3.2, p < .001, faces.
For the long cue exposure, there was also a Cue Validity × Cue Valence interaction, Pillais F(2, 33) = 4.3, p < .025, but this was qualified by an Anxiety × Cue Validity × Cue Valence interaction, Pillais F(2, 33) = 3.7, p < .035. For the high state-anxious group, a one-way ANOVA on the valid trials showed no difference across cue valence, F(2, 32) < 1. In contrast, there was a significant difference across cue valence for the invalid trials, Pillais F(2, 15) = 5.2, p < .019. Further analysis revealed that RTs following angry cues were slower (398 ms) than RTs following invalid happy (374 ms), t(17) = 4.2, p < 01, or neutral (370 ms), t(17) = 5.7, p < 001, cues. Additional analysis revealed that for the high state-anxious group, cue validity effects for angry faces (70 ms) were larger than the cue validity effects for either neutral (44 ms), t(16) = 2.44, p < .027, or happy (49 ms), t(17) = 3.27, p < .005, faces. Cue validity effects were comparable for neutral and happy faces (44 ms vs. 49 ms, respectively).
For the low state-anxious group, a one-way ANOVA for cue valence revealed no significant differences among the neutral, happy, and angry face cues for either valid, F(2, 36) < 1, or invalid, Pillais F(2, 17) < 1.07 trials. Similarly, the cue validity effects for neutral (50 ms), happy (34 ms), and angry (36 ms) face cues did not differ from each other.
Discussion
In spite of a complex five-way interaction, the results of Experiment 2 are straightforward. First, there was a different pattern of results in the normal and jumbled face cue conditions. In the normal face conditions, the predictions were supported for the trials with long (250 ms) cue exposure. On these trials, high state-anxious people took longer to localize a target on invalid trials after an angry face cue relative to either neutral or happy face cues. As predicted, the angry cues did not induce faster localization of targets appearing in the cued location (shift component) but rather slowed down localization of targets in the uncued location (disengage component). This pattern did not occur for the low state-anxious participants.
Experiment 3
The results of Experiment 2 were supportive of the hypothesis that high state-anxious participants take longer to disengage from angry face cues relative to happy or neutral face cues. This pattern did not occur for the jumbled faces, indicating that low-level visual features of the stimuli cannot have produced the results, and this pattern also did not occur for low state-anxious individuals. We note once again that the results may be due to the angry facial expression disrupting the suppression of a prepared motor response, rather than delaying disengagement from the location of a threatening stimulus. It is interesting to note that when the cue was presented for 100 ms, all of the participants demonstrated longer RTs on angry face trials with no difference between the high and low state-anxious groups. However, when the cue was presented for 250 ms, this tendency disappeared for the low state-anxious group. If the attentional hypothesis is correct, this may suggest that there is a general tendency for attention to dwell on threat-related material when that material is presented for a brief period. However, with longer processing time, low-anxious people may tend to disengage more rapidly from the threat stimuli, whereas high state-anxious people tend to maintain their attention in the location of the threat material. This tendency may have important clinical implications, which we will discuss in the General Discussion. Alternatively, if the response-preparation hypothesis is correct, this may suggest that threat-related stimuli disrupt the rapid suppression of a prepared response over a longer time scale for high-anxious individuals.
A potential difficulty with Experiment 2 is that the predicted results emerged from a complex five-way interaction. Although the pattern of results was exactly as we had predicted, it is possible that at least some of the significant interactions were spurious given the relatively large number of factors present in the analysis. Therefore, we considered it wise to attempt to replicate the main results in an experiment with fewer factors. Experiment 3 was designed to further test the hypothesis that threat cues lead to longer RTs on invalid trials for high state-anxious individuals. In this study, all cue stimuli were presented for 250 ms and only normal faces (i.e., no jumbled faces) were presented in the experimental trials.
Method
Participants
Participants were 56 undergraduate students from the University of Essex campus community ranging in age from 18 to 34 years, with a modal age in the 20s. Those scoring at or above a score of 40 (n = 23) on the Spielberger State-Anxiety scale immediately prior to the experiment and those scoring at or below 35 (n = 23) were classified as high and low state-anxious participants, respectively. These cutoffs resulted in the loss of 10 participants. Each person had normal or corrected-to-normal eyesight and participated in one experimental session lasting about 45 min for which they received payment of £4.
Materials and Procedure
The materials and apparatus used were the same as in Experiment 2. The only difference was that no jumbled faces were used in the main experiment and all cue stimuli were presented for 250 ms.
The procedure was also identical to Experiment 2. After completion of the STAI Trait and State-Anxiety scales, the BDI, and the MC Social Desirability scale, participants completed the computerized experiment. As before, the task was to localize the side of the computer screen on which the target circle appeared by pressing the Z key for left and the “/” key for right on a standard computer keyboard. The sequence of events within each trial was as follows: A fixation point (X) was presented at the center of the screen for 1,000 ms. A face cue was then presented in one of the peripheral boxes for 250 ms. The cue was then blanked out, and 50 ms later the target circle was presented in the lower half of either the left or the right box until the participant responded (or until 2,000 ms elasped). This gave a cue-target onset asynchrony of 300 ms. There was an intertrial interval of 1,000 ms before the next trial began.
Each participant completed five blocks of 60 trials. These consisted of one practice block and four experimental blocks. The practice block contained jumbled face cues only while the experimental blocks contained normal faces (neutral, happy, and angry). This resulted in 240 experimental trials: Three fourths (75%) of these trials (180) were valid (i.e., the target appeared in the same spatial location as the cue) and one fourth (60) were invalid (i.e., the target appeared in the opposite spatial location to the cue). Neutral, happy, and angry face cues appeared 60 times each on valid trials and 20 times each on invalid trials. The probability of any particular cue appearing in the left- and right-hand-side boxes was equal. Thus, each type of cue was presented 80 times in the experimental trials: 40 times on the right (30 valid, 10 invalid) and 40 times on the left (30 valid, 10 invalid).
Design
A 2 (anxiety: high and low state-anxiety) × 2 (cue validity: valid and invalid) × 3 (cue valence: neutral, positive, negative) ANOVA factorial design was used. Anxiety was a between-subjects factor, and cue validity and cue valence were within-subjects factors. The main prediction is an Anxiety × Cue Validity × Cue Valence interaction such that cue validity effects (i.e., faster RTs on valid relative to invalid trials) should be larger on angry face cue trials than on either neutral or happy face cue trials. This larger validity effect is expected to be due to slower RTs on invalid angry face cue trials, rather than to faster RTs on valid angry face cue trials. As before, this pattern is expected to be particularly strong for high state-anxious participants.
Results
As shown in Table 4, the high state-anxious group scored significantly higher on measures of trait-anxiety and state-anxiety, and on the BDI. No between group difference was found on the MC scale.
Table 4.
Mean Scores on the STAI Trait and State Anxiety Scales, the Beck Depression Inventory (BDI), and the Marlowe-Crown Social Desirability Scale (MC) for Experiments 3 and 4
| Group |
||||
|---|---|---|---|---|
| Measure | High state-anxious | Low state-anxious | t | df |
| Experiment 3 | ||||
| n | 23 | 23 | ||
| Trait anxiety | 46.5 (7.5) | 35.1(7.2) | 5.2** | 44 |
| BDI | 11.7 (6.4) | 5.1(4.3) | 4.0** | 44 |
| State anxiety (T) | 45.5 (4.8) | 27.7 (4.7) | 12.6** | 44 |
| MC | 13.9 (4.1) | 16.4 (5.2) | 1.8 | 44 |
| Experiment 4 | ||||
| n | 18 | 26 | ||
| Trait anxiety | 50.9 (7.2) | 32.2 (9.9) | 6.9** | 42 |
| State anxiety (T) | 46.1 (5.4) | 27.4 (4.1) | 13.1 ** | 70 |
Note. Standard deviations are in parentheses. STAI = State-Trait Anxiety Inventory; T = test.
P < .001.
The mean correct RT and error data are shown in Table 5. The RT data were subjected to a 2 (anxiety: high and low state-anxiety) × 2 (cue validity: valid and invalid) × 3 (cue valence: neutral, happy, angry) ANOVA with participants as a random factor. There were main effects for cue validity, F(l, 44) = 210.7, MSE = 1,001.9, p < .001, and for cue valence, F(2, 88) = 3.73, MSE = 170.5, p < .028. Of more theoretical importance, there was also a significant Anxiety × Cue Validity × Cue Valence interaction, Pillais F(2, 43) = 5.07, p < .011. In order to break down this interaction, we examined the data for high- and low-anxious groups separately.
Table 5.
Mean Correct Response Times (in Milliseconds) for the Three Types of Cue Face for High and Low State-Anxious Participants in Experiment 3
| Cue face |
|||
|---|---|---|---|
| Group | Neutral | Happy | Angry |
| High anxious | |||
| Valid trials | 317.9 (0.3) | 314.5 (0.3) | 319.6 (0.3) |
| Invalid trials | 368.3 (0.4) | 374.2 (0.3) | 388.3 (0.5) |
| Validity Effect | 50.4 | 59.7 | 68.7 |
| Low anxious | |||
| Valid trials | 319.4 (0.3) | 315.6 (0.3) | 317.9 (0.4) |
| Invalid trials | 371.9 (0.4) | 367.5 (0.4) | 366.4 (0.6) |
| Validity Effect | 52.5 | 51.9 | 48.5 |
Note. Percentage errors are in parentheses.
High State-Anxiety
A 2 (cue validity) × 3 (cue valence) ANOVA revealed the predicted interaction, Pillais F(2, 21) = 5.3, p < .013. Against expectation, further analysis revealed that there was a significant main effect for Cue Valence, F(2, 44) = 4.6, MSE = 34.0, p < .015, on the valid trials. This was due to faster RTs following happy valid cues (315 ms) relative to angry valid cues (320 ms), t(22) = 3.4, p < .003, two-tailed. No other comparisons reached significance. As expected, there was also a significant main effect for cue valence on the invalid trials, Pillais F(2, 21) = 6.3, p < .007, such that RTs following angry faces were slower (388 ms) than RTs following either neutral (368 ms), t(22) = 3.5 p < .001, or happy (374 ms), t(22) = 2.2, p < .02, faces. There was no difference between the neutral and happy trials (368 ms vs. 374 ms). Planned comparisons revealed that the cue validity effect with angry faces (69 ms) was larger than that observed for neutral faces (50 ms), t(22) = 3.0, p < .003, and tended to be larger than for happy faces (60 ms), t(22) = 1.3, p < .09. There also tended to be a difference between the cue validity effect with happy faces (60 ms) relative to neutral faces (50 ms), t(22) = 2.1, p < .051, two-tailed.
Low State-Anxiety
A 2 (cue validity) × 3 (cue valence) ANOVA revealed a main effect for Cue Validity, F(1, 22) = 95.1, MSE = 943.5, p < .001. There was no main effect for cue valence and no Cue Validity × Cue Valence interaction.
Discussion
The results of Experiment 3 replicated the theoretically interesting results of Experiment 2 and supported our hypotheses. To illustrate, high state-anxious people took longer to localize a target on invalid trials after an angry face cue, relative to either a neutral or a happy face cue. This pattern was not found for low state-anxious individuals, supporting the notion that high state-anxiety may be characterized by a delay in disengaging attention from angry faces or a disruption of the inhibition of a prepared response after a threat cue. There was also an unexpected difference on the valid trials for the high state-anxious individuals in this study. These participants were somewhat faster in localizing a target following a valid happy face cue relative to a valid angry face cue. This effect is opposite to what would be expected if anxiety was associated with a faster shift of attentive resources toward angry faces. As this result did not occur in Experiment 2, we are inclined to consider it spurious. Nevertheless, this is an interesting result as it is the first indication that the capture component of attention may be open to influence by higher level variables (cf. Stoltz, 1996). The main result, however, is the replication of the finding that, for anxious participants, the angry face cues slowed down localization of targets in the uncued location (disengage component).
Experiment 4
Experiments 2 and 3 used schematic face stimuli and demonstrated that high state-anxious participants took longer to localize a neutral target if that target followed an invalid face cue carrying an angry emotional expression, relative to either a happy or neutral emotional expression. These findings support our hypothesis that anxiety is associated with longer dwell time and disengagement from angry facial expressions. However, as we noted previously, there is one aspect of our methodology that allows a possible alternative interpretation. In the previous experiments, an informative cue was presented on either the left- or the right-hand side of a computer screen, followed by a target on either the left- or right-hand side. The participant’s task was to press a left key if the target appeared on the left and a right key if the target appeared on the right. This means that the cue validity effect (i.e., faster RTs for targets on the cued side) may have been due to the motor preparation of a response induced by the cue rather than by an allocation of attention to the appropriate side, as we assume. This would mean that the pattern of observed effects might be due to an angry facial expression disrupting a prepared motor response on invalid trials (for anxious participants) rather than the angry face holding attentive processing. This would not necessarily affect our hypothesis as it would still suggest that threat-related stimuli are affecting attentional mechanisms, which in turn disrupt motor preparation on invalid trials. Nevertheless, we would like to confirm that the same results would occur under conditions in which we could more confidently attribute the cue validity effects to attentional factors rather than response-preparation effects. This can be achieved by using a simple detection task in which a single key is pressed anytime a target appears, regardless of target location. This means that the location of the cue cannot prime the correct motor response. A primary aim of Experiment 4 was to replicate the previous results with this new task in order to confirm that the cue validity effects are indeed due to attentional factors.
An additional aim of this experiment was to investigate our hypothesis using photographs of real faces rather than schematic faces. Although there is evidence that results using schematic faces are applicable to real faces (e.g., Yamada, 1993), we wanted to confirm this with the present paradigm. Therefore, photographs of neutral, happy, and angry expressions were selected from the database provided by Ekman and Freisen (1976). An additional methodological modification was made to more directly test the shift component on valid trials. In the previous experiments, the location of the target was slightly displaced from the location of the face cue on valid trials in order to avoid the potential problem of masking of the target by the cue. However, this meant that on valid trials, attention had to shift from the cue location to the target location, albeit by a very small distance. Thus, there may also have been a disengage component operating on valid trials (from the cue to the target) in the previous experiments. To illustrate, it is possible that anxious people did indeed shift attention more rapidly to the location of an angry expression, but then attention also tended to dwell on that location so that no differences were observed between the different types of face cue on valid trials. In other words, the RT data for valid trials may reflect the balance of two opposing processes, which cancel each other out. We would be on stronger grounds to argue that attention did not shift faster toward angry (relative to happy or neutral) expressions if both the cue and the target fell within the putative attentional beam (Posner, 1980). Thus, in the present experiment the target was presented at a location that was at the center of the previous face cue. Thus, no shift was required between the location of the face cue and the target location on valid trials. This experiment therefore provides a stronger test of whether differently valenced faces differ in their ability to draw visual attention to themselves.
Method
Participants
Participants were 45 undergraduate students from the University of Essex campus community, ranging in age from 18 to 42 years, with a modal age in the 20s. Those scoring at or above a score of 40 (n = 18) on the Spielberger State-Anxiety scale immediately prior to the experiment and those scoring at or below 35 (n = 26) were classified as high and low state-anxious participants, respectively. These cutoffs resulted in the loss of 1 participant. Each person had normal or corrected-to-normal eyesight and participated in one experimental session lasting about 45min.
Materials and Procedure
The face stimuli consisted of photographs of three different individuals selected from the set provided by Ekman and Freisen (1976). There were three different photographs of each of the three individuals (J.B., P.E., and E.M.; Ekman & Freisen, 1976), with one portraying a neutral expression, one portraying a happy expression, and one portraying an angry expression. These faces were all reliably categorized as neutral, happy, and angry according to data presented by Ekman and Freisen, and this was confirmed by our own rating in which 15 people chose one of the following labels for each of the three faces: sad, happy, surprised, angry, disgusted, or neutral. Each of the photographs was 5.5 cm in height and 4.0 cm wide on the computer screen. The target that participants had to detect was a black circle with a diameter of 0.3 cm. The face stimuli were used as cues in the experiment. The center of the cue (photograph) and target (circle) stimuli were presented 5 cm to the left or right of a central fixation point (cross shape). All of the stimuli were presented on a Macintosh Power PC, and all stimulus presentation and data collection were controlled by PsyScope software (Cohen, MacWhinney, Flatt, & Provost, 1993).
On arrival at the laboratory, each participant completed the STAI Trait and State-Anxiety scales. On completion of these questionnaires, participants were asked to move to a computer in the same room for the reaction time experiment, where they were seated about 50 cm from the computer screen. The participant’s task was to press a central key on a button box if they detected the target circle on either the right- or the left-hand side of the computer screen. They withheld a response on catch trials in which no target appeared. The cue display consisted of a photograph of one of the faces being presented either on the left- or right-hand side of a central fixation point. The center of the target face was 5 cm from the fixation point. On target trials, the circle later appeared 5 cm to the left or the right of the fixation point. On nontarget catch trials, only the fixation point was on the screen. The sequence of events within each trial was as follows: A fixation point “+” was presented at the center of the screen for 1,000 ms. A cue photograph was then presented to the left or right of fixation for 250ms. The cue was then blanked out and, after 50 ms, on target trials the target circle was immediately presented either on the left or right of fixation. The target remained on the screen until the participant responded (or until 2,000 ms had elapsed). This gave a cue-target asynchrony of 300ms. There was an intertrial ms. interval of 1,000 ms before the next trial began.
Each participant completed a short practice block of 10 trials containing 6 valid trials, 2 invalid trials, and 2 catch trials. After the practice trials, each participant completed 450 experimental trials and they could take a short break after every 90 trials if they wished. Of the experimental trials, 60% were valid (i.e., the target appeared in the same spatial location as the cue), 20% (90 trials) were invalid (i.e., the target appeared in the opposite spatial location to the cue), and 20% (90 trials) were catch trials (i.e., no target appeared after the cue display). Taken together, 150 of the experimental trials consisted of angry face cues (90 valid, 30 invalid, and 30 catch trials), 150 consisted of happy face cues (90 valid, 30 invalid, and 30 catch trials), and 150 consisted of neutral face cues (90 valid, 30 invalid, and 30 catch trials). The probability of any particular cue appearing in the left- and right-hand-side boxes was equal. In total, there were nine different faces presented as cues (3 angry, 3 happy, and 3 neutral). Each of these faces was presented 50 times in the experimental trials, and each face had an equal probability of being followed by a valid, invalid, or catch trial.
Design
A 2 (anxiety: high and low state-anxiety) × 2 (cue validity: valid and invalid) × 3 (cue valence: neutral, happy, angry) ANOVA factorial design was used. Anxiety was a between-subjects factor, and cue validity and cue valence were within-subjects factors. The main prediction is an Anxiety × Cue Validity × Cue Valence interaction, such that cue validity effects (i.e., faster RTs on valid relative to invalid trials) should be larger on angry face cue trials than on either neutral or happy face cue trials. This larger validity effect is expected to be due to slower RTs on invalid angry face cue trials rather than to faster RTs on valid angry face cue trials. As before, this pattern is expected to be particularly strong for high state-anxious participants. In addition, if there is a difference in the shift component of attention, we would expect faster RTs on valid trials following angry face cues relative to either happy or neutral face cues. The present experiment provides a stronger test of this hypothesis because the cue and target appeared in the same spatial location on valid trials.
Results
As shown in Table 4, the high state-anxious group scored significantly higher on measures of trait-anxiety and state-anxiety.
Anticipatory responses (i.e., responding on catch trials) occurred on 2.5% of the catch trials, indicating a relatively low error rate. The errors on target present trials (i.e., not responding) were less than 1 %. The mean false-alarm rates (i.e., anticipatory responses on catch trials) are presented in Table 6. A 2 (anxiety: high and low state-anxiety) × 3 (cue valence: neutral, happy, angry) ANOVA showed a tendency for high state-anxious participants to produce more false alarms (M = 3%) than low state-anxious participants (M = 2%), F(l, 39) = 3.0, MSE = 24.6, p < .09.1 However, the false-alarm rate did not differ across type of cue, and there was no Anxiety × Cue Valence interaction. The mean correct RT data for the target trials are shown in Table 6. These data were subjected to a 2 (anxiety: high and low state-anxiety) × 2 (cue validity: valid and invalid) × 3 (cue valence: neutral, happy, angry) ANOVA, with Participants as a random factor. There were main effects for cue validity, F(1, 42) = 157.3, MSE = 766.2 p < .001, and for cue valence, F(2, 84) = 3.5, MSE = 230.1, p < .036. Of more theoretical importance, there was also a significant Anxiety × Cue Validity × Cue Valence interaction, Pillais F(2, 41) = 6.5, p < .004. In order to break down this interaction we examined the data for high- and low-anxious groups separately.
Table 6.
Mean Correct Response Times (in Milliseconds) for the Three Types of Cue Face for High and Low State-Anxious Participants in Experiment 4
| Cue face |
|||
|---|---|---|---|
| Group | Neutral | Happy | Angry |
| High anxious | |||
| Valid trials | 308.1 (40.3) | 308.6 (42.3) | 308.2 (41.6) |
| Invalid trials | 350.1 (51.7) | 342.7 (46.9) | 371.4 (61.8) |
| Validity effect | 42.0 | 34.1 | 63.2 |
| False alarrn (%) | 3.3 | 2.4 | 3.3 |
| Low anxious | |||
| Valid trials | 301.7 (28.7) | 303.4 (27.5) | 303.3 (27.3) |
| Invalid trials | 344.4 (37.8) | 345.4 (36.2) | 340.1 (35.4) |
| Validity effect | 42.7 | 42.0 | 36.8 |
| False alarm (%) | 2.4 | 1.6 | 1.6 |
Note. Standard deviations are in parentheses.
High State-Anxiety
A 2 (cue validity) × 3 (cue valence) ANOVA revealed a main effect for cue validity, F(l, 17) = 102.6, MSE = 568.1, p < .001, and for cue valence, Pillais F(2, 16) = 3.6, p < .045. Of more importance, the predicted Cue Validity × Cue Valence interaction was marginally significant, Pillais F(2, 16) = 3.4, p < .054. Further analysis revealed that there was no main effect for cue valence on the valid trials, F(2, 34) < 1. As expected, there was a significant main effect for cue valence on the invalid trials, Pillais F(2, 16) = 4.0, p < .04, such that RTs following angry faces were slower (371 ms) than RTs following either neutral (350 ms), t(17) = 2.7, p < .007, or happy (343 ms), t(17) = 2.7, p < .007, faces. There was no difference between the neutral and happy trials (350 ms vs. 343 ms). Planned comparisons revealed that the cue validity effect with angry faces (63 ms) was larger than that observed for neutral faces (42 ms), t(l7) = 2.5, p < .011, or for happy faces (34 ms), t(17) = 2.6, p < .01. There was no difference between the cue validity effect with happy faces (34 ms) relative to neutral (42 ms) faces.
Low State-Anxiety
A 2 (cue validity) × 3 (cue valence) ANOVA revealed a main effect for cue validity, F(1, 25) = 70.8, MSE = 900.9, p < .001. There was no main effect for cue valence and no Cue Validity × Cue Valence interaction.
Discussion
Experiment 4 successfully replicated the theoretically interesting results of the previous experiments. Once again, there was a reliable Cue Validity × Cue Valence interaction for high state-anxious participants, such that time to detect a target on invalid trials took longer after an angry face cue, relative to either a happy or a neutral face cue. There are a number of points to make about these results. First, the results demonstrate that the cue validity effect was due to attentional factors and not to response preparation that might have occurred in Experiments 1-3. It is important to note that the overall difference between valid and invalid trials did not vary too much between the three experiments using face cues: Experiment 2, + 40 ms; Experiment 3, + 55 ms; and Experiment 4, + 43 ms. This suggests that the cue validity effects in all experiments are probably driven by attentional rather than by response-preparation factors. We can be certain of this in Experiment 4 because a single response was required regardless of whether the target appeared on the left- or right-hand side of the computer screen.
The current results are also important in demonstrating our predicted pattern of results when using photographs of real faces as cues, in contrast to the schematic faces used in the previous experiments. This result confirms previous findings that the use of schematic faces can be used as an analogue for real faces (Yamada, 1993). A final important aspect of the present study is that the absence of any valence effects on valid trials has been confirmed. As we pointed out in the introduction to Experiment 4, it was possible that the previous studies may have involved a disengage component on the valid trials as the location of the cue face and the target was slightly different. In Experiment 4, however, the target appeared in the middle of where the cue face had appeared in valid trials (i.e., within the “attentional beam”), and therefore no disengage or further shifting of attention would be required to detect the target. Under these conditions there was still no evidence of any variation of RTs on valid trials for either high or low state-anxious participants. Thus, the current results provide more convincing evidence that the presentation of an angry face does not induce a faster shift of attention to itself relative to happy or neutral faces (at least under the parameters tested in this experiment).
To summarize, Experiment 1 used word stimuli and found a Cue Validity × Cue Valence interaction such that people took longer to respond to targets on invalid trials after threat-related, relative to neutral or positive, word cues. However, this pattern of results did not interact with state-anxiety group. One possibility is that there is a general tendency for everyone to process threatening stimuli more deeply (cf. Pratto & John, 1991), leading to a slowness of disengagement. lt may also be the case that our failure to increase state-anxiety above baseline levels may have masked any effects that might have emerged in Experiment 1.
Experiments 2 and 3 used schematic faces representing neutral, happy, and angry expressions, rather than words as in Experiment 1. Using these schematic face stimuli, the predicted State Anxiety × Cue Validity × Cue Valence interaction was found. High state-anxious people took longer to localize a neutral target (circle) in an uncued location after an angry face cue relative to either a neutral or happy face cue. This pattern was not observed when the features of the neutral, happy, and angry faces were jumbled (Experiment 2), or for low state-anxious people (Experiments 2 and 3). It is worth noting, however, that an anxiety-related difference was not found when the cue face was presented for just 100 ms (Experiment 2), but did emerge when the cue was presented for 250 ms. This suggests that the failure to find a difference between state-anxiety groups in Experiment 1 may have been due to a short presentation time (100 ms). Alternatively, it may simply be a difference between the type of stimuli (words vs. faces) used in Experiment 1 and Experiments 2-4. It is also important to note that localization of a target in a cued location was never speeded by either threat-related words (Experiment 1) or faces (Experiments 2 and 3) in our experiments. Thus, it seems that threatening stimuli do not influence the response to targets occurring in the same location, whereas they do slow down responses to targets appearing in another location. As we noted previously, however, it is probably unrealistic to expect threat stimuli to further speed up detection of targets on valid trials, as RTs are already very rapid. Thus, we do not wish to draw any strong conclusions regarding the shift component of attention from these results. However, the results are consistent with the hypothesis that there is a delay in disengaging attention from threat stimuli in anxious participants. Again we note that the results of Experiments 1-3 may be attributed to response preparation rather than attentional effects, as the task was to localize the target so that the cue was predictive of the correct response. Even if this was the case, however, we argue that the demonstration that the valence of the cueing stimulus can disrupt performance on invalid trials is still of interest.
Experiment 4 presented a similar task using photographs of real (neutral, happy, and angry) faces with the important modification that participants pressed a single central button when a target was detected. This change circumvented any possibility that the cue validity effects may have been due to response preparation processes rather than to attentional cueing processes. Under these conditions, a strong cue validity effect (faster RTs on valid trials) was once again observed and this interacted with the type of face cue presented for those with high levels of state-anxiety. As in the previous experiments. RTs for this group were slowed on invalid trials after an angry facial expression. Furthermore, the presence of an angry facial expression did not lead to faster detection of targets appearing in exactly the same spatial location on valid trials.
This pattern of results supports the hypothesis that threat-related stimuli affect the disengage component of visual attention. Once again, these results are in line with evidence indicating that the shift component of visual spatial attention may be immune to higher level influences, whereas the disengage component interacts with higher cognitive variables (cf. Stoltz, 1996). An important function of anxiety is undoubtedly to facilitate the identification of danger in the environment. Much previous research has assumed that attentional biases in anxiety are characterized by an increased detection of threat or orienting of attention toward a threat location (e.g., Eysenck, 1992; Fox, 1993; MacLeod & Mathews, 1988; Mogg et al, 1994). However, we suggest that attentional orienting may be immune to the meaning or valence of stimuli appearing in the visual environment. The results of our first four experiments suggest that processes involved in the disengagement from threat distinguish high and low state-anxious people. Threatening stimuli that appear in unattended locations do not attract visual attention any more than neutral stimuli (Fox, 1994; White, 1996), but once detected, they are processed more deeply and take longer to disengage from than neutral stimuli.
The final experiment of this article was designed to confirm that mechanisms of disengagement (rather than shifting toward threat) are what underlie attentional biases in anxiety. Experiment 5 investigated disengagement more directly by presenting neutral, positive, and threat-related words at fixation and requiring participants to name a target that appeared randomly in one of four peripheral locations. The prediction was that response to targets would be slower when threat words were presented at fixation, especially for high state-anxious individuals.
Experiment 5
The aim of Experiment 5 was to investigate more directly the disengagement of visual attention from threat-related, positive, and neutral words. We returned to the use of word stimuli for this experiment so that we could use a wider range of different exemplars from each category. This was considered necessary to establish the generality of the effect. Moreover, much of the literature that led us to the disengage hypothesis in the first place (e.g., Stroop and dot-probe effects) used word stimuli. Thus, we wanted to demonstrate a clear difference in disengaging from threat between high- and low-anxious individuals using word stimuli. Recall that in our first experiment we used word stimuli in a cueing paradigm and found no differences between high and low state-anxious groups. Experiment 5 uses a different paradigm to more directly assess the disengagement of visual attention from word stimuli. Words with a neutral, positive, or threat-related valence are presented singly at fixation. The participants’ task is to fixate on a word and then name a target letter that appears randomly either above, below, left, or right of the fixated word. The prediction was straightforward: High state-anxious people should take longer to respond to the target when the fixated word is threat-related than when it is neutral or positive. This paradigm should allow us to distinguish between the two alternative processes that could produce interference in the Stroop task. As discussed in the introduction, Stroop-like interference might be produced by anxious people rapidly orienting to the threat content of the word and away from the color-naming task (i.e., indicating a shift of attention to threat content). Alternatively, Stroop-like interference might reflect the tendency of high-anxious people to dwell on threat-related material. As should be clear by now, our interpretation of the Stroop effect to threat-related words is that high-anxious people are slow to disengage from the threat content of the word, and therefore Stroop interference reflects an increased dwell time on threat-related words. In the Stroop paradigm, it is impossible to distinguish this mechanism from the automatic drawing of attention by negative words. However, if the disengage hypothesis is correct, then in the present experiment we should find that disengagement from negative words will be relatively slow, so that RTs will be longer on negative relative to positive or neutral word trials. This pattern is not expected to occur in the low state-anxious group.
Method
Participants
Participants were 80 students and staff from the University of Essex campus community ranging in age from 17 to 60 years, with a modal age in the 20s. All of the participants were native English speakers. Those scoring above 40 (n = 36) on the Spielberger State-Anxiety scale immediately prior to the experiment and those scoring below 35 (n = 36) were classified as high and low state-anxious participants, respectively. The data from 8 participants were not included in the analysis because their state-anxiety scores fell between 36 and 39. Each person had normal or corrected-to-normal eyesight and participated in one experimental session of about 25 min, for which they received payment of £2 or course credit.
Materials and Apparatus
In all, 9 neutral, 9 positive, and 9 threat words of three to five characters in length were selected from the database of words used in Experiment 1. The three categories of words were matched for word frequency and familiarity. On the basis of the original ratings of these words conducted as a pilot for Experiment 1, the emotionality scores of the neutral words (2.3) were significantly lower than the emotionality ratings for positive (5.3) and threat-related (5.7) words, which did not differ from each other. Also, the threat words were rated as significantly more threatening (6.4) than either the neutral (1.3) or the positive (1.4) words (all p values were less than .05). A further 9 neutral words were selected for use in the practice trials. All of the participants completed a battery of questionnaires consisting of the STAI anxiety scales, the BDI, and the MC inventory.
The computer apparatus was the same as in Experiments 1-3. The computer’s 28-cm color monitor was housed inside a light-proof purpose-built hood with the screen approximately 65 cm from the participant’s eyes. As before, the monitor was operated in the standard 640 × 480 pixel configuration, and the standard MEL system 72-point font with characters 0.5 cm high was used for presentation of the stimuli. The verbal response of the participant was measured using a head-mounted microphone attached to the voice-key port of a MEL serial response box. The participants response (S or X or invalid response) was entered into the computer by the experimenter via the keyboard so that accuracy could later be calculated.
Procedure
On arrival at the laboratory, participants were seated in a small cubicle containing a computer and the nature of the task was explained to them. They were told that they would see a small box on the screen, in which would be presented an asterisk. It was explained that the asterisk would be replaced by a word, which they should try to remember for later. They were informed that shortly after the word was presented, a letter (S or X) would be presented briefly either above, below, to the left, or to the right of the word. They were instructed to name the letter as accurately and as quickly as possible. Throughout the experiment, a dark gray box of 1-mm line thickness, 1.5-cm height, and 2.0-cm length was displayed continuously in the center of the computer screen. At the start of each trial, an asterisk (*) was displayed in the middle of the box for 1,000 ms. One of the word stimuli was then displayed in the box, and after 600 ms a target stimulus (either S or X) was presented for 50 ms at one of four locations, either 3.5 cm to the right, to the left, above, or below the centrally presented word. This word remained at fixation until the participant responded or until 2,000 ms had elasped. The experimenter entered the participant’s response as quickly as possible after the response was made. There was an intertrial interval of 500 ms.
Each participant completed a practice block of 54 trials, followed by four blocks of experimental trials, each consisting of 54 trials. This gave a total of 216 experimental trials, which were divided equally into trials with targets appearing above (54), below (54), to the left (54), and to the right (54) of the central box. For each target location, the centrally fixated word was equally often from one of the three categories: neutral (18), positive (18), and threat-related (18). Each of the individual words was presented twice in each block and eight times during the entire experiment.
After the computer task, participants were directed into a well-lit testing area and asked to fill in the questionnaire booklet. When they completed the four questionnaires (STAI state- and trait-anxiety, BDI, MC), they were asked to write down as many of the words as they could remember from the computer experiment. These memory data are not directly relevant to the current article and will not be mentioned further.
Design
A 2 (anxiety: high and low state-anxiety) x 3 (word valence: neutral, positive, threat-related) ANOVA factorial design was used for the RT analysis. Anxiety was a between-subjects factor, and word valence was a within-subjects factor. The prediction is that target identification times should be longer on threat-word trials than on neutral- or positive-word trials. This effect should be particularly strong for high state-anxious participants.
Results
As shown in Table 7, high state-anxious participants scored higher levels of trait-anxiety, state-anxiety, and BDI scores than did low state-anxious people. Scores on the MC scale were comparable between the anxiety groups.
Table 7.
Mean Scores on the STAI Trait and State Anxiety Scales, the Beck Depression Inventory (BDI), and the Marlowe-Crown Social Desirability Scale (MC) for Experiment 5
| Group |
|||
|---|---|---|---|
| Measure | High state-anxious | Low state-anxious | t(70) |
| n | 36 | 36 | |
| Trait anxiety | 49.9 (9.1) | 35.4 (7.1) | 7.5** |
| BDI | 12.7 (8.8) | 4.0 (3.4) | 5.5** |
| State anxiety (T) | 48.5 (7.0) | 29.8 (4.3) | 13.6** |
| MC | 11.8 (5.1) | 13.8 (6.6) | <1.4 |
Note. Standard deviations are in parentheses. STAI = State-Trait Anxiety Inventory; T = test.
p < .001.
Response Times
The mean correct RTs and error rates for each group are shown in Table 8. The RT data were subjected to a 2 (anxiety: high and low state-anxiety) × 3 (word valence: neutral, positive, threat-related) ANOVA. The results showed a main effect for word valence, F(2, 140) = 7.3, MSE = 257.8, p < .001. The Anxiety × Word Valence interaction was also significant, F(2, 140) = 3.9, MSE = 257.8, p < .024. Further analysis revealed that there was a main effect of word valence only for the high state-anxious group, F(2, 70) = 8.0, MSE = 353.2, p < .001, and not for the low state-anxious group, F(2, 70) < l. Planned comparisons for the high state-anxious participants revealed that RTs on threat word trials (594 ms) were slower than RTs on either positive (577 ms), t(35) 3.6, p < .001, or neutral (583 ms), t(35) 2.6, p < .013, words. There was no difference in RT between the positive and neutral words.
Table 8.
Mean Correct Response Times (in Milliseconds) for the Three Types of Words Presented at Fixation for High and Low State-Anxious Participants in Experiment 5
| Word type |
|||
|---|---|---|---|
| Group | Neutral | Positive | Threat |
| High anxious | 582.6 (1.4) | 576.9 (0.9) | 594.2 (1.1) |
| Low anxious | 596.9 (0.7) | 595.6 (1.0) | 598.4 (0.7) |
Note. Percentage errors are in parentheses.
Discussion
The results of Experiment 5 supported the main hypothesis. High state-anxious individuals took longer to name a peripheral target when they were fixating on a threat-related word relative to either a neutral or a positive word. This pattern was not found for low state-anxious people. These results provide further support for the hypothesis that differences in the disengage component of visual attention are what distinguish high and low state-anxious individuals. Thus, in our first four experiments we had a measure of the shifting of attention toward the location of threat as well as the disengaging of attention from a location containing threat. In all cases, there was no evidence that anxious people shifted their attentive processing toward a threat location faster than to a neutral location. However, there was evidence that, once they had detected threat, they then took longer to disengage from the threat stimuli, relative to either positive or neutral stimuli. In Experiment 5, we examined the disengagement of attention from threat words more directly and found a clear difference between high and low state-anxious participants.
General Discussion
Across five experiments, consistent results were found in support of the hypothesis that the presence of threat-related stimuli affects the disengage component of visual attention. For word stimuli, it was found that threat-related words slowed down RTs to targets on invalid trials relative to positively valenced or neutral words (Experiment 1). Thus, the presentation of a threat-related word seemed to increase attentional dwell time at that location, thereby disrupting localization of a target appearing in another location. However, this pattern was equally apparent for both high and low state-anxious participants. In Experiment 5, however, when participants were required to actively fixate on centrally located words and then categorize a peripheral target, a difference between anxiety groups was found. When the fixated word was threat-related, high state-anxious people took longer to respond to a target relative to when the fixated word was either positive or neutral. Thus, in a direct examination of disengagement from words with different valences, the predicted result was found, with high anxious people showing a slower disengagement from threat-related words relative to low state-anxious people. The words were presented for 600 ms in Experiment 5, compared with just 100 ms in Experiment 1, which suggests that a longer presentation time may be important for an anxiety-related effect to become apparent.
In two experiments with schematic facial expressions as cues (Experiments 2 and 3), a clear effect of valence on the localization of targets on invalid trials was also observed that was associated with the level of state-anxiety. In both of these experiments, high state-anxious participants took longer to localize a target on invalid trials after an angry expression cue, relative to either a happy or a neutral expression face cue. The results of these two experiments support the notion that increased state-anxiety increases the attentional dwell time on threat-related stimuli. As noted previously, the pattern of results observed in Experiments 2-3 may have been due to the angry facial expression disrupting the suppression of a prepared motor response to the cue display. The attentional hypothesis was supported directly, however, by the results of Experiment 4, in which photographs of real faces were presented as cues and participants pressed a single central button whenever they detected a neutral target. Once again, a clear effect of valence was found on the invalid trials such that high state-anxious participants took longer to detect a target on invalid trials after an angry cue. This result can be more confidently attributed to a delayed disengagement from the location of threat stimuli for high state-anxious people. The results of Experiment 4, which used photographs of real faces, were very similar to the results of Experiment 3, which used schematic faces. This adds to the growing evidence that the use of schematic faces with different emotional expressions can be a useful analogue for real faces (e.g., Yamada, 1993). It seems that the same underlying cognitive processes are activated when processing real or schematic facial expressions. An interesting research endeavor is to determine the particular features of threatening facial expressions that might be particularly effective in activating the fear detection system (see Fox et al., 2000; Lundqvist et al., 1999).
The present results are consistent with the notion that humans are biologically prepared to analyze facial expressions of emotion, especially anger (Esteves et al., 1994). The presence of even masked facial expressions of anger can activate the fear-detection system as shown by psychophysiological measures (e.g., Esteves et al., 1994; LeDoux, 1996), and it is this system that we assume to be particularly sensitive to increases in state-anxiety. The interesting point about our results is that the interface between the attentional and affective systems appears to be in the disengage component of visual attention rather than a shift component. Once again this is consistent with recent evidence that the disengage component of visual-spatial attention can be influenced by the semantic meaning of sudden-onset word cues (Stoltz, 1996). The present results are also consistent with evidence that differences between anxious and nonanxious individuals in terms of selectively attending to threat-related material occurs only when the threat-related material is actually attended (Fox, 1994; Fox et al., 2000).
To conclude, the current results suggest that the presence of threat-related stimuli (words or faces) influences the disengage component of visual attention in high state-anxious people. In a recent study, Hermans, Vansteenwegen, and Eelen (1999) used eye-movement registration and found that spider-phobic participants initially oriented toward pictures of spiders relative to flowers. This pattern was observed for stimulus presentation durations of up to 500 ms. However, as exposure to the stimulus continued beyond 500 ms, there was a strong tendency for spider phobics to shift their gaze away from the spider-related pictures. This pattern was not observed in a control group and suggests that phobic individuals rapidly disengage from threat-related stimuli after about 500 ms. On first inspection, these results would seem to be in conflict with our proposal that anxious individuals are slower to disengage from threatening stimuli. However, the stimulus durations in the present experiments were generally less than 300 ms (exception was Experiment 5). This would seem to indicate that the initial increased dwell time observed in high state-anxious individuals may give way to a selective avoidance of the same stimuli at longer durations. This hypothesis may provide the basis for future research.
The use of eye-movement indexes in assessing attentional bias in anxiety is an important development in this area, and future research should be able to confirm whether there are clear differences in the moving of the eyes toward or away from threat stimuli (see also Bradley et al., 1998). In the meantime, we note that attentional shifts can be quite independent of eye movements (e.g., Posner, 1978), and even if anxious people move their eyes faster toward angry faces than low-anxious individuals, this does not necessarily refute the hypothesis that the main difference between these groups occurs in attentional dwell time and disengagement from threat. Research is needed to clarify these issues. It should also be noted that we did not measure eye movements in our experiments. It is possible that participants might sometimes shift their gaze toward the cue location so that the increased RT on invalid trials after threat cues might reflect increased dwelling of the oculomotor system rather than attentional dwell time. We consider that this is unlikely. First, eye movements toward a cue location with a cue-target asynchrony of 300 ms generally occur on less that 5% of trials (Mogg, personal communication, May 1999). If eye movements were occurring on a high percentage of trials in our experiments, we would expect increased error rates. In fact, the error rates were very low in all experiments. Second, the pattern of results that occurred in Experiment 5 showing increased dwell time on fixated threat stimuli was consistent with the pattern observed on the invalid trials in the other experiments. Because no eye movement was required toward the threat (or neutral) stimulus in Experiment 5 (because it was already fixated), the results can be attributed to attentional factors. The similar pattern of results in both paradigms seems more parsimoniously explained by attentional factors underlying both situations. Nevertheless, we acknowledge the possibility that eye movements may have occurred on some of the trials in our cueing experiments, and this is an issue we intend to examine in our future experiments.
Initially, we intended to investigate the shift component of attention on the valid trials in the cueing paradigm. We do acknowledge, however, that this may not provide a fair test of the shift component of attention. In our research, a sudden-onset peripheral cue appeared that could be neutral, positive, or threat-related. It is well-known that sudden-onset stimuli tend to rapidly attract visual attentive processing (e.g., Yantis, 1996), and it might be too much to expect that the threat value of the cue would further speed the orienting of attention. A better methodology would be to vary the time between the presentation of a cue and the onset of the target stimulus (e.g., Christie & Klein, 1995; Remington & Pierce, 1984). By measuring cue validity effects as a function of the cue-target temporal separation, the movement of attentional shifts across space can be measured. We are using this strategy in other experiments currently taking place in our laboratory, and the results of these experiments will allow us to better assess whether threat-related stimuli affect the shift component of visual attention. However, given the growing evidence that the shift component of attention may be encapsulated (Stolz, 1996; present Experiments 1-4), we are not convinced that threat stimuli will have an advantage over other stimuli in attracting visual-spatial attention. We also agree with Bradley and his colleagues (Bradley et al., 1998) that the degree of attentional bias found may depend on the particular levels of state- (or trait-) anxiety observed during testing. For example, a selective bias for threat may emerge only at relatively high levels of state-anxiety. In particular, it is possible that differences in both the shift and the disengage component of visual attention when threat stimuli are presented may occur for clinically anxious people. We are currently conducting similar experiments to those reported here with patients with generalized anxiety disorder to test this speculation. If such a result were found, it would have important implications for the understanding of exogenous orienting in that it would suggest that the capture mechanism might not be encapsulated. More detailed research using different methodologies is needed to more directly assess the shift component of attention in relation to anxiety. On the basis of our analysis of the literature and the current pattern of results, we conclude that for subclinical anxiety the main distinction between high- and low-anxious people occurs in the disengagement of attention from threat-related stimuli.
Functional Consequence of a Failure to Disengage Attention From Threat
Our results indicate that a key feature of anxiety may be the inability to rapidly disengage from threat-related stimuli. This attentional bias is likely to maintain cognitive resources on the sources of stress (i.e., threat stimuli) and in turn may serve to maintain and enhance anxiety states. In contrast, those who can rapidly disengage from threat-related stimuli may not suffer increased anxiety states. Thus, rapid disengagement from threat may be functional in keeping anxiety low, and an inability to do this may result in increased anxiety. We suggest the following proposal as a tentative model of the attentional mechanisms underlying anxiety (see also, Fox et al., 2000). The suggestion is that the appearance of a new visual object in a scene automatically draws visual attentive processes (e.g., Yantis, 1996). Our research suggests that this initial orienting is an encapsulated process unaffected by the meaning or valence of the new object. However, once the new object has been localized, a second step involves the prioritization of stimuli in that location for further processing. At this point, the attentional system selects relevant stimuli for further processing. The increased dwell time for threat-related stimuli would facilitate the identification and evaluation of the implied threat, and this mechanism may be what is biased in anxious individuals. There is some neurophysiological evidence for such a view. The visual pathway that subserves attentional shifts involves large, rapidly conducting cells from the retina to the superior colliculus and then on to the pulvinar in the thalamus (see Armony & LeDoux, 2000; Morris, Ohman, & Dolan, 1999). Although it has been found that this pathway is sensitive to masked threatening faces (Morris et al., 1999), it does not code for color and is primarily sensitive to contrasts. Thus, it may work rapidly to get attentive processes to focus on new objects on the basis of simple physical information and then further processing involving stimulus identification and evaluation occurs. Although the relative delay in identification processes does not seem particularly adaptive, it should be pointed out that anxiety itself is not functional. Indeed, it might be the very tendency to dwell on threat-related stimuli that leads to feelings of anxiety and rumination on the negative aspects of life. Although obviously speculative, this short-term increase in dwell time on threat stimuli may flow through the cognitive system, escalating into constant rumination and worry. Rumination and worry, of course, are key features of clinical anxiety disorders (Mathews, 1990).
An alternative and somewhat speculative interpretation of our results is that they may reflect a subtle cognitive form of freezing. Animal research has shown that behavioral freezing is “a fairly universal initial response to detection of danger throughout the animal kingdom” (LeDoux, 1996, p. 176). With regard to natural fear-relevant triggers, LeDoux (1996) has conceptualized the freezing response as an evolutionary gift: Faced by a predator, the excessive weighing-up of options or superfluous movement may both be tantamount to disaster. As a result, freezing is a kind of evolutionary safety catch designed to increase the chances of survival in threatening situations. We propose that the prolonged disengagement from threatening stimuli we have observed in anxious individuals may represent a subtle cognitive form of the freezing response found in animals. There is some evidence for this, in that many studies have demonstrated the important role of the amygdala as a mediator of freezing behavior in animals (Fanselow, 1994). The amygdala has, of course, been found to play a pivotal role in the mediation of fear reactions in humans (Armony & LeDoux, 2000; Morris et al., 1998, 1999). Thus, we tentatively propose that the freezing response may survive in humans at a subtle level, and this may account for delayed responses on tasks involving fear-relevant threat-related stimuli. Further research is required to investigate this hypothesis.
Conclusion
Our experiments have shown that, once detected, threat-related stimuli are more difficult to disengage from for those with high levels of state-anxiety. Although we acknowledge that we have not discounted the hypothesis that anxiety is associated with increased orienting of attention toward threat-related objects, we have provided strong evidence that threat-related objects do increase attentional dwell time for anxious individuals. This dwelling of attention on threatening stimuli may be an important factor in the maintenance of anxiety states. On a more general level, our results suggest that it is not only semantic features but also the affective features of visual objects that can affect the disengage component of attention.
Footnotes
The research reported here was supported by Grant 045800/Z/95/Z from the Wellcome Trust. The authors would like to thank Arne Ohman and Ray Klein for their helpful comments on an earlier version of this article.
Unfortunately, we were unable to locate the raw false-alarm data for 3 participants, and thus the analysis is reported for 41 participants (17 high state-anxious and 24 low state-anxious).
References
- Aristotle, Lawson-Tancred H. The art of rhetoric. London: Penguin Classics; 1991. [Google Scholar]
- Armony JL, LeDoux JE. How danger is encoded: Towards a systems, cellular, and computational understanding of cognitive-emotional interactions in fear. In: Gazzaniga MS, editor. The new cognitive neurosciences. 2nd ed. Boston: MIT Press; 2000. pp. 1067–1079. [Google Scholar]
- Aronoff J, Barclay AM, Stevenson LA. The recognition of threatening facial stimuli. Journal of Personality and Social Psychology. 1988;54:647–655. doi: 10.1037//0022-3514.54.4.647. [DOI] [PubMed] [Google Scholar]
- Beck AT. Cognitive therapy and the emotional disorders. New York: International Universities Press; 1976. [Google Scholar]
- Beck AT, Ward CH, Mendelson M, Mock J, Erbaugh J. An inventory for measuring depression. Archives of General Psychiatry. 1961;4:561–571. doi: 10.1001/archpsyc.1961.01710120031004. [DOI] [PubMed] [Google Scholar]
- Bradley B, Mogg K, Falla SJ, Hamilton LR. Attentional bias for threatening facial expressions in anxiety: Manipulation of stimulus duration. Cognition and Emotion. 1998;12:737–753. [Google Scholar]
- Bradley B, Mogg K, Lee S. Attentional biases for negative information in induced and naturally occuring dysphoria. Behaviour Research and Therapy. 1997;35:911–927. doi: 10.1016/s0005-7967(97)00053-3. [DOI] [PubMed] [Google Scholar]
- Bradley B, Mogg K, Millar N, White J. Selective processing of negative information: Effects of clinical anxiety, concur-rent depression, and awareness. Journal of Abnormal Psychology. 1995;104:532–536. doi: 10.1037//0021-843x.104.3.532. [DOI] [PubMed] [Google Scholar]
- Brewin CR. Cognitive foundations of clinical psychology. Hove, England: Erlbaum; 1988. [Google Scholar]
- Briand K, Klein RM. Is Posner’s "beam" the same as Treisman’s "glue"? On the relationship between visual orienting and feature integration theory. Journal of Experimental Psychology: Human Perception and Performance. 1987;13:228–241. doi: 10.1037//0096-1523.13.2.228. [DOI] [PubMed] [Google Scholar]
- Broadbent D, Broadbent M. Anxiety and attentional bias: State and trait. Cognition and Emotion. 1988;2:165–183. [Google Scholar]
- Christie J, Klein R. Familiarity and attention: Does what we know affect what we notice? Memory and Cognition. 1995;23:547–550. doi: 10.3758/bf03197256. [DOI] [PubMed] [Google Scholar]
- Cohen JD, MacWhinney B, Flatt M, Provost J. PsyScope: A new graphic interactive environment for designing psychology experiments. Behavioral Research Methods, Instruments, and Computers. 1993;25:257–271. [Google Scholar]
- Crowne DP, Marlowe D. Studies in evaluative dependence. New York: Wiley; 1964. The approval motive. [Google Scholar]
- Darwin C. The expression of emotions in man and animals. Chicago: Chicago University Press; 1965. (Original work published 1872) [Google Scholar]
- Ekman P. An argument for basic emotions. Cognition and Emotion. 1992;6:169–200. [Google Scholar]
- Ekman P, Freisen WV. Pictures offacial affect. Palo Alto, CA: Consulting Psychologists Press; 1976. [Google Scholar]
- Eriksen BA, Eriksen CW. Effects of noise letters upon the identification of a target letter in a nonsearch task. Perception and Psychophysics. 1974;16:143–149. [Google Scholar]
- Esteves F, Dimberg U, Ohman A. Automatically elicited fear: Conditioned skin conductance responses to masked facial expressions. Cognition and Emotion. 1994;8:393–413. [Google Scholar]
- Eysenck MW. Anxiety: The cognitive perspective. Hove, England: Psychology Press; 1992. [Google Scholar]
- Fanselow MS. Neural organization of the defensive behavior system responsible for fear. Psychonomic Bulletin and Review. 1994;1:429–438. doi: 10.3758/BF03210947. [DOI] [PubMed] [Google Scholar]
- Fox E. Allocation of visual attention and anxiety. Cognition and Emotion. 1993;7:207–215. doi: 10.1080/02699939308409185. [DOI] [PubMed] [Google Scholar]
- Fox E. Attentional bias in anxiety: A defective inhibition hypothesis. Cognition and Emotion. 1994;8:165–195. [Google Scholar]
- Fox E. Selective processing of threatening words in anxiety: The role of awareness. Cognition and Emotion. 1996;10:449–480. [Google Scholar]
- Fox E, Lester V, Russo R, Bowles RJ, Pichler A, Dutton K. Facial expressions of emotion: Are angry faces detected more efficiently? Cognition and Emotion. 2000;14:61–92. doi: 10.1080/026999300378996. [DOI] [PMC free article] [PubMed] [Google Scholar]
- Hansen CH, Hansen RD. Finding the face in the crowd: An anger superiority effect. Journal of Personality and Social Psychology. 1988;54:917–924. doi: 10.1037//0022-3514.54.6.917. [DOI] [PubMed] [Google Scholar]
- Hermans D, Vansteenwegen D, Eelen P. Eye movement registration as a continuous index of attention deployment: Data from a group of spider anxious students. Cognition and Emotion. 1999;13:419–434. [Google Scholar]
- Humphreys GW, Donnelly N, Riddoch MJ. Expression is computed separately from facial identity, and it is computed separately for moving and static faces: Neuropsychological evidence. Neuropsychologia. 1993;31:173–181. doi: 10.1016/0028-3932(93)90045-2. [DOI] [PubMed] [Google Scholar]
- Johansson S, Hoffland K. Frequency analysis of English grammar, based on the LOB corpus. Oxford, England: Clarendon Press; 1989. [Google Scholar]
- Jonides J. Voluntary versus automatic control over the mind’s eye’s movement. In: Long JB, Baddeley AD, editors. Attention and performance IX. Hillsdale, NJ: Erlbaum; 1981. pp. 187–203. [Google Scholar]
- La Berge D. Attentional processing. Cambridge, MA: Harvard University Press; 1995. [Google Scholar]
- Lazarus RS. Psychological stress and the coping process. New York: McGraw-Hill; 1966. [Google Scholar]
- Le Doux J. The emotional brain. New York: Simon & Schuster; 1996. [Google Scholar]
- Lundqvist D, Esteves F, Ohman A. The face of wrath: Critical features for conveying facial threat. Cognition and Emotion. 1999;13:691–711. doi: 10.1080/02699930244000453. [DOI] [PubMed] [Google Scholar]
- Macleod C, Mathews A. Anxiety and the allocation of attention to threat. Quarterly Journal of Experimental Psychology: Human Experimental Psychology. 1988;40(A):653–670. doi: 10.1080/14640748808402292. [DOI] [PubMed] [Google Scholar]
- MacLeod C, Mathews A, Tata P. Attentional bias in emotional disorders. Journal of Abnormal Psychology. 1986;95:15–20. doi: 10.1037//0021-843x.95.1.15. [DOI] [PubMed] [Google Scholar]
- Macleod C, Rutherford EM. Anxiety and the selective processing of emotional information: Mediating roles of awareness, trait and state variables, and personal relevance of stimulus materials. Behaviour Research and Therapy. 1992;30:479–491. doi: 10.1016/0005-7967(92)90032-c. [DOI] [PubMed] [Google Scholar]
- Mandler G. Mind and body: Psychology of emotion and stress. New York: Norton; 1984. [Google Scholar]
- Martin M, Williams R, Clark D. Does anxiety lead to selective processing of threat-related information? Behaviour Research and Therapy. 1991;29:147–160. doi: 10.1016/0005-7967(91)90043-3. [DOI] [PubMed] [Google Scholar]
- Mathews A. Why worry? The cognitive function of anxiety. Behavioural Research and Therapy. 1990;28:455–468. doi: 10.1016/0005-7967(90)90132-3. [DOI] [PubMed] [Google Scholar]
- McKelvie SJ. The meaningfulness and meaning of schematic faces. Perception and Psychophysics. 1973;14:343–348. [Google Scholar]
- Mogg K, Bradley B. Selective attention and anxiety: A cognitive-motivational perspective. In: Dalgleish T, Power M, editors. Handbook of cognition and emotion. Chichester, England: Wiley; 1999. pp. 145–170. [Google Scholar]
- Mogg K, Bradley B, Hallowel N. Attentional bias to threat: Roles of trait anxiety, stressful events, and awareness. Quarterly Journal of Experimental Psychology: Human Experimental Psychology. 1994;47(A):841–864. doi: 10.1080/14640749408401099. [DOI] [PubMed] [Google Scholar]
- Mogg K, Bradley B, Williams R. Attentional bias in anxiety and depression: The role of awareness. British Journal of Clinical Psychology. 1995;34:17–36. doi: 10.1111/j.2044-8260.1995.tb01434.x. [DOI] [PubMed] [Google Scholar]
- Mogg K, Bradley B, Williams R, Mathews A. Subliminal processing of emotional information in anxiety and depression. Journal of Abnormal Psychology. 1993;102:304–311. doi: 10.1037//0021-843x.102.2.304. [DOI] [PubMed] [Google Scholar]
- Morris JS, Ohman A, Dolan RJ. Conscious and unconscious emotional learming in the human amygdala. Nature. 1998;393:467–473. doi: 10.1038/30976. [DOI] [PubMed] [Google Scholar]
- Morris JS, Ohman A, Dolan RJ. A subcortical pathway to the right amygdala mediating "unseen" fear. Proceedings of the National Academy of Scienes. 1999;96:1680–1685. doi: 10.1073/pnas.96.4.1680. [DOI] [PMC free article] [PubMed] [Google Scholar]
- Oatley K, Johnson-Laird PN. Towards a cognitive theory of emotions. Cognition and Emotion. 1987;1:29–50. [Google Scholar]
- Ohman A, Soares JF. On the automatic nature of phobic fear: Conditioned electrodermal responses to masked fear-relevant stimuli. Journal of Abnormal Psychology. 1993;102:121–132. doi: 10.1037//0021-843x.102.1.121. [DOI] [PubMed] [Google Scholar]
- Ohman A, Soares JF. Emotional conditioning to masked stimuli: Expectancies for aversive outcomes following nonrecognized fear-relevant stimuli. Journal of Experimental Psychology: General. 1998;127:69–82. doi: 10.1037//0096-3445.127.1.69. [DOI] [PubMed] [Google Scholar]
- Posner MI. Chronometric explorations of the mind. Hillsdale, NJ: Erlbaum; 1978. [Google Scholar]
- Posner MI. Orienting of attention. Quarterly Journal of Experimental Psychology. 1980;32:3–25. doi: 10.1080/00335558008248231. [DOI] [PubMed] [Google Scholar]
- Posner MI, Inhoff AW, Friedrich FJ, Cohen A. Isolating attentional systems: A cognitive-anatomical analysis. Psychobiology. 1987;15:107–121. [Google Scholar]
- Posner MI, Peterson SE. The attention system of the human brain. Annual Review of Neuroscience. 1990;13:25–42. doi: 10.1146/annurev.ne.13.030190.000325. [DOI] [PubMed] [Google Scholar]
- Power M, Dalgleish T. Cognition and emotion: From order to disorder. Hove, England: Psychology Press; 1997. [Google Scholar]
- Pratto F. Consciousness and automatic evaluation. In: Niedenthal PM, Kitayama S, editors. The heart’s eye: Emotional influences in perception and attention. New York: Academic Press; 1994. pp. 116–140. [Google Scholar]
- Pratto F, John 0P. Automatic vigilance: The attention grabbing power of negative social information. Journal of Personality and Social Psychology. 1991;61:380–391. doi: 10.1037//0022-3514.61.3.380. [DOI] [PubMed] [Google Scholar]
- Purcell DG, Stewart AL, Skov RB. It takes a confounded face to pop out of a crowd. Perception. 1996;25:1091–1108. doi: 10.1068/p251091. [DOI] [PubMed] [Google Scholar]
- Quinlan P. The Oxford psycholinguistic database. Oxford, England: Oxford University Press; 1992. [Google Scholar]
- Remington R, Pierce L. Moving attention: Evidence for time-invariant shifts of visual selective attention. Perception and Psychophysics. 1984;35:393–399. doi: 10.3758/bf03206344. [DOI] [PubMed] [Google Scholar]
- Rolls E. Neurophysiological mechanisms underlying face processing within and beyond the temporal cortical area. Philosophical Transactions of the Royal Society of London, B. 1992;335:11–21. doi: 10.1098/rstb.1992.0002. [DOI] [PubMed] [Google Scholar]
- Russo R, Patterson N, Roberson D, Stevenson N, Upward J. Emotional value of information and its relevance in the interpretation of homophones in anxiety. Cognition and Emotion. 1996;10:213–220. [Google Scholar]
- Schneider W. Micro Experimental Laboratory: An integrated system for IBM-PC compatibles. Behavior Research Methods, Instruments, and Computers. 1988;20:206–217. [Google Scholar]
- Spielberger CD, Gorsuch RL, Lushene R, Vagg PR, Jacobs GA. Manual for the State-Trait Anxiety Inventory. Palo Alto, CA: Consulting Psychologists Press; 1983. [Google Scholar]
- Stolz JA. Exogenous orienting does not reflect an encapsulated set of processes. Journal of Experimental Psychology: Human Perception and Perfiormance. 1996;22:187–201. doi: 10.1037//0096-1523.22.1.187. [DOI] [PubMed] [Google Scholar]
- Treisman AM. Strategies and models of selective attention. Psychological Review. 1969;76:282–299. doi: 10.1037/h0027242. [DOI] [PubMed] [Google Scholar]
- Wells A, Matthews G. Attention and emotion: A clinical perspective. Hove, England: Erlbaum; 1994. [Google Scholar]
- White M. Automatic affective appraisal of words. Cognition and Emotion. 1996;10:199–211. [Google Scholar]
- Williams JMG, Mathews A, MacLeod C. The emotional Stroop task and psychopathology. Psychological Bulletin. 1996;120:3–24. doi: 10.1037/0033-2909.120.1.3. [DOI] [PubMed] [Google Scholar]
- Williams JMG, Watts FN, MacLeod C, Mathews A. Cognitive psychology and emotional disorders. Chichester, England: Wiley; 1988. [Google Scholar]
- Williams JMG, Watts FN, MacLeod C, Mathews A. Cognitive psychology and emotional disorders. 2nd ed. Chichester, England: Wiley; 1997. [Google Scholar]
- Yamada H. Visual information for categorizing facial expressions of emotion. Applied Cognitive Psychology. 1993;7:257–270. [Google Scholar]
- Yantis S. Attentional capture in vision. In: Kramer AF, Coles MGH, Logan GD, editors. Converging operations in the study of visual selective attention. Washington, DC: American Psychological Association; 1996. [Google Scholar]