Abstract
The catalog of RNAs present in dendrites represents the complete repertoire of local translation that contributes to synaptic plasticity. Most views hold that a pool of dendritic mRNAs is selectively transported to a dendritic destination. This view requires that some mRNAs in the dendrite are locally enriched relative to the cell body; however, quantitative comparisons that would support this assumption do not currently exist. These issues related to somatodendritic distribution of mRNAs also apply to the microRNAs, ∼21 nucleotide noncoding transcripts that bind to target mRNAs and either inhibit their translation or destabilize them. We combined laser capture with multiplex real-time RT (reverse transcription) PCR to quantify microRNAs in the neuritic and somatic compartments separately. The samples were standardized by RT-PCR measurements of a set of mRNAs, including known dendritic mRNAs, in these two compartments. Most neuronal miRNAs were detected in dendrites. With a few notable exceptions, most miRNAs were distributed through the somatodendritic compartment across a nearly constant gradient. Thus for lower-abundance miRNAs, the total neuronal concentration of the miRNA can remain readily detectable in the cell body but vanish from the dendrite. A very small number of miRNAs deviate from the distribution gradient across the miRNA population as relatively enriched or depleted in the dendrite.
Keywords: plasticity, dendritic translation, synapses, RNA localization, mRNA
INTRODUCTION
Since the discovery of ribosomes at the base of spines (Steward and Levy 1982), interest in RNA in dendrites has mounted, especially with the strong evidence for local dendritic translation in synaptic plasticity. The presence of specific mRNAs in dendrites has been most convincingly documented by in situ hybridization. Well-documented mRNAs detected by in situ hybridization include microtubule-associated protein 2 (MAP2) (Garner et al. 1988; Kleiman et al. 1990), the α-subunit of Ca2+/calmodulin-dependent protein kinase II (CaMKIIα) (Miyashiro et al. 1994), brain-derived neurotrophic factor (BDNF), tyrosine-related kinase B (TrkB) receptor, IP3 receptor, the atypical protein kinase Mζ, the NMDA receptor (NMDAR) NR1 subunit, and glycine receptor α-subunit (for review, see Steward and Schuman 2003). More dynamic studies have shown that mRNA translocation to dendrites is regulated (Knowles et al. 1996; Rook et al. 2000), and the translocation of at least one specific mRNA (activity-regulated cytoskeleton-associated protein, Arc) is closely linked to its transcriptional activation (Lyford et al. 1995). Amplification of mRNAs in dendritic compartments has expanded the list of dendritic mRNAs greatly to several hundred (Miyashiro et al. 1994; Tian et al. 1999; Eberwine et al. 2002; Moccia et al. 2003; Sung et al. 2004; Zhong et al. 2006). However, in all of the studies quoted above, quantitative considerations of the relative amounts of various RNAs in the dendritic and cell body compartments are missing.
Recently microRNAs (miRNAs) have been added to the dendritic RNA repertoire (Schratt et al. 2006). MicroRNAs (miRNAs) are ∼21 nucleotide (nt) post-transcriptional regulators of gene expression that cleave or inhibit the translation of target mRNAs. An miRNA derives from a much larger transcript called a pri-miRNA that is cleaved in the nucleus to an ∼70 nt pre-miRNA and exported to the cytoplasm, where a second cleavage produces the mature miRNA. miRNAs are abundant in the nervous system, where they play key roles in development and may be important mediators of plasticity (Kosik 2006). Several hundred mammalian miRNAs are known, and each may bind hundreds of mRNA targets. Recently interest in dendritic RNA has extended the question of what mRNAs are present in dendrites to what miRNAs are present in dendrites. Using laser capture techniques, we isolated the dendritic and somatic compartments to profile these two miRNA populations by multiplex real-time PCR.
RESULTS
Quantification of mRNAs and miRNAs from neuronal somata and neurites
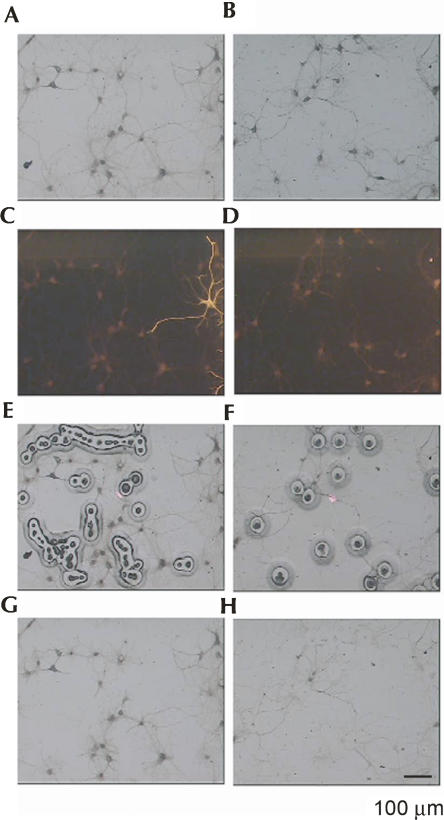
Laser capture was used to collect the neuronal somata and neurites separately from dissociated E19 rat hippocampal neurons after 15 d in culture. The cells were plated sparsely with regions of the plate sufficiently devoid of cell bodies to capture just neurite populations, and the direct visualization allowed the capture of a very pure sample. Neurites were captured beyond the primary segment and often beyond the secondary branch. Although axons are part of the neurite population, the axons of day 15 cultured hippocampal neurons lack ribosomes and have little if any RNA (Kleiman et al. 1994). Therefore, although the neurite sample contained both axonal and dendritic processes, the RNA signal derived almost entirely from dendrites. (In this study, the term “neurites” refers to the experimentally captured sample, and the term “dendrites” is used to describe conclusions drawn from the captured sample.) Neuronal cell bodies were collected separately and distinguished from glial cells, which constituted ∼5% of the culture, by a GFAP antibody (Fig. 1). Typically, glia grew in clusters (because they are dividing), and they could be readily avoided. Where neurons and glia were too close, they were not sampled.
FIGURE 1.
Laser capture microdissection of hippocampal neurites. Hippocampal cells from E19 rat embryos were isolated, grown in culture for 15 d, and stained for GFAP. Bright-field and fluorescent microscopy was used to capture glial-free dendrites (A,C,E,G) and neuronal cell bodies (B,D,F,H). Sequential micrographs illustrate typical (A,B) pre-capture bright-field, (C,D) pre-capture fluorescence, (E,F) capture, and (G,H) post-capture bright field images. Scale bars, 100 μm.
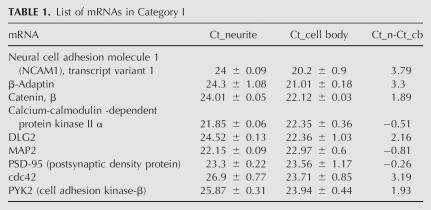
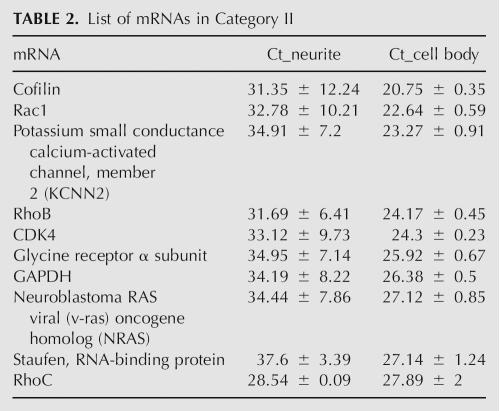
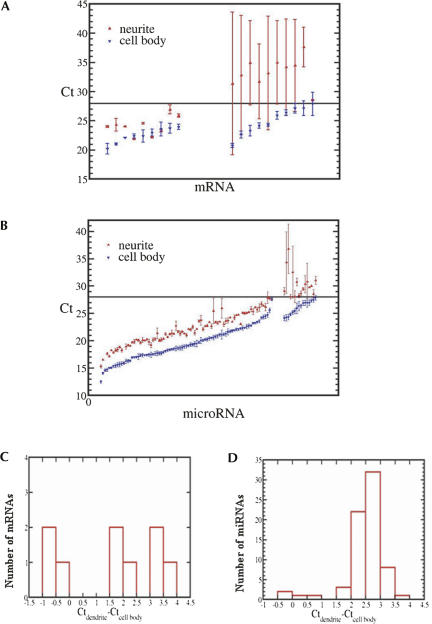
To assess this collection method and establish a standard for comparative measurements between the cell bodies and the neurites, 19 mRNAs, including two well-established dendritic mRNAs (MAP2 and CaMKIIα mRNAs), were quantified by real-time RT-PCR (Tables 1, 2). We adjusted the sample size so that the Ct values for the MAP2 and CaMKIIα mRNAs in the cell body and neurite samples were approximately equal. A collection of 2000 cell bodies and neurites from 30,000 neurons resulted in approximately equal Ct values for the MAP2 and CaMKIIα mRNAs in the cell body and the neurite samples. (Half of each sample was used for the analysis.) Thus, with MAP2 and CaMKIIα mRNAs as references, we could distinguish those mRNAs relatively restricted to the soma from somatodendritic mRNAs. Equal Ct values in the cell body and neurite fractions of this sample set indicated mRNAs that were distributed similarly to MAP2 and CaMKIIα mRNAs, and the difference in the Ct values of an mRNA between these compartments indicated the distribution of that mRNA. Differences that deviated from zero indicated mRNAs that had skewed from the reference mRNAs. A Ct=28 was set as a conservative reliability threshold based on the scatterplot (Supplemental Fig. 1A). Ct >28 had high standard deviations and, therefore, falls in the range of noise because of its low level. We cannot assign an accurate value to the level of the RNA when Ct >28; however, if the error bar remained several logs below 40, it is likely that the RNA was present, but at an indeterminately low copy number.
TABLE 1.
List of mRNAs in Category I
TABLE 2.
List of mRNAs in Category II
For the small subset of mRNAs tested, we observed two distribution patterns between the cell bodies and the neurites (Fig. 2A; Tables 1, 2). Category I had Ct <28 in both the cell body and the neurite samples and were therefore considered somatodendritic. MAP2 and CaMKIIα mRNAs were in this category. Category II had Ct <28 in cell bodies but Ct >28 in the neurites. This pattern suggested relative exclusion of the mRNA from the neurites and further validates the ability of the method to discriminate somatic from somatodendritic mRNAs. Among category I mRNAs (with standard deviations in the neurite and cell body fractions <0.5), the ΔCt values defined as the difference between the cell body and neurite fractions ranged from −0.14 to 3.88 (Fig. 2C). These values represented the distribution range of mRNAs between the cell body and neurite compartments.
FIGURE 2.
(A) The mean and standard deviation of Ct values detected in the dendrites and cell bodies for 19 mRNAs. From the left to the right, we split the mRNAs into two categories: (1) mean Ct <28 in both the cell bodies and neurites; (2) the mean Ct <28 in the cell body but not in the neurites. Nine and 10 mRNAs fall in these two categories. The mRNAs are arranged in increasing order of mean cell body Ct values in each category. (B) The mean and standard deviation of Ct values detected in the dendrites and cell bodies for 99 microRNAs. The arrangement of data here is the same as in panel A. There are 83 and 16 microRNAs in each of the two categories. (C,D) Distribution of the ΔCt values between neurites and cell bodies for (C) mRNAs and (D) microRNAs.
Measurements of total cell body and neurite RNA in the same samples were 7.7 ± 3 ng/μL and 2.1 ± 0.56 ng/μL, respectively. These values most likely reflect ribosomal RNA, which is the most abundant type of RNA in a cell by far. This 3.67-fold difference in total RNA between the two compartments reflects the negative RNA gradient in passing from the cell body to the dendrite. This fold difference in the two compartments is equivalent to a ΔCt of 1.88, a value that approximates the median ΔCt among the somatodendritic mRNAs.
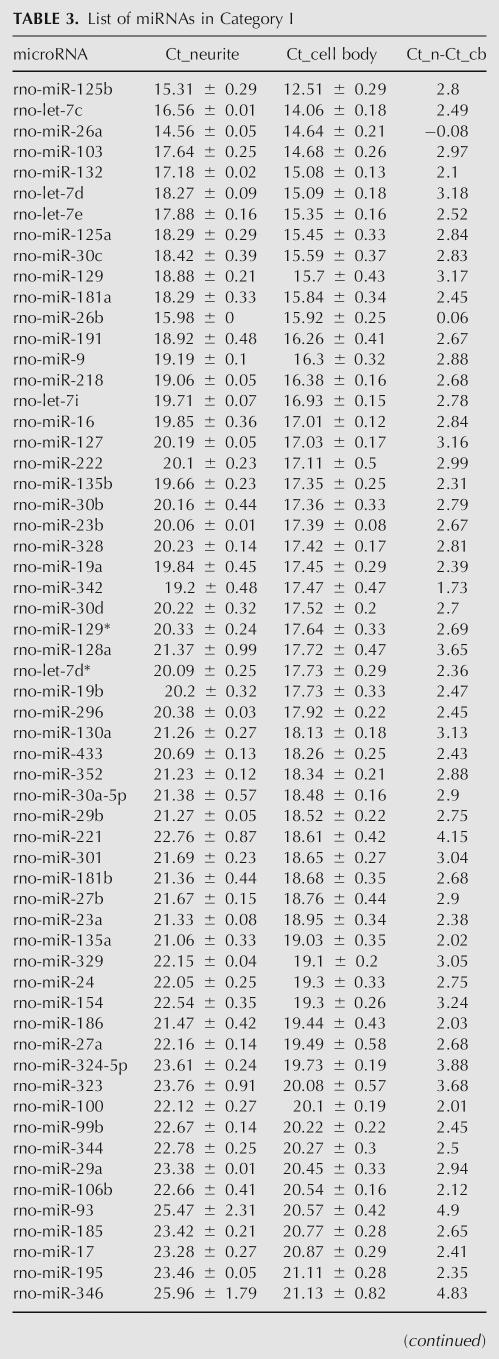
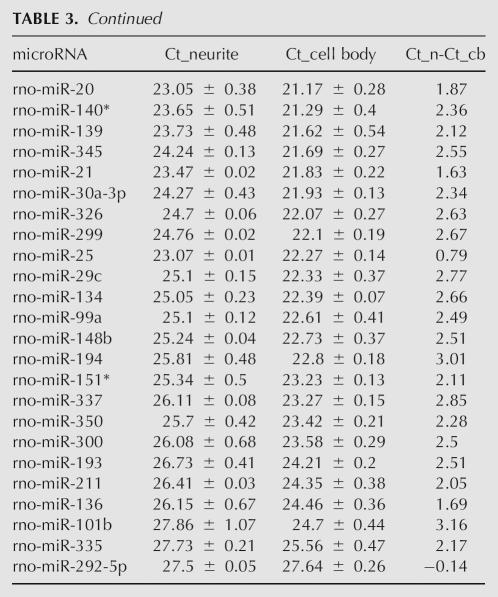
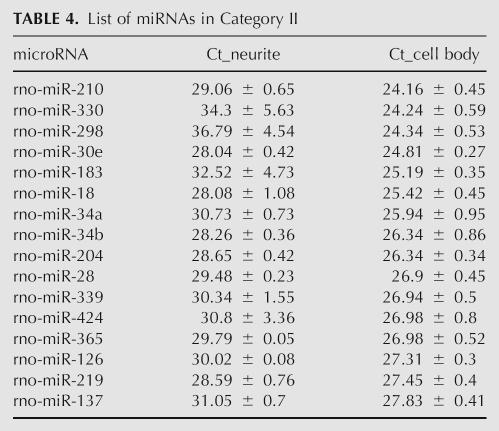
So that known dendritic mRNAs were equal between the cell body and neurite samples, 187 rat miRNAs were probed by multiplexed real-time RT-PCR (Lao et al. 2006) in the same samples standardized. Eighty-eight miRNAs were discarded because they did not pass the filtering rules (see Materials and Methods) due to cell body Ct values in the noise range (Supplemental Fig. 1B), noise in the no template control (NTC), or Ct fluctuations for the same sample due to human error. Grouping the remaining miRNAs into the same two categories described above (Fig. 2B; Tables 3, 4), there were 83 miRNAs with Ct <28 in both the cell body and the neurite samples (category I) and 16 miRNAs with Ct <28 in the cell bodies, but at very low copy number in neurites (Ct >28) (category II).
TABLE 3.
List of miRNAs in Category I
TABLE 4.
List of miRNAs in Category II
When grouped as miRNAs with Ct values either >28 (category II) or <28 (category I), most of the cell body miRNA Ct values were also higher in category II than in category I. Therefore, the over-riding distinction between these two categories cannot be described as a setoff between dendritic and nondendritic miRNAs. Rather, for most miRNAs, there is a large falloff in concentration between the cell body and the dendrites. More importantly, in most cases, undetectable levels of a miRNA in dendrites are due to relatively low values in the cell body that drop to undetectable across the somatodendritic gradient.
A somatodendritic miRNA gradient
To detect any trends in the gradient between miRNA Ct values in cell bodies compared to neurites, we quantified category I ΔCt, i.e., Ct neurite–Ct cell body. Because we were now undertaking the identification of miRNAs after computing a difference in the Ct values, we tightened the exclusion criteria from SD >1 to SD >0.5, and therefore excluded another 13 miRNAs. (Even without increasing the statistical stringency, the histogram looked the same; however, the 0.5 level increased confidence in fitting the distribution.)
From the histogram of ΔCt, we observed two groups of miRNAs: those centered around zero and those centered around 2.5 (Fig. 2D). The majority of miRNAs fell in the latter group, which had a ΔCt = 2.61 ± 0.39 (mean and SD), or 5.22-fold. The distribution can be approximated as a normal distribution using the Komolgorov–Smirnov test (P = 0.99 in the Komolgorov–Smirnov test, a value far higher than the 0.05 threshold below which the hypothesis of a normal distribution would be rejected). With this relatively small standard deviation of ±0.39, we concluded that most miRNAs distributed across a similar gradient between cell bodies and neurites in a normal fashion.
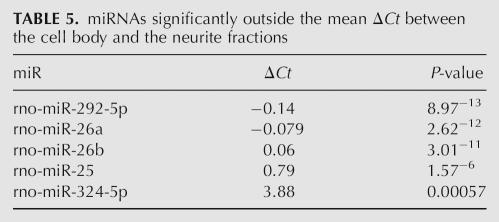
Those miRNAs with ΔCts that fell significantly (2 SD) outside the mean of this distribution are listed in Table 5. At one extreme, these miRNAs have ΔCts of approximately zero, and therefore are comparable to the reference mRNAs, MAP2 and CaMKIIα. These miRNAs are relatively enriched in the dendrite. At the other extreme, ΔCts significantly greater than the mean represent miRNAs that are relatively excluded from neurites. A single-plex assay (Chen et al. 2005) was used to validate miR-26a and miR-124a. (miR-124a was selected for its known high abundance in neurons but had been filtered out of the multiplex assay due to NTC noise.) Using the same set of samples equalized for MAP2 and CaMKIIα mRNAs, the Ct values for miR-26a were 11.24 ± 0.59 in the cell bodies and 11.10 ± 0.68 in the neurites. Thus the difference in miR-26a Ct values is very similar to the reference mRNAs, MAP2 and CaMKIIα, and is therefore enriched in the dendrites. In contrast, miR-124a Ct values were 16.39 ± 0.24 in the cell bodies and 20.82 ± 1.23 in the neurites. These values indicate that miR-124a is many-fold more abundant in the cell bodies than in the neurites.
TABLE 5.
miRNAs significantly outside the mean ΔCt between the cell body and the neurite fractions
microRNA in situ hybridization signal in dendrites
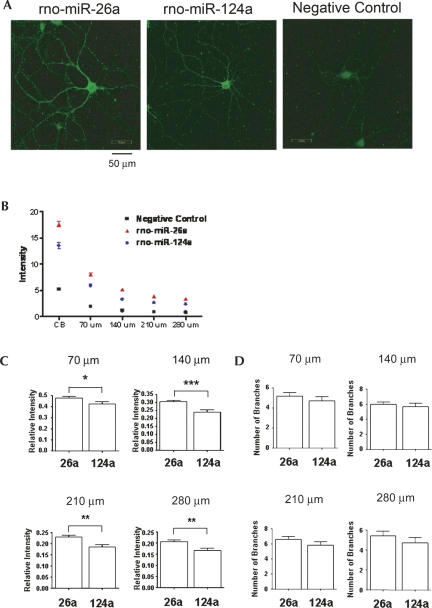
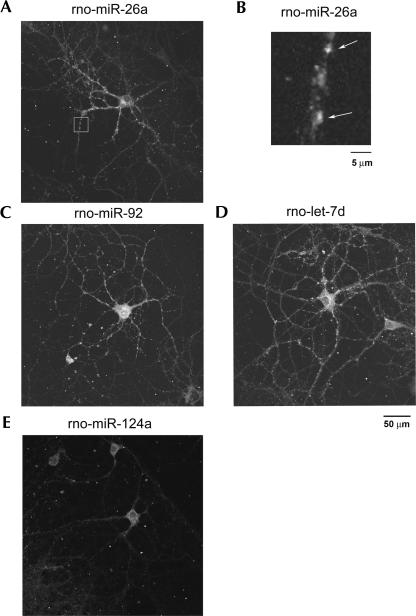
In situ hybridization of rat hippocampal cultures with LNA probes was used to confirm the differential spatial distribution of rno-miR-26a and miR-124a (Fig. 3). Consistent with the real-time PCR data, miR-26a extended well into tertiary and quaternary branches of the dendritic tree. In contrast, rno-miR-124a did not appreciably extend into the dendrites. Dendritic miRNAs appeared punctate by in situ hybridization (Fig. 4), a pattern typical of many dendritic mRNA populations. The visualization of miRNA puncta required capturing individual optical sections in the Z-axis. Dendritic branching did not significantly differ in any of the experiments (Fig. 3D).
FIGURE 3.
(A) Localization of miRNAs by in situ hybridization. Hippocampal neurons from E19 rat embryos were isolated, cultured for 15 d, hybridized with biotinylated LNA probes, and detected with FITC-conjugated streptavidin. Scale bars, 50 μm. (B) Intensity plot of the cell body (CB) and at each of the indicated distances from the cell body compared to control. (C) Relative intensity of miR-26a and miR-124a as a function of distance from the cell body. Bars represent relative intensities of miRNAs in the neuritic compartment compared to the intensities of cell bodies (mean ± SEM). (D) The average number of branches measured in each probe. Bars represent the average number of branches (mean ± SEM). Eleven to 22 neurons for each miRNA probe were analyzed with Metamorph. Statistical significance was tested using a Student's t-Test. (*) p <0.05; (**) p <0.01; (***) p <0.001.
FIGURE 4.
miRNAs appear granular by in situ hybridization in cultured hippocampal neurons. (A) rno-miR-26a. (B) High power of rno-miR-26a puncta; (C) rno-miR-92; (D) rno-let-7d; and (E) rno-124a. Images were acquired using a confocal microscope. (A,C,D,E) Scale bar, 50 μm; (B) scale bar, 5 μm.
The dendritic microRNA miR-26a targets the dendritic mRNA MAP2
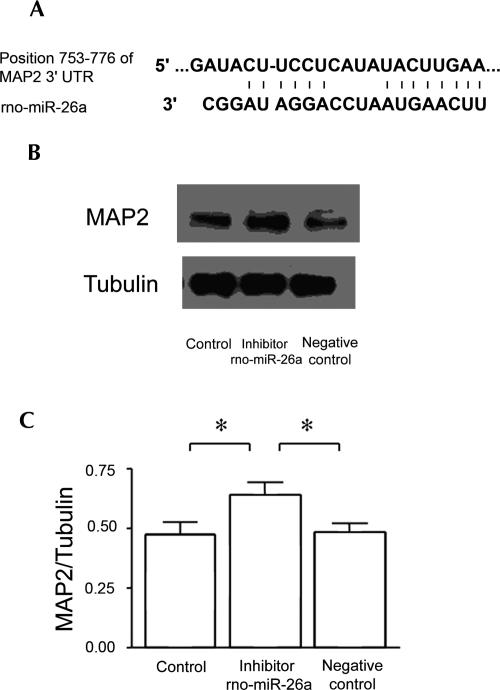
The enrichment of miR-26a in dendrites is comparable to well-established dendritic mRNAs. Two target prediction programs (Pictar and Targetscan) predict that the dendritic MAP2 mRNA is among the miR-26a targets. To confirm this prediction, a 2′-O-methyl-modified oligonucleotide inhibitor of miR-26a was transfected into primary hippocampal neurons, and the amount of MAP2 protein was measured by immunoblotting the sample. Relative to controls (see Materials and Methods), the hippocampal neurons treated with the inhibitor showed significantly increased MAP2 protein immunoreactivity (Fig. 5).
FIGURE 5.
Validation of MAP2 mRNA as an miR-26a target. (A) Predicted binding site between MAP2 and rno-miR-26a (Pictar and Targetscan). (B) Immunoblot of whole-cell lysates from 7-d cultured hippocampal neurons treated with 2′-O-methyl modified oligonucleotide (Dharmacon) directed at rno-miR-26a. Suppression of miR-26a results in increased MAP2 protein. (C) Relative amount of MAP2 protein 24 h after inhibitor transfection and its negative control. The data are the average of three measurements expressed as mean ± standard error (SEM). Statistical significance was determined using a Student's t-test. (*) p <0.05.
miRNA copy number in single neurons
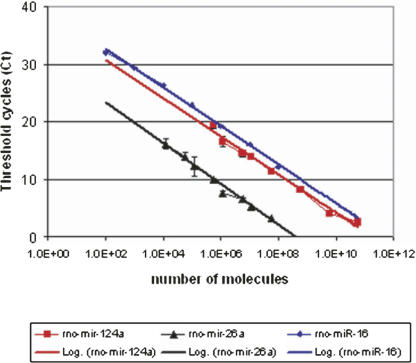
Single-plex real-time PCR was used to determine a standard curve for estimating the miRNA copy number for specific miRNAs. As expected, this analysis also demonstrated that although relative comparisons of miRNAs are possible, comparisons of Ct values among different miRNAs are inherently inaccurate. Known amounts of three synthetic miRNAs were diluted over six orders of magnitude in order to plot miRNA concentration against Ct (Fig. 6). All three miRNAs displayed similar slopes, indicating that the Ct values can provide accurate relative comparisons. Differences in the X-intercept among the miRNAs tested are likely due to different hybridization characteristics of the reverse primers for a reverse transcriptase reaction.
FIGURE 6.
Standard curves for the quantification of miRNAs. Black represents rno-miR-26a, red represents rno-miR-124a, and blue represents rno-miR-16. Calibration was performed stepwise. Ten-fold dilution of synthetic miRNAs from 0.1 fmol to 100 pmol. The amounts of rno-miR-26a and rno-miR-124a synthetic miRNAs were quantified by singleplex real-time PCR, and the amount of miR-16 was quantified in the presence of the multiplex primer mix to confirm the sensitivity and accuracy of multiplex real-time PCR. The average threshold cycle number (Ct, Y-axis) from four independent experiments was plotted against the amount of the synthetic miRNA (X-axis). Error bars depict the standard deviation of the Ct. The straight line is a variance weighted linear fit through all the measurements. R 2 = linear correlation coefficient = 1. All primer and TaqMan probe sequences are listed in Supplemental Table 2.
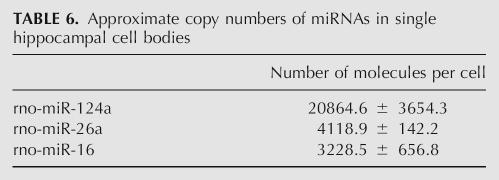
It was possible to use these data to estimate the number of copies of a specific miRNA in a single neuron. Ct values of each of the three miRNAs taken from the multiplex profile of laser captured neuronal cell bodies were located on the standard curve, and the corresponding miRNA concentration was divided by 100 for the number of cells used in this analysis. rno-miR-124a is among the most abundant miRNAs in neurons and fell in the range of 104 copies per neuronal cell body. Despite its abundance, rno-miR-124a is enriched in cell bodies. rno-miR-26a and rno-miR-16 are less abundant miRNAs and fell in the range of 103 copies per neuronal cell body (Table 6). Because a ΔCt of 2.61±0.39 describes the distribution of most miRNAs between the cell body and neurite, the number of copies of many miRNAs distributed along this gradient may be as low as in the hundreds of copies in the dendritic compartment. Even a one-order-of-magnitude error in this number is far below the number of synapses on the dendritic tree, and, therefore, the copy numbers of many miRNAs are likely to fall below one per synapse.
TABLE 6.
Approximate copy numbers of miRNAs in single hippocampal cell bodies
DISCUSSION
We developed a laser capture technique capable of collecting cell bodies and neurites in separate bins followed by multiplex real-time PCR to profile multiple miRNAs or mRNAs in the captured sample. The approach here allowed a more quantitative unbiased comparison of large numbers of RNAs, particularly miRNAs, in the cell body and dendritic compartments. With cell body and neurite samples harvested so that they contained approximately equivalent amounts of the dendritic mRNAs MAP2 and CaMKIIα, comparisons of other RNAs could be referenced to these standards. In so doing, most miRNAs detectable in both cell bodies and neurites were distributed between the compartments by 5.22-fold (=2^2.61 corresponds to Ct = 2.61 ± 0.39), a difference that varied very little. A small number of miRNAs had equivalent Ct values in the cell body and neurite fractions, suggesting that these miRNAs were distributed similarly to the MAP2 and CaMKIIα mRNAs. A small number of miRNAs differed significantly more than the mean fold-difference between the cell bodies and neurites, suggesting that these miRNAs are relatively excluded from the neurites. rno-miR-26a was the most striking example of the former, and rno-miR-124a was the most striking example of the latter. These observations were supported by in situ hybridization (Figs. 3, 4). Interestingly, rno-miR-26a is predicted to target MAP2 mRNA, and suppression of rno-miR-26a with a 2′-O-methyl-modified oligonucleotide resulted in an increase of the MAP2 protein (Fig. 5).
Most of the literature on the localization of RNAs in dendrites focuses on in situ hybridization to specific mRNAs, which is the “gold standard” collection of dendritic mRNAs. This is a relatively small set, and none of these studies are very quantitative. Unbiased or less biased techniques have attempted to measure all the mRNAs in dendrites, and the conclusions of these studies are that the number of mRNAs in dendrites is large. However, these studies are also not particularly quantitative in that they do not address relative amounts of mRNAs in dendrites versus cell bodies. The design of our study allows us to be more quantitative on the issue of dendritic RNA than previous studies. The known distribution of the mRNAs in Table 1 corresponds extremely well with the data in the literature including four mRNAs for which “gold standard” in situ hybridization studies are available. These mRNAs are MAP2 (Garner et al. 1988), CaMK2a (Burgin et al. 1990; McKee et al. 1990), PSD-95 (Zalfa et al. 2007), and β-adaptin (Miyashiro et al. 2003). The others are documented as dendritic by less direct methods.
Further support for the mRNA distribution we found comes from those we considered somatic (relatively high cell body signal, but negligible amounts in the neurites). Among this set is the following documented somatic mRNAs: GAPDH (Poon et al. 2006), RhoB, and RhoC (Wu et al. 2005). We conclude that most RNAs (mRNAs and miRNAs) extend into dendrites along similar gradients, and a smaller subset are either enriched or depleted against the gradient. This concept advances previous thinking that might be summed up as classifying mRNAs into dendritic versus non-dendritic, and instead puts forth a more nuanced view. Quantification more accurately frames the question of what countercurrent mechanisms enrich or deplete RNAs in dendrites. These questions are particularly relevant to miRNAs because their biogenesis pathway is distinct from mRNAs until they engage the RISC.
The transition to the dendrite may involve a set gradient along which the copy numbers of many mRNAs and miRNAs fall off. Many low-abundance RNAs would not be present at all in the dendrite, and moderately abundant RNAs would become more scarce.
A commensurate decline in miRNAs and mRNAs would not alter the miRNA target field, whereas disproportionate changes in mRNAs and miRNAs in dendrites would suggest an altered set of mRNA targets for the same miRNAs in the dendrites. Parallel changes in the miRNA and mRNA populations are consistent with the “hitch-hiking model” (Kosik 2006) in which miRNAs travel to the dendrites bound to their target mRNAs. The targeting of MAP2 mRNA by miR-26a shown here is a possible example of an miRNA–mRNA pair that travels together to the dendrite. Furthermore, the relative abundance of mature miRNAs is several thousand-fold greater than pre-miRNAs (Chen et al. 2005), and the RT-PCR assay is only sensitive to mature miRNAs. Therefore, it is unlikely that any pre-miRNAs are detectable if the copies of mature miRNAs are only 1000–10,000 copies per cell.
Among the set of miRNAs evaluated using a standard curve generated specifically for those miRNAs, copy numbers ranged from 103 to 104 copies per cell. Based on five miRNAs in mouse cells, the full range of miRNA copy number had been reported as 10–30,000 copies per cell (Chen et al. 2005). Because RNA falls off rapidly as one proceeds distally in the dendrite, the dendritic miRNA system approaches very low copy numbers, suggesting that the behavior of the miRNA target field can be modeled as a stochastic process. Stochasticity derived from the effects of miRNAs will contribute to the activation barrier for coherent responses, to the utilization of information provided by translational bursting, and to the flexibility needed by dendrites to sample alternative states (Kaern et al. 2005).
MATERIALS AND METHODS
Hippocampal cell culture
Hippocampi were dissected from E19 Sprague-Dawley rat embryos. Neurons were dissociated with P23 (3 mg/mL for 15 min at 37°C), triturated, and plated on 12-mm coverslips coated with poly-D-lysine. Cells were plated at 20,000 cells/coverslip for in situ hybridization experiments and at 60,000 cells/coverslip for laser capture microdissection experiments. Plating medium (minimum essential medium, 20% glucose, 2% B27 supplement, 10% FBS, 25 μM L-glutamine, 1× pen-strep) was changed after 4 h, and cells were maintained in neurobasal medium, 2% B27 supplement, 500 μM L-glutamine, and 1× pen-strep at 37°C in a humidified incubator with 5% CO2. After 4–5 d in culture, one-half of the media was changed, and cytosine arabinoside was added to a final concentration of 1 μM.
Cell staining and laser capture microdissection
Fifteen-day cultured hippocampal neurons were washed with PBS and fixed in 4°C, 70% ethanol. Cells were stained with GFAP to distinguish neurons with glial cells. To avoid RNA degradation, staining was performed with solutions prepared with DEPC-treated water on a −20°C ice block. Cells were sequentially dehydrated in 95% and 100% ethanol, sequentially rehydrated in 95% and 70% ethanol and TBST (0.05 M Tris Base, 0.9% NaCl, 0.1% Tween 20), and stained for 3 min in 1:100 anti-GFAP-Cy3 conjugated monoclonal antibody (Sigma) diluted in TBST. Cells were washed in TBST and in TBS (0.05 M Tris Base, 0.9% NaCl) and sequentially dehydrated in 70%, 95%, and 100% ethanol, followed by a rinse in xylenes at room temperature. Slides were air-dried, and neurites and neuronal cell bodies were captured using a PixCell IIe LCM System (Arcturus). One laser captured hole was 55–60 μm. Glia were identified by GFAP-positive staining under the fluorescent microscope, and neuronal somata and neurites were only captured from regions without any nearby GFAP staining (Fig. 1). After capture, sample caps were incubated in 10 μL of extraction buffer (Arcturus) for 30 min at 37°C to extract RNA. Samples were stored at – 80°C until analyzed. Nearly all neurites were collected from an area under one cap, which covered 800–1000 cells. Thirty caps were collected for the neurite sample, which is the equivalent of approximately a set of neurites from 30,000 neurons, and 2000 neuronal cell bodies were captured per condition. To perform real-time PCR for quantifying microRNAs, half of the captured fractions were buffer-exchanged into water using Centri-Spin 10 columns (Princeton Separations), pooled, lyophilized to a final volume of 10 μL, and treated with 1 μL of RNase inhibitors (Eppendorf). For real-time PCR to quantify messenger RNAs, the RNA from the other half of captured fractions was isolated with the PicoPure TM RNA isolation kit (Arcturus) to a final volume of 10 μL.
Real-time RT-PCR for miRNA detection
187-plex RT-PCR was adapted for the rat sequences from Lao et al. (2006) based on Sanger's October 2005 registry. Briefly, multiplex reverse transcription primers were generated with a common 20-nt stem–loop followed by 8 nt complementary to the 3′-end of a given miRNA (e.g., 5′-AACTATAC-3′ for rno-let-7a). Reverse transcriptase reactions were performed in 5 μL containing 1× cDNA Archiving Kit buffer (Applied Biosystems), 10 units of MMLV reverse transcriptase, 1.25 mM each dNTP, 1.3 units of RNase inhibitors (Applied Biosystems), 2.5 nM each reverse primer, and 2 μL of laser capture microdissection samples. Reactions were 30 cycles for 30 sec at 20°C, 30 sec at 42°C, and 1 sec at 50°C and one cycle for 5 min at 85°C to inactivate the enzyme.
Pre-PCR
cDNA was pre-amplified using a common reverse primer (UR) to the 20-nt stem–loop and multiplexed ∼18-nt forward primers (FPs) with a common 5′-end and a 3′-end matching 12–17 nt of the 5′-end of a given miRNA (e.g., 5′-TCCAGCTCCTATATGAT-3′ for rno-let-7a). The amplification was performed in 25 μL containing 1× Universal Master Mix with no UNG (Applied Biosystems), 50 nM each FP, 5 μM UR, 6.25 units of AmpliTaq Gold polymerase (Applied Biosystems), 0.5 mM each dNTP, 2 mM MgCl2, and 5 μL of the initial reverse transcriptase amplification. Reactions were one cycle of 10 min at 95°C, 2 min at 55°C, and 14 cycles of 1 sec at 95°C and 1 min at 65°C.
Real-time PCR
The product of this amplification was diluted four times, and 0.1 μL was used for real-time PCR performed in 10 μL containing 1× Universal Master Mix with no UNG (Applied Biosystems), 0.25 μM FP, 0.1 μM TaqMan probe, and 5 μM UR. The miRNA specificity for each reaction was provided by the miRNA-specific sequences of the FP and TaqMan probes. Real-time PCR was performed in a Biosystems 7500HT 96-well plate Sequence Detection System using 40 cycles of 15 sec at 95°C and 1 min at 60°C. All reactions were run in duplicate. The threshold cycle (Ct) was determined as the fractional cycle number at which the fluorescence passes the fixed threshold. For primer sequences, see Supplemental Table 2. All Ct values were averaged over two to four repeated biological experiments each with two averaged real-time PCR experimental replicates.
Single-plex real-time PCR
Single-plex real-time PCR was performed as described for multiplex real-time PCR with one modification: A single miRNA-specific primer was used instead of multiple primers.
Real-time PCR for mRNA detection
RT-PCR was performed to measure the amount of mRNAs in the same laser capture microdissected samples. Reverse transcriptase reactions were performed in 5 μL containing 1× cDNA Archiving Kit buffer (Applied Biosystems), 10 units MMLV reverse transcriptase, 1.25 mM each dNTP, 1 unit of RNase inhibitor (Applied Biosystems), 2 μM random primer, and 1 μL of laser capture microdissection samples. Reactions were 10 min at 20°C, 120 min at 37°C, and 5 min at 85°C to inactivate the enzyme. cDNA was pre-amplified using gene-specific forward primers and reverse primers. The amplification was performed in 25 μL containing 1× Universal Master Mix with no UNG (Applied Biosystems), 50 nM each FP, 50 nM each RP, 6.25 units of AmpliTaq Gold polymerase (Applied Biosystems), 0.5 mM each dNTP, 0.75 mM MgCl2, and 5 μL of the initial reverse transcriptase amplification. Reactions were one cycle for 10 min at 95°C, 2 min at 55°C, and 14 cycles of 1 sec at 95°C and 1 min at 65°C. The product of this amplification was diluted four times, and 0.1 μL was used for real-time PCR reactions detecting mRNAs. It was performed in 10 μL containing 1× Universal Master Mix with no UNG (Applied Biosystems), 500 nM FP, 200 nM TaqMan probe, and 500 nM UR. Real-time PCR was performed as above. For primer sequences, see Supplemental Table 1.
Data processing on microRNA multiplex experimental results
We collected RNA from three rats and prepared two samples from dendrites and four samples from cell bodies. For each miRNA, we performed duplicate experiments on two independent samples of neurites and four independent samples of cell bodies. Thus, we obtained 187(2 + 4) = 1122 paired Ct values from which we calculated the mean and the standard deviation. Because larger Ct values tended to have greater fluctuation, we set 28 as the cutoff value above which the fluctuation made precise determination of the Ct less reliable and below which the Ct value was highly reliable. Quantitatively, among the 1122 paired Ct values, 127 (∼11%) of them had a standard deviation >1. However, of the pairs with mean Ct values less than the cutoff, only 16 out of 735 (∼2%) paired values had a standard deviation >1. This confirmed the reliability of the experimental data. The total number of classifiable miRNAs is less than the total number of miRNAs in the multiplex assay because 83 were removed that did not pass reliability filters. Among the 187 miRNAs in the raw data, 30 had an NTC Ct <28 (high NTC noise); 36 Cts were above the cutoff in all samples; four had a large fluctuation in duplicated experiments; and 13 had a large fluctuation between samples (SD >1). A further five miRNAs were excluded with a mean Ct in cell body >28 even though their among-sample fluctuation was small. After filtering, we were left with 99 miRNAs. The data processing procedure for mRNAs was the same as for miRNAs except that we allowed larger fluctuations among samples because mRNA is less stable than miRNA.
In situ hybridization
LNA (locked-nucleic acid; Exiqon) probes were labeled with biotin using the 3′-end DNA Labeling Kit (Pierce) and purified using chloroform/isoamylalcohol. The LNA probes had the following sequences: tggcattcaccgcgtgccttaa (rno-mir-124a), gcctatcctggattacttgaa (rno-mir-26a), and catgtcatgtgtcacatctctt as a negative control. This control does not match any sequence in the rat genome. Cultures were quickly washed in PBS; fixed in 4% PFA in PBS/5% acetic acid for 15 min; washed three times in PBS for 5 min; dehydrated and rehydrated by sequential addition of 70%, 95%, 100%, 95%, and 70% EtOH; and washed three times in PBS. Cells were pre-hybridized for 4 h in HM buffer (50% Formamide, 5× SSC, 0.1% Tween 20, 9.2 mM citric acid, 50 μg/mL heparin, 500 μg/mL yeast RNA at pH 6.2) and hybridized overnight in 20 nM LNA probe in HM buffer in a humidified chamber at 55°C. Stringency washes were carried out in 100% HM, 50% HM/50% 2× SSC, twice in 2× SSC, and three times in 50% formamide/50% 2× SSC (each for 30 min) at hybridization temperature followed by PBS, 0.1% Tween 20 at room temperature (five times for 5 min). Cells were blocked for 60 min in blocking buffer (2% sheep serum, 2 mg/mL BSA in PBS, 0.1% Tween 20) for 1 h at room temperature and stained with 1:500 FITC-conjugated streptavidin (Pierce) diluted in blocking buffer overnight at 4°C. Slides were washed three times in 2× SCC at 37°C, mounted, and visualized on a confocal microscope (Flowview 500; Olympus).
Images were analyzed using the Metamorph software package (Molecular Devices). Concentric circles centered in the middle of the cell covering the cell body (diameter 70 μm, 140 μm, 210 μm, and 280 μm) were drawn and the intensity of the signals within the sector measured. Only distinguishable neurites were measured and the number of branches with signal counted.
miRNA inhibition
For miRNA inhibition, 250,000 hippocampal neurons from embryonic day 19 (E19) rat embryos were grown in six-well plates. After 7 d in culture, neurons were transfected with rno-miR-26a inhibitor or its negative control (Dharmacon) using TransMessenger Transfection Reagent (QIAGEN). For control experiments, cells were treated with the transfection reagent without modified 2′-O-methyl RNA or modified 2′-O-methyl RNA whose sequence did not match any known sequences. Two micromolar inhibitor was transfected with 4 μL of enhancer and 8 μL of TransMessenger Transfection Reagent. One hour later neurons were washed twice with fresh medium, incubated for 24 h in conditioned medium, and harvested in 200 μL of lysis buffer (50 mM Tris-HCl at pH 7.4, 150 mM NaCl, 1 mM PMSF, 1 mM EDTA, 1% Triton X-100, 1% sodium deoxycholate, 0.1% SDS, and protease cocktail inhibitor tablets [Roche Applied Science]). Following separation on an 8% SDS-PAGE gel, the sample was immunoblotted for MAP2 and Tubulin by standard procedures. Antibodies against MAP2 and Tubulin (Covance) were used at 1:4000 and 1:5000 dilutions, respectively, in blocking buffer. Detection was performed with Supersignal West Femto Maximum Sensitivity Substrate (Pierce). Membranes were exposed to X-ray Hyperfilm ECL. Images were analyzed with LabWorks Analysis Software.
SUPPLEMENTAL DATA
All supplemental materials are available at http://www.lifesci.ucsb.edu/mcdb/labs/kosik/kye/kye-rna-supplementary.pdf.
ACKNOWLEDGMENTS
Thanks are due to the W.M. Keck Foundation for support; Kathy Puskar, Parul Karpil, Andrew Sun, and Brian Matsumoto for technical assistance; and to members of the Kosik laboratory for stimulating discussions.
Footnotes
Article published online ahead of print. Article and publication date are at http://www.rnajournal.org/cgi/doi/10.1261/rna.480407.
REFERENCES
- Burgin, K.E., Waxham, M.N., Rickling, S., Westgate, S.A., Mobley, W.C., Kelly, P.T. In situ hybridization histochemistry of Ca2+/calmodulin-dependent protein kinase in developing rat brain. J. Neurosci. 1990;10:1788–1798. doi: 10.1523/JNEUROSCI.10-06-01788.1990. [DOI] [PMC free article] [PubMed] [Google Scholar]
- Chen, C., Ridzon, D.A., Broomer, A.J., Zhou, Z., Lee, D.H., Nguyen, J.T., Barbisin, M., Xu, N.L., Mahuvakar, V.R., Andersen, M.R., et al. Real-time quantification of microRNAs by stem–loop RT-PCR. Nucleic Acids Res. 2005;33:e179. doi: 10.1093/nar/gni178. [DOI] [PMC free article] [PubMed] [Google Scholar]
- Eberwine, J., Belt, B., Kacharmina, J.E., Miyashiro, K. Analysis of subcellularly localized mRNAs using in situ hybridization, mRNA amplification, and expression profiling. Neurochem. Res. 2002;27:1065–1077. doi: 10.1023/a:1020956805307. [DOI] [PubMed] [Google Scholar]
- Garner, C.C., Tucker, R.P., Matus, A. Selective localization of messenger RNA for cytoskeletal protein MAP2 in dendrites. Nature. 1988;336:674–677. doi: 10.1038/336674a0. [DOI] [PubMed] [Google Scholar]
- Kaern, M., Elston, T.C., Blake, W.J., Collins, J.J. Stochasticity in gene expression: From theories to phenotypes. Nat. Rev. Genet. 2005;6:451–464. doi: 10.1038/nrg1615. [DOI] [PubMed] [Google Scholar]
- Kleiman, R., Banker, G., Steward, O. Differential subcellular localization of particular mRNAs in hippocampal neurons in culture. Neuron. 1990;5:821–830. doi: 10.1016/0896-6273(90)90341-c. [DOI] [PubMed] [Google Scholar]
- Kleiman, R., Banker, G., Steward, O. Development of subcellular mRNA compartmentation in hippocampal neurons in culture. J. Neurosci. 1994;14:1130–1140. doi: 10.1523/JNEUROSCI.14-03-01130.1994. [DOI] [PMC free article] [PubMed] [Google Scholar]
- Knowles, R.B., Sabry, J.H., Martone, M.E., Deerinck, T.J., Ellisman, M.H., Bassell, G.J., Kosik, K.S. Translocation of RNA granules in living neurons. J. Neurosci. 1996;16:7812–7820. doi: 10.1523/JNEUROSCI.16-24-07812.1996. [DOI] [PMC free article] [PubMed] [Google Scholar]
- Kosik, K.S. The neuronal microRNA system. Nat. Rev. Neurosci. 2006;7:911–920. doi: 10.1038/nrn2037. [DOI] [PubMed] [Google Scholar]
- Lao, K., Xu, N.L., Yeung, V., Chen, C., Livak, K.J., Straus, N.A. Multiplexing RT-PCR for the detection of multiple miRNA species in small samples. Biochem. Biophys. Res. Commun. 2006;343:85–89. doi: 10.1016/j.bbrc.2006.02.106. [DOI] [PubMed] [Google Scholar]
- Lyford, G.L., Yamagata, K., Kaufmann, W.E., Barnes, C.A., Sanders, L.K., Copeland, N.G., Gilbert, D.J., Jenkins, N.A., Lanahan, A.A., Worley, P.F. Arc, a growth factor and activity-regulated gene, encodes a novel cytoskeleton-associated protein that is enriched in neuronal dendrites. Neuron. 1995;14:433–445. doi: 10.1016/0896-6273(95)90299-6. [DOI] [PubMed] [Google Scholar]
- McKee, A.C., Kosik, K.S., Kennedy, M.B., Kowall, N.W. Hippocampal neurons predisposed to neurofibrillary tangle formation are enriched in type II calcium/calmodulin-dependent protein kinase. J. Neuropathol. Exp. Neurol. 1990;49:49–63. doi: 10.1097/00005072-199001000-00006. [DOI] [PubMed] [Google Scholar]
- Miyashiro, K., Dichter, M., Eberwine, J. On the nature and differential distribution of mRNAs in hippocampal neurites: Implications for neuronal functioning. Proc. Natl. Acad. Sci. 1994;91:10800–10804. doi: 10.1073/pnas.91.23.10800. [DOI] [PMC free article] [PubMed] [Google Scholar]
- Miyashiro, K.Y., Beckel-Mitchener, A., Purk, T.P., Becker, K.G., Barret, T., Liu, L., Carbonetto, S., Weiler, I.J., Greenough, W.T., Eberwine, J. RNA cargoes associating with FMRP reveal deficits in cellular functioning in Fmr1 null mice. Neuron. 2003;37:417–431. doi: 10.1016/s0896-6273(03)00034-5. [DOI] [PubMed] [Google Scholar]
- Moccia, R., Chen, D., Lyles, V., Kapuya, E., Yaping, E., Kalachikov, S., Spahn, C.M., Frank, J., Kandel, E.R., Barad, M., et al. An unbiased cDNA library prepared from isolated Aplysia sensory neuron processes is enriched for cytoskeletal and translational mRNAs. J. Neurosci. 2003;23:9409–9417. doi: 10.1523/JNEUROSCI.23-28-09409.2003. [DOI] [PMC free article] [PubMed] [Google Scholar]
- Poon, M.M., Choi, S.H., Jamieson, C.A., Geschwind, D.H., Martin, K.C. Identification of process-localized mRNAs from cultured rodent hippocampal neurons. J. Neurosci. 2006;26:13390–13399. doi: 10.1523/JNEUROSCI.3432-06.2006. [DOI] [PMC free article] [PubMed] [Google Scholar]
- Rook, M.S., Lu, M., Kosik, K.S. CaMKIIα 3′ untranslated region-directed mRNA translocation in living neurons: Visualization by GFP linkage. J. Neurosci. 2000;20:6385–6393. doi: 10.1523/JNEUROSCI.20-17-06385.2000. [DOI] [PMC free article] [PubMed] [Google Scholar]
- Schratt, G.M., Tuebing, F., Nigh, E.A., Kane, C.G., Sabatini, M.E., Kiebler, M., Greenberg, M.E. A brain-specific microRNA regulates dendritic spine development. Nature. 2006;439:283–289. doi: 10.1038/nature04367. [DOI] [PubMed] [Google Scholar]
- Steward, O., Levy, W.B. Preferential localization of polyribosomes under the base of dendritic spines in granule cells of the dentate gyrus. J. Neurosci. 1982;2:284–291. doi: 10.1523/JNEUROSCI.02-03-00284.1982. [DOI] [PMC free article] [PubMed] [Google Scholar]
- Steward, O., Schuman, E.M. Compartmentalized synthesis and degradation of proteins in neurons. Neuron. 2003;40:347–359. doi: 10.1016/s0896-6273(03)00635-4. [DOI] [PubMed] [Google Scholar]
- Sung, Y.J., Weiler, I.J., Greenough, W.T., Denman, R.B. Selectively enriched mRNAs in rat synaptoneurosomes. Brain Res. Mol. Brain Res. 2004;126:81–87. doi: 10.1016/j.molbrainres.2004.03.013. [DOI] [PubMed] [Google Scholar]
- Tian, Q.B., Nakayama, K., Okano, A., Suzuki, T. Identification of mRNAs localizing in the postsynaptic region. Brain Res. Mol. Brain Res. 1999;72:147–157. doi: 10.1016/s0169-328x(99)00214-4. [DOI] [PubMed] [Google Scholar]
- Wu, K.Y., Hengst, U., Cox, L.J., Macosko, E.Z., Jeromin, A., Urquhart, E.R., Jaffrey, S.R. Local translation of RhoA regulates growth cone collapse. Nature. 2005;436:1020–1024. doi: 10.1038/nature03885. [DOI] [PMC free article] [PubMed] [Google Scholar]
- Zalfa, F., Eleuteri, B., Dickson, K.S., Mercaldo, V., De Rubeis, S., di Penta, A., Tabolacci, E., Chiurazzi, P., Neri, G., Grant, S.G., et al. A new function for the fragile X mental retardation protein in regulation of PSD-95 mRNA stability. Nat. Neurosci. 2007;10:578–587. doi: 10.1038/nn1893. [DOI] [PMC free article] [PubMed] [Google Scholar]
- Zhong, J., Zhang, T., Bloch, L.M. Dendritic mRNAs encode diversified functionalities in hippocampal pyramidal neurons. BMC Neurosci. 2006;7:17. doi: 10.1186/1471-2202-7-17. [DOI] [PMC free article] [PubMed] [Google Scholar]


