Abstract
The molecular basis and downstream targets of oral selenium supplementation in individuals with elevated risk of cancer due to chronic exposure from environmental carcinogens has been largely unexplored. In this study, we investigated genome-wide differential gene expression in peripheral blood mononuclear cells (PBMC) from individuals with pre-malignant arsenic (As)-induced skin lesions before and after six months daily oral supplementation of 200 μg l-selenomethionine. The Affymetrix GeneChip Human 133A 2.0 array, containing probes for 22,277 gene transcripts, was used to assess gene expression. Three different normalization methods, RMA (Robust Multi-chip Analysis), GC-RMA and PLIER (Probe Logarithmic Intensity Error), were applied to explore differentially expressed genes. We identified a list of 28 biologically meaningful, significantly differentially expressed genes. Genes up-regulated by selenium supplementation included TNF, IL1B, IL8, SOD2, CXCL2 and several other immunological and oxidative stress-related genes. When mapped to a biological association network, many of the differentially expressed genes were found to regulate functional classes such as fibroblast growth factor, collagenase, matrix metalloproteinase and stromelysin-1, and thus, considered to affect cellular processes like apoptosis, proliferation and others. Many of the significantly up-regulated genes following selenium-supplementation were previously found by us to be down-regulated in a different set of individuals with As-induced skin lesions compared to those without. In conclusion, findings from this study may elucidate the biological effect of selenium supplementation in humans. Additionally, this study suggests that long-term selenium supplementation may revert some of the gene expression changes presumably induced by chronic As exposure in individuals with pre-malignant skin lesions.
Keywords: Selenium, gene expression, micro-array, arsenic, skin lesion
INTRODUCTION
Nearly 100 million people worldwide, including an estimated 35 to 77 million people in Bangladesh alone, have been exposed to arsenic (As) through contaminated groundwater.. The problem in Bangladesh has been designated as the largest mass poisoning event in human history by the World Health Organization (Smith et al. 2000) Arsenic has been associated with a wide range of health effects including increased risk of non-melanocytic skin cancers (NMSC) as well as other internal malignancies (Alain et al. 1993; Soucy et al. 2003). As-induced NMSCs are preceded by typical pre-malignant skin lesions, which include pigmentation changes (melanosis and leucomelanosis) and/or bilateral hyperkeratosis and nodules over the palms and soles. The exact mechanism by which As induces skin lesions and influences progression of the lesions to NMSC is not well known. However, there is mounting evidence that As may produce reactive oxygen species (ROS) that may induce DNA damage, including single- and double-strand breaks and nucleotide base modification, which in turn may lead to carcinogenesis (Amundson et al. 1999; Kessel et al. 2002; Liu and Jan 2000; Liu et al. 2005; Lynn et al. 2000; Roussel and Barchowsky 2000; Shi et al. 2004). Thus, antioxidant agents have been hypothesized to be potentially beneficial in treating individuals with arsenical skin lesions. Towards this end, we have recently conducted a randomized, double-blind, placebo-controlled chemoprevention trial to evaluate the effect of vitamin E and/or selenium supplementation in individuals with As-induced skin lesions in Bangladesh (Verret et al. 2005). The potential role of vitamin E and selenium supplementation in the prevention of cancer, cardiovascular and other chronic disorders has been extensively examined with great enthusiasm in other non-As settings with mixed success. However, the molecular basis and downstream targets resultant from antioxidant supplementation remain largely unexplored.
In the present study, we investigated genome-wide differential expression of genes using the Affymetrix GeneChip Human 133A 2.0 array in peripheral blood mononuclear cells (PBMC) collected pre and post six-month selenium supplementation of individuals with As-induced premalignant skin lesions.
MATERIALS AND METHODS
Study population
The study participants were enrolled in a recently conducted randomized double-blind placebo-controlled trial of selenium and vitamin E in Araihazar, Bangladesh. Details of the trial design and methods have been published elsewhere (Verret et al. 2005) and are briefly detailed here. The trial participants included 121 adult men and women with clinical signs of As-induced skin lesions. Individuals who reported taking any antioxidant vitamins or selenium within the past six months were excluded. Using a 2×2 factorial design, participants were randomized to one of four treatment arms for daily supplementation of 200 μg l-selenomethionine, 400 IU racemic α-tocopherol, combination, or placebo for a six-month period. Extensive interview and clinical data as well as biological samples (fasting blood and urine) were collected from all trial participants at baseline and at the end of the six-month intervention period. Overall treatment compliance was excellent, with only 7.44% of patients missing 1 day, 6.61% missing 2 days and 2.48% missing 3 days of pills during the 6-month study duration (Verret et al. 2005).
The participants in the selenium-only treatment arm of the clinical trial were eligible for the current study (n=31; 28 men and 3 women). Among the 28 male participants, 20 were current smokers, 6 were past smokers, and 2 were non-smokers. To minimize the effect of sex and smoking on gene expression profiles, we considered only males and current smokers for inclusion in the present study due to the more prevalent distribution of those characteristics in the eligible population. The 14 oldest males (aged 47 to 60 years) were selected for the current study from the eligible male current smokers (n=20). Older age was selected with the rationale that older individuals had longer duration of arsenic exposure. In the present study, differential gene expression was examined pre- and post-selenium supplementation among this subset of 14 individuals.
Biological samples
We assessed gene expression changes in mononuclear cells from peripheral blood of patients with arsenical skin lesions as a surrogate marker of the carcinogenic effects of arsenic on target tissues, including those of skin. Fasting blood samples and spot urine samples were collected pre- and post-treatment with selenium for a 6-month period. The samples were kept on ice following collection and processed in the field laboratory within 3–6 hours of collection to isolate mononuclear cells and other blood fractions. Details of the blood processing protocol have been described elsewhere (Argos et al. 2006). The mononuclear cells were preserved in RLT buffer (Qiagen, Valencia, CA, USA) or Trizol reagent (Invitrogen, Carlsbad, CA, USA) and stored at −80ºC until the samples were shipped on dry ice to Columbia University for RNA extraction.
Arsenic assessment
Urinary arsenic concentrations were measured by graphite furnace atomic absorption spectrometry using the Analyst 600 graphite furnace at the Columbia University Trace Metals Core Laboratory, as has been described previously (Nixon et al. 1991). Urinary arsenic was expressed as μg per gram creatinine, which was measured by a colorimetric Sigma Diagnostics kit (Sigma, St. Louis, MO, USA).
RNA extraction
Mononuclear cells were isolated from anti-coagulated whole blood using Ficoll-Paque Plus (Amersham Biosciences, Piscataway, NJ, USA). The details of the cell separation process have been described in our previous study (Argos et al. 2006). RNA was extracted from RLT or Trizol buffer preserved mononuclear cells using the RNeasy Micro Kit (Qiagen). RNA quality and quantity were measured using RNA 6000 Nano Chips (Agilent, Palo Alto, CA, USA) in Agilent BioAnalyzer and optical fiber based ND-1000 spectrophotometer, both of which allowed measurements from a 1 μL RNA sample. Agilent 2100 Expert software V B 01.02 was used for reading the nano-chips. Option for RIN measurement was not available. As seen in the electropherogram in Figure 1A, the two most distinct and intense peaks correspond to 18S and 28S rRNA. A 28S/18S ratio greater than 1.4 and the sum of both rRNA peak areas accounting for more than 33% of all RNA were taken as indicators of good quality RNA. With the ND-1000 spectrophotometer, all the samples had an A260/A280 ratio greater than 2.0, indicating high-quality RNA (see Table 1).
Figure 1.
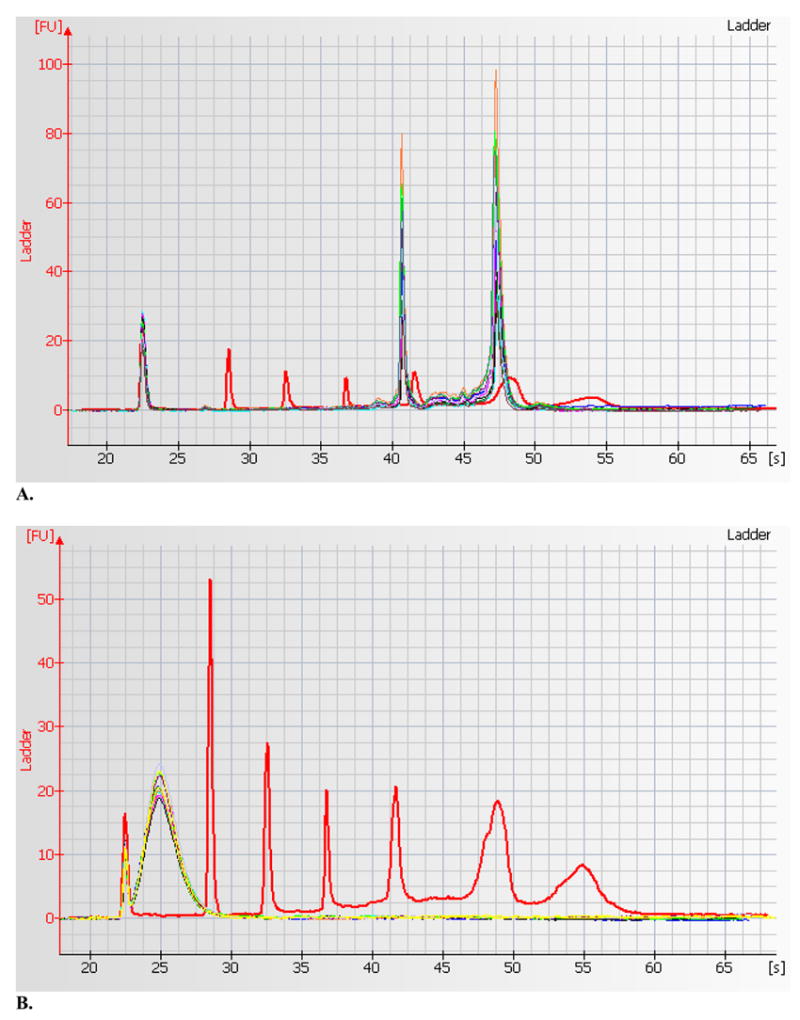
(A) Agilent 2100 BioAnalyzer electropherogram of 10 RNA samples overlaid on ladder marker peaks (shown in red). After the initial spike, the ladder peaks correspond to 200 bp, 500 bp, 1000 bp, 2000 bp and 4000 bp respectively. The two distinct sharp peaks of RNA samples (in different colors other than red) represent the 18s (around 2000 bp ladder marker) and 28s (around 4000 bp ladder marker) and show evidence of high quality RNA. (B) Electropherogram of fragmented cRNA of 10 samples overlaid on same ladder marker peaks. This shows uniform and effective fragmentation of the labeled cRNA.
Table 1.
A. Patient characteristics and B. Quality control data for RNA, and Affymetrix HG U133A 2.0 chips.
| Mean | SD | |
|---|---|---|
| A. Patient characteristics (n=14, pre- and post-supplementation) | ||
| Male (%) | 100% | |
| Smoker (%) | 100% | |
| Age (years) | 53.78 | 4.61 |
| BMI (kg/m2) | 18.20 | 2.53 |
| Urinary Arsenic (μg/L) | ||
| Pre-treatment | 157.57 | 111.78 |
| Post-treatment | 137.85 | 90.71 |
| Urinary Arsenic (μg/g of creatinine) | ||
| Pre-treatment | 202.45 | 98.03 |
| Post-treatment | 182.02 | 94.78 |
| B. Quality Control Indices of RNA and Arrays (n=28) | ||
| RNA 260/280 ratio | 2.11 | 0.03 |
| BioAnalyzer 28s/18s ratio | 1.87 | 0.30 |
| Area Under Curve (%) for 28s & 18s peak | 55.73 | 15.19 |
| cRNA 260/280 ratio | 2.07 | 0.03 |
| cRNA yield (adjusted) in μg | 30.96 | 11.15 |
| Noise (RawQ) | 1.55 | 0.11 |
| Scaling Factor | 1.70 | 0.32 |
| Background | 47.95 | 2.93 |
| Probe present (%) | 54.31 | 1.73 |
| GAPDH 3′/5′ ratio | 1.23 | 0.17 |
| HSAC07 3′/5′ ratio | 1.31 | 0.23 |
Affymetrix GeneChip Protocol
The Affymetrix GeneChip HG 133A 2.0 array was used for independent level (i.e., 28 samples on 28 different chips) genome-wide gene expression assessment according to the manufacturer’s standard protocol (Affymetrix 2001). Briefly, starting with 2 μg of total RNA, double-stranded cDNA was generated using T7- Oligo [dT] primer: 5′-GGC CAG TGA ATT GTA ATA CGA CTC ACT ATA GGG AGG CGG-[dT]24 -3′ and SuperScript-II (Affymetrix GeneChip Expression 3′-Amplification One-Cycle cDNA synthesis kit, Affymetrix Cat#900493, Santa Clara, CA, USA). The cDNA samples were purified using GeneChip Sample Cleanup Module (Affymetrix). Then, the in vitro transcription was performed using the Affymetrix GeneChip IVT Labeling kit (Affymetrix) to produce biotin-labeled cRNA. Purification of cRNA was done using the GeneChip Sample Cleanup Module (Affymetrix). Quality and quantity of purified cRNA samples were checked running a 1 μl sample on the ND-1000 spectrophotometer as well as on the Bioanalyzer. A A260/A280 ratio between 2.0 and 2.2 was accepted. The adjusted cRNA yield was calculated as below:
Adjusted cRNA yield = RNAm − (total RNAi)(y),
where, RNAm = amount of purified cRNA measured (μg), total RNAi = starting amount of RNA (μg), and y = fraction of cDNA used in the in vitro transcription reaction.
From starting material of 2 μg of total RNA, the mean (±SD) adjusted cRNA yield was 30.96 (±11.15) μg. For each sample, 15 μg of adjusted cRNA product was fragmented using 5x fragmentation buffer supplied in the GeneChip Sample Cleanup Module. Fragmented cRNA was run on the Bioanalyzer to ensure the fragmented size. Typical electropherograms of fragmented cRNA are shown in Figure 1B. Biotin-labeled fragmented cRNA was then supplied to the core facility for hybridization onto the GeneChip Human Genome-U133A 2.0 array. This micro-array platform contains 22,277 probe sets for interrogation, including known genes and expressed sequenced tags. After 16–18 hours of incubation, each micro-array was stained with streptavidin-phycoerythrin and washed and scanned by the high resolution Affymetrix GeneChip Scanner 3000 according to GeneChip Expression Analysis Technical Manual procedure (Affymetrix). After scanning, the raw intensities of each probe were stored in electronic files (DAT and CEL formats) by GCOS software (Affymetrix).
Some of the quality control matrices of the Affymetrix GeneChip Human Genome-U133A 2.0 arrays are shown in the Table 1 which shows noise (RawQ) less than 5 and background signal less than 100 in all the arrays, quite uniform scaling factor - 1.70 (SD 0.32) and consistent detection of Bio-B and Bio-C spike controls in all. On average 54.32% (±SD 1.73) probes were present in the arrays. The 3′/5′ ratio of the housekeeping genes GAPDH and HSAC07 were 1.23 (±SD 0.17) and 1.31 (±SD 0.23) respectively showing good and uniform in-vitro transcription. There was no significant difference of RNA quality judged by 260/280 ratio between the RLT and Trizol preserved samples (2.11±0.038 vs. 2.11±0.040, p=1.0), although the 28s/18s ratio measured by BioAnalyzer was little better for the RLT preserved samples as compared to the Trizol preserved ones (2.0±0.067 vs. 1.75±0.387, p=0.025). However, there was no difference in adjusted cRNA yield (32.32±11.16 μg vs. 29.61±11.39 μg respectively, p=0.532) between the RLT and Trizol preserved samples. There was also no difference in the other array indices like noise RawQ (1.51±0.101 vs. 1.59±0.115, p=0.069), scaling factor (1.64±0.178 vs. 1.76±0.43, p=0.37), background (47.18±3.27 vs. 48.73±2.41, p=0.165), and the proportion of probe present in the microarray (54.72±1.54% vs. 53.91±1.86%, p=0.216).
We also used relative quantification experiment of gene expression using real-time PCR for a selected set of genes to confirm the results from microarray experiments. We tested a total of 11 genes, of which 7 genes (CXCL2, IL1beta, IL8, PTX3, SOD2, TNF and TNF-AIP6) were selected from the genes which we found to be differentially expressed in microarray platform in the present study after selenium supplementation; the remaining 4 were selected (ID2, IL1RN, TNF-AIP3 and VEGF) from the genes that were found to be differentially expressed among individuals with skin lesion compared to those without in our previous study (Argos et al. 2006). These four genes were not found to be differentially expressed after selenium supplementation. As reference housekeeping gene GAPDH was selected for normalization purpose. We used commercially available validated Taqman Gene Expression Assays and Taqman MGB probes (Applied Biosystems, USA) and followed the standard protocol of ΔΔCt method (Livak KJ 2001). Primers were selected from ABI inventoried list and only those were selected which spans an exon-exon junction of the associated genes and thereby would not amplify genomic DNA contamination. As template, 100 ng of cDNA was used per well in 20μL reaction volume. ABI 7300 real time PCR instrument (Applied Biosystems, USA) was used for thermocycling & reading.
Statistical analysis
The method used for normalization of micro-array-based gene expression data can have a major impact on the results of differential expression analyses. Therefore, we used three different procedures for normalization to extract the signal intensity data – RMA (Robust Multi-chip Analysis) (Irizarry et al. 2003), GC-RMA (Irizarry et al. 2003) and PLIER (Probe Logarithmic Intensity Error) (Affymetrix 2001). RMA is a method of adjusting gene expression values, which fits a robust linear model to the probe-level data, analyzing each hybridized chip in the context of other chips in the experiment. The algorithm consists of three steps - a model-based background correction stage neutralizes the effects of background noise and the processing artifacts, a subsequent quantile normalization stage aligns expression values to a common scale, and finally, an iterative median polishing procedure summarizes the data and generates a single expression value for each probe set (Irizarry et al. 2003). GC-RMA is a refinement of the RMA algorithm replacing the model used in the background correction stage with a more sophisticated computation that uses each probe’s sequence information to adjust the measured intensity for the effects of non-specific binding due to the differences in bond strength between the two types of base pairs (Irizarry et al. 2003). It also takes into account the optical noise present in data acquisition for an even greater accuracy and sensitivity. The two steps of the RMA algorithm following background correction, namely, the global, cross-chip normalization and summarization through median-polishing, remain unchanged. PLIER accounts for the difference between probes by means of a parameter called probe affinity. Probe affinity represents the strength of signal produced at a specific concentration for a given probe. PLIER estimates the signal for the entire probe set more accurately by utilizing these inherent probe affinities, empirical probe performance, and by handling error appropriately across low and high concentrations. Probe affinities are calculated using experimental data across multiple arrays. PLIER also utilizes an error model that assumes that error depends on the probe, rather than on the signal alone (Affymetrix 2001). We used all the three methods of normalization to compare the results and to select a reliable list of differentially expressed genes.
To reduce noise for the significance analysis, probe sets that did not show a twofold change in expression in at least one experiment (chip) were filtered out. For statistical comparisons Array-Assist software 3.3 [Iobion Informatics, LLC] was used. For PLIER normalization, perfect match-only model was used. Essentially, we used paired t-test to compare the differences between pre- and post-intervention mean values of gene expression levels for each gene. The resulting p-values arising out of these tests for all genes were corrected for multiple testing using Benjamini-Hochberg method of false discovery rate (FDR) of 5 percent (Benjamini and Yekutieli 2005; Hochberg and Benjamini 1990). The FDR is essentially the proportion of genes claimed to be differentially expressed that are false positives. A gene was considered to be significantly differentially expressed if it showed at least 2-fold change with a FDR of 0.05.
We used Pathway Assist v3.0 software (Iobion Informatics, LLC) to explore the biological active network from the list of significant differentially expressed genes. Natural Language Processing was used for MedScan search, specifically the ResNet database covering more than 50000 gene-gene or protein-protein connections.
For the relative quantification of gene expression using real-time PCR data, ΔΔCt method was used (Livak KJ 2001), where expression of each gene in each sample well was normalized for expression of house-keeping gene GAPDH and then the relative expression in post-treatment group was compared to pre-treatment group taking the expression of pre-treatment group as 1. All the calculations were done using SDS software v 1.2 (Applied Biosystems, USA).
RESULTS
The characteristics of the study population are shown in Table 1. The mean age of the study participants was 53.8 years and mean BMI was 18.2 kg/m2. There was a slight reduction in urinary arsenic concentration between the pre- and post-treatment assessment (157.6 μg/g of creatinine and 137.8 μg/g, respectively).
Differential expression analysis
Paired pre- and post-treatment comparisons were conducted using the data generated from the three different normalization methods – RMA, GC-RMA and PLIER. Significantly differentially expressed genes were selected based on a FDR of 0.05. As shown in Figure 2A, using the RMA-normalized data 50 genes (2 down-regulated and 48 up-regulated in the post-treatment samples) were differentially expressed. As shown in Figure 2B, using the GC-RMA-normalized data 116 genes (9 down-regulated and 107 up-regulated in the post-treatment samples) were differentially expressed. Finally, as shown in Figure 2C, using the PLIER-normalized data, 31 genes (1 down-regulated and 30 up-regulated in the post-treatment samples) were differentially expressed. The overlap of differentially expressed genes from the three analyses is shown in Figure 2D. We identified 28 differentially expressed genes (1 down-regulated and 27 up-regulated in the post-treatment samples) which were common to all three normalization methods and are presented in Table 2. Of interest to note, is the 28 out of 31 genes determined to be differentially expressed using the PLIER-normalized data were all significantly differentially expressed using either the RMA- and GC-RMA-normalized data.
Figure 2.
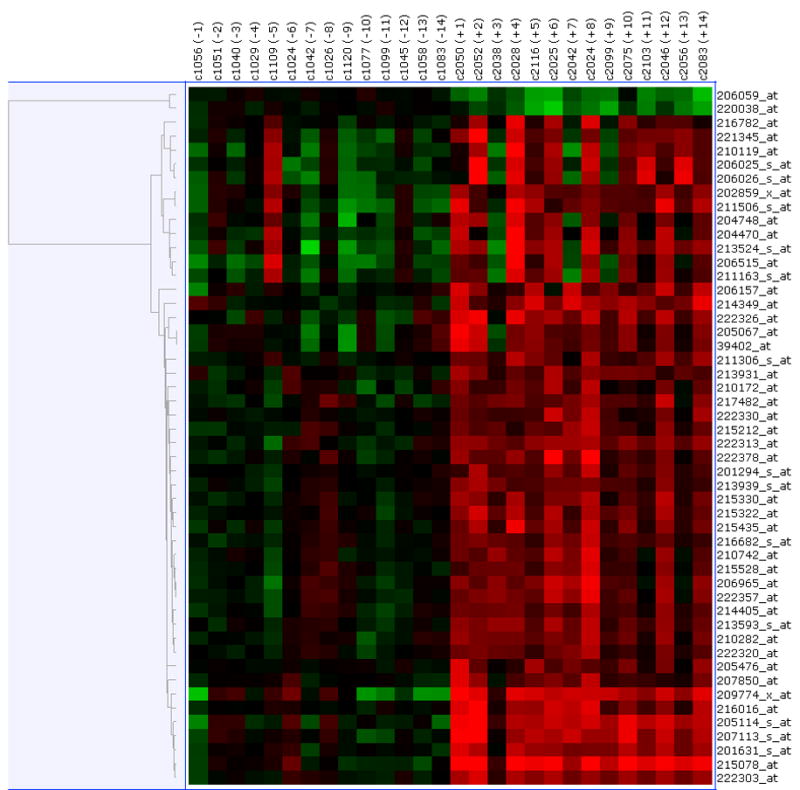
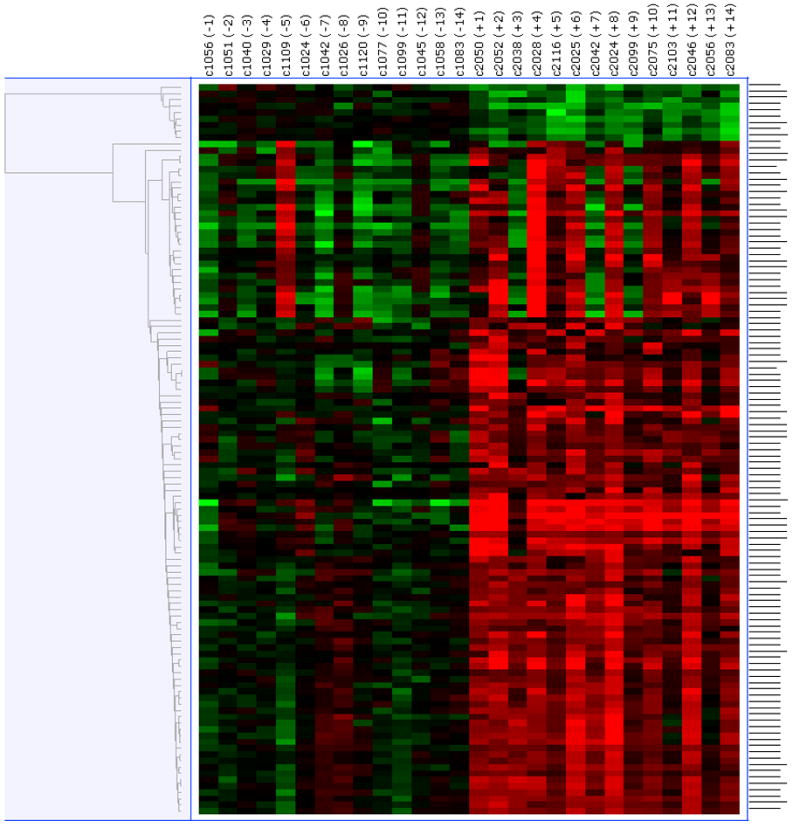
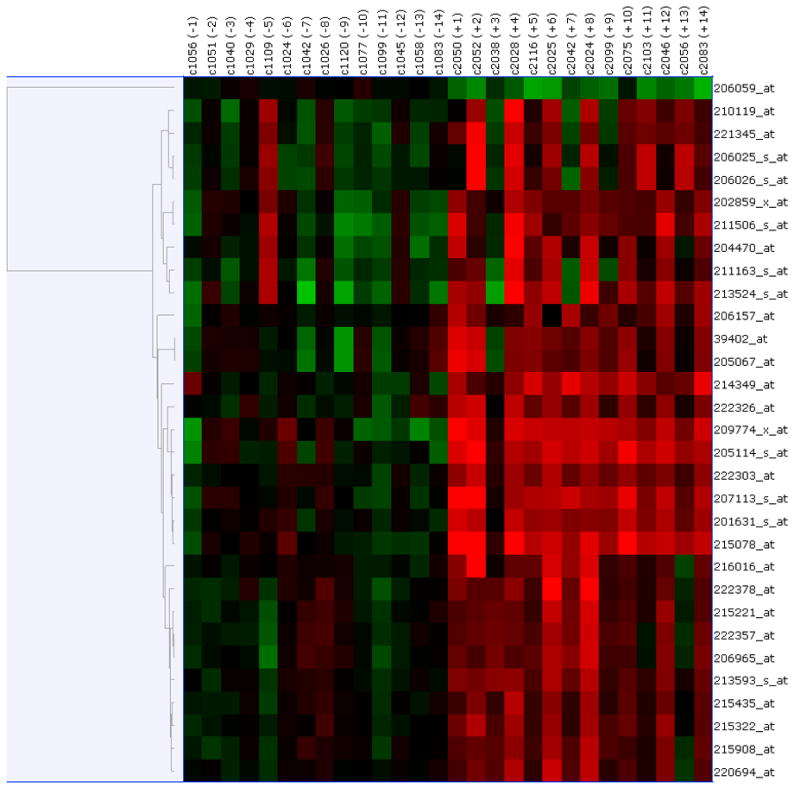
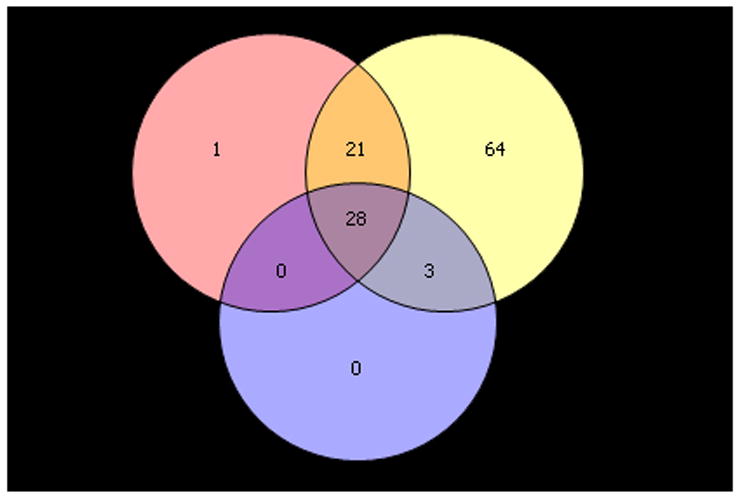
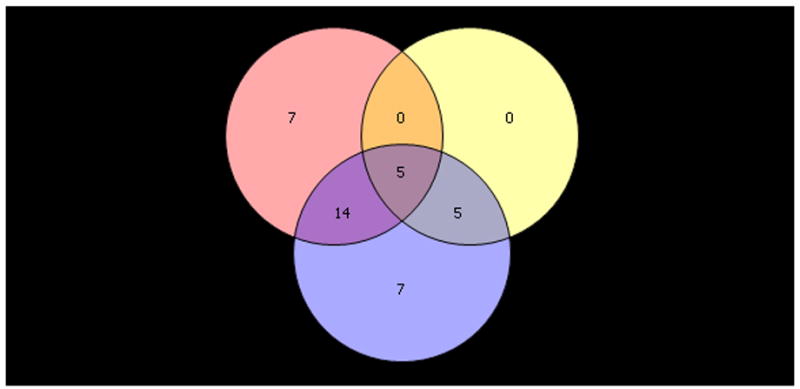
Upper panel shows heatmap comparing the gene expression in PBMC before and after six- month of selenium supplementation. Three different normalization methods shown – (A) RMA, (B) GC-RMA and (C) PLIER. In each heatmap panel, the left 14 columns represent pre-supplementation and right 14 columns represent post-supplementation expression and each row represents a gene/probe. The expression levels are shown in red (up-regulation) and green (down-regulation) compared to average baseline. Lower panel shows venn- diagram: (D) Venn diagram showing overlap of the lists of the differentially expressed genes analyzed by three different normalization methods – RMA, PLIER and GC-RMA. Upper left circle represents gene list from analysis using RMA normalized data, upper right circle represents GC-RMA and lower middle circle represents that of PLIER normalized data. (E) Venn diagram showing overlap of the lists of the differentially expressed genes analyzing the data of Gr-1 alone (upper left circle), Gr. 2 alone (upper right circle) and the combined data (lower middle circle) using PLIER normalization.
Table 2.
List of significant differentially expressed genes induced by selenium supplementation which are common in all three methods of normalization.
| Probe ID | p-value | Fold Change | Sequence | Gene Name | Gene Symbol | Location | Molecular Function (GO) |
|---|---|---|---|---|---|---|---|
| 201631_s_at | 0.000006 | 3.37 | NM_003897 | immediate early response 3 | IER3 | chr6p21.3 | --- |
| 202859_x_at | 0.000112 | 2.60 | NM_000584 | inte-rleukin 8 | IL8 | chr4q13-q21 | interleukin -8 receptor binding |
| 222326_at | 0.000024 | 2.69 | AW973834 | --- | --- | --- | --- |
| 222357_at | 0.000100 | 2.22 | --- | ||||
| 222378_at | 0.000077 | 2.44 | AW973791 | --- | --- | --- | --- |
| 39402_at | 0.000709 | 2.64 | M15330 | interleukin 1 beta | IL1B | chr2q14 | interleukin-1 receptor binding |
| 204470_at | 0.000739 | 2.73 | NM_001511 | C-X-C motif ligand 1 (melanoma growth stim ulating activity alpha) | CXCL1 | chr4q21 | chemokine activity |
| 205067_at | 0.001013 | 2.61 | NM_000576 | interleukin 1 beta | IL1B | chr2q14 | signal transducer activity//interleukin -1 receptor binding |
| 205114_s_at | 0.000003 | 4.99 | NM_002983 | chemokine (C-C motif) ligand 3-like centromeric | MGC12815 | chr17q21.1 | chemokine activity |
| 206025_s_at | 0.003672 | 2.61 | AW188198 | tumor necrosis factor alpha-induced protein 6 | TNFAIP6 | chr2q23.3 | protein binding//hyaluronic acid binding |
| 206026_s_at | 0.004484 | 2.18 | NM_007115 | tumor necrosis factor alpha-induced protein 6 | TNFAIP6 | chr2q23.3 | protein binding//hyaluronic acid binding |
| 206059_at | 0.000000 | 0.42 | NM_003430 | zinc finger protein 91 (HPF7 HTF10) | ZNF91 | chr19p13.1- p12 | transcription factor activity//zinc ion binding |
| 206157_at | 0.000739 | 2.21 | NM_002852 | pentaxin -related gene rapidly induced by IL-1 beta | PTX3 | chr3q25 | --- |
| 206965_at | 0.000081 | 2.27 | NM_016285 | Kruppel-like factor 12 | KLF12 | chr13q22 | transcription factor activity//zinc ion binding |
| 207113_s_at | 0.000010 | 4.29 | NM_000594 | tumor necrosis factor (TNF superfamily member 2) | TNF | chr6p21.3 | tumor necrosis factor receptor binding |
| 209774_x_at | 0.000016 | 5.20 | M57731 | chemokine (C-X-C motif) ligand 2 | CXCL2 | chr4q21 | chemokine activity |
| 210119_at | 0.002762 | 2.20 | U73191 | potassium inwardly-rectifying channel subfamily J member 15 | KCNJ15 | chr21q22.2 | inward rectifier potassium channel activity |
| 211163_s_at | 0.002201 | 2.15 | AF012536 | tumor necrosis factor receptor superfamily member 10c | TNFRSF10C | chr8p22-p21 | transmembrane receptor activity |
| 211506_s_at | 0.000318 | 3.40 | AF043337 | Interleukin 8 | IL8 | chr4q13-q21 | interleukin -8 receptor binding//chemokine activity |
| 213524_s_at | 0.000219 | 3.69 | NM_015714 | putative lymphocyte G0/G1 switch gene | G0S2 | chr1q32.2-q41 | --- |
| 213593_s_at | 0.000002 | 2.43 | AW978896 | transformer-2 alpha | TRA2A | chr7p15.3 | RNA binding//pre-mRNA splicing factor activity |
| 214349_at | 0.000010 | 3.65 | AV764378 | --- | --- | --- | --- |
| 215078_at | 0.000001 | 5.41 | AL050388 | superoxide dismutase 2 mitochondrial | SOD2 | chr6q25.3 | manganese superoxide dismutase activity |
| 215322_at | 0.000024 | 2.27 | AL080190 | MRNA; cDNA DKFZp434A202 (from clone DKFZp434A202) | --- | --- | --- |
| 215435_at | 0.000022 | 2.04 | AK021983 | --- | --- | --- | --- |
| 216016_at | 0.000219 | 2.37 | AK027194 | cold autoinflammatory syndrome 1 | CIAS1 | chr1q44 | --- |
| 221345_at | 0.001800 | 2.18 | NM_005306 | G protein -coupled receptor 43 | GPR43 | chr19q13.1 | rhodopsin -like receptor activity |
| 222303_at | 0.000001 | 2.82 | --- |
We then evaluated whether the changes in clinical (i.e., skin lesion status) and biochemical (i.e., urinary As) endpoints in the trial had any relationship with gene expression. The skin lesion status, defined by a quantitative score based on grading, improved only in 3 of the 14 individuals included in the present study (Verret et al. 2005). We compared the baseline gene expression data of those three individuals with the remaining 11 participants but did not identify any differentially expressed genes. Comparison of the post-selenium supplementation gene expression data of those three individuals with the remaining 11 also did not reveal any differential gene expression.
We further analyzed the gene expression data according to the change in creatinine-adjusted urinary As concentration over the six-month treatment period. Individuals with an overall decrease in urinary As concentration over the six-month period (pre-supplementation concentration minus post-supplementation concentration > 0) were designated as Group 1 (Gr. 1) and, individuals with an overall increase in urinary As concentration over the six-month period (pre-supplementation concentration minus post-supplementation concentration < 0) were designated as Group 2 (Gr. 2). In Gr. 1 (n=9), the pre- and post-supplementation creatinine-adjusted urinary As concentrations (mean ± SD) were 222.7 μg/g ± 98.9 and 159.6 μg/g ± 72.1, respectively. In Gr. 2 (n=5), the pre- and post-supplementation urinary As concentrations corrected for urinary creatinine were 163.9 μg/g ± 95.3 and 222.4 μg/g ± 125.0, respectively. We examined differential expression between pre- and post-supplementation samples for these two groups separately. Data using the PLIER method are shown. Analysis of Gr. 1 alone generated a list of 26 probes differentially expressed in between pre- and post-supplementation samples. Pre- and post-supplementation paired comparison in Gr. 2 generated a list of 10 probes that were differentially expressed. Figure 2E shows the Venn-diagram of the overlap of differentially expressed genes generated from the Gr. 1 alone, Gr. 2 alone, and combined analyses. From Gr. 1 analysis, there were 14 probes covering 4 known genes (IL1B, KLF12, TRA2A and CIAS1) overlapping with the combined analysis, that were differentially expressed. These genes were not shared by Gr. 2. Differential expression of these genes after selenium therapy may partly be related to the slight decrease in urinary arsenic. Similarly, there were five probes covering four genes differentially expressed only in Gr. 2 (IL8, CXCL1, ZNF91, and G0S2), possibly partly related to increase in urinary arsenic and there were five additional genes differentially expressed in both the groups (Gr. 1 and Gr. 2) - IER3, MGC12815, TNF, CXCL2 and SOD2, possibly exclusively related to selenium induced up-regulation.
We compared the pre-treatment gene expression data of Gr. 1 and Gr. 2 to identify differentially expressed genes which might predict decrease in urinary As after selenium supplementation, but did not find any differential expression. Similarly, we also compared the post-treatment gene expression data of Gr. 1 and Gr. 2 and did not find any differential gene expression in relation to urinary As change.
Network analysis
Many of the differentially expressed genes may interact in biological pathways induced by selenium therapy. Therefore, to explore biologically relevant genetic networks, MedScan search was utilized with the ResNet database covering more than 50,000 gene-gene or protein-protein connections. As shown in Figure 3A, 11 of the 28 common differentially expressed genes were found to have direct interconnections. For each gene in the network, a network neighborhood was defined containing the gene and all its directly interacting partners. TNF, IL1B, IL8 and SOD2 were identified as key players in the network. Additionally, TNF was found to have regulatory or expression effects on all other genes in the network (Arlt et al. 2001; Breviario et al. 1992; Nirodi et al. 2001; O’Connor et al. 2003; Rogers et al. 2001; Vlahopoulos et al. 1999; Wang et al. 2000) and IL1B to have effects on 8 genes (Bethea et al. 1992; Hua and Lee 2000; Kayanoki et al. 1994; Ohno et al. 1997).
Figure 3.
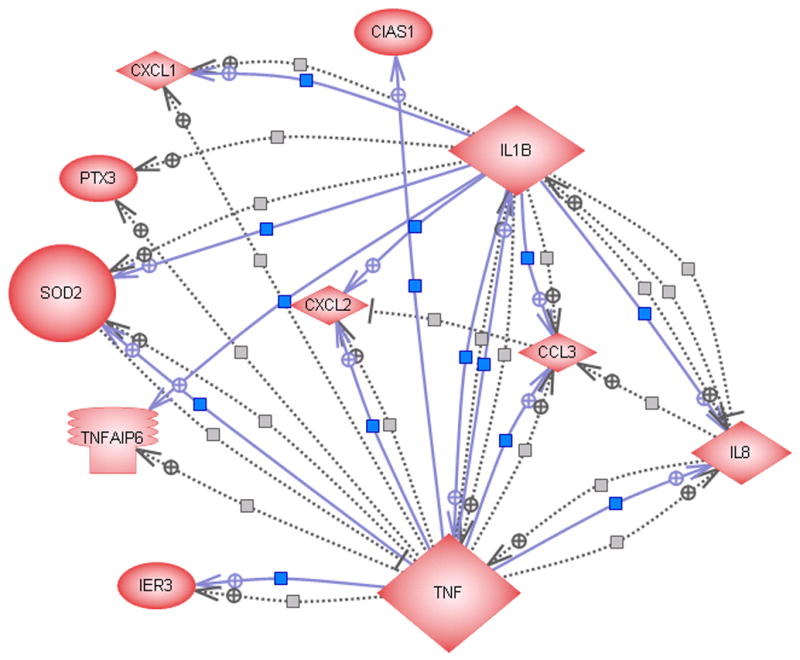
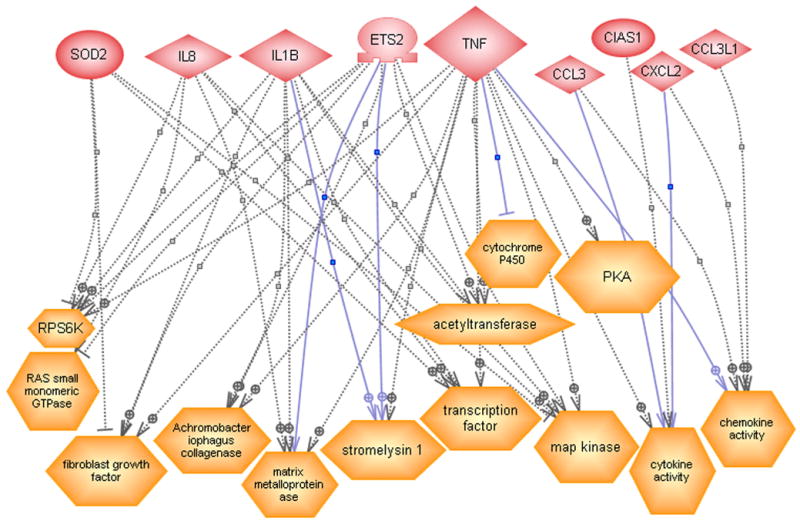
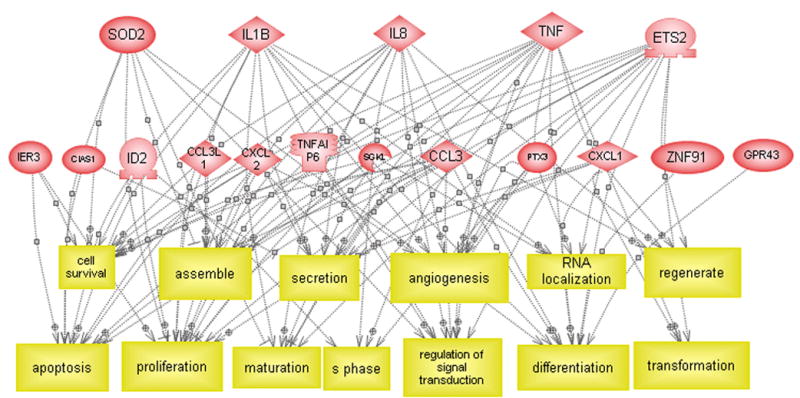
(A) Direct interactions between some of the differentially expressed genes. The solid and dashed lines indicate expression and regulatory functions respectively. (B) Regulatory effect of some of the differentially expressed genes on functional classes. (C) Regulatory effect of some of the differentially expressed genes on cell processes.
Figure 3B shows the regulatory effects of the significantly differentially expressed genes on common functional classes. We found that nine of these genes, presented on the upper part of the Figure 3B, may regulate 13 functional classes as shown in lower part of Figure 3B. Among those are fibroblast growth factor (Isumi et al. 1998), collagenase (Alvaro-Gracia et al. 1990; Boyd and Farnham 1999; Brenner et al. 1989; Mauviel et al. 1996; Tamura 1991), matrix metalloproteinase (Li et al. 2003; Oriente et al. 2000; Song et al. 2003), stromelysin 1 (Boyd and Farnham 1999; DiBattista et al. 1994; Jayaraman et al. 1999; Rogers et al. 2001) all of which may exert effect on skin lesion. Other functional classes include Protein Kinase A (PKA) (May et al. 1998), cytochrome P450, transcription factor (Borrello and Demple 1997), chemokine activity and cytokine activity, etc (Graness et al. 2002).
In the ResNet database, we also looked at the possible regulatory effects of the differentially expressed genes on cellular processes (see Figure 3C). Thirteen differentially expressed genes were found to have regulatory effect on 13 cellular processes including apoptosis (Garcia et al. 2002; Sevilla et al. 2001; Terui et al. 1998; Weinmann et al. 1999), proliferation (Terui et al. 1998), maturation and others. TNF and ETS2 had possible regulation on all the 13 cellular processes; IL8 and IL1B had possible regulation on 11 of them and SOD2 on seven cellular processes.
Confirmation of microarray results by RT-PCR
Figure- 4 shows the result from relative quantification of gene expression using quantitative RT-PCR experiment. Left half of the Figure 4 shows the RT-PCR result of seven genes that we found to be up-regulated after selenium supplementation in microarray platform and the right half of figure 4 shows that of 4 genes which were not found to be differentially expressed after selenium supplementation in microarray. From Figure 4, it is evident that six genes (CXCL2, IL1beta, IL8, PTX3, TNF and TNF-AIP6) out of seven were significantly up regulated in RT-PCR experiment and confirmed the microarray results. Similarly it also shows that the genes which were not differentially expressed in microarray (right half of Figure 4), were also not differentially expressed in RT-PCR experiment.
Figure 4.
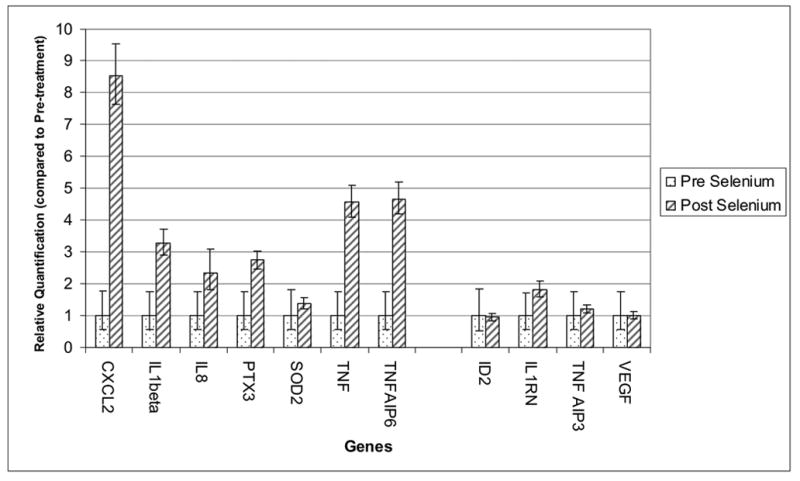
Relative quantification (RQ) of gene expression using Real-Time Quantitative PCR. X-axis shows the genes and Y-axis represents corresponding RQ of gene expression compared to pre-treatment stage, expression of which is set to 1. The vertical error bars represent 95% confidence intervals of the RQ values.
DISCUSSION
The present study evaluated genome-wide differential gene expression induced by selenium-supplementation in individuals with As-induced skin lesions who had been chronically exposed to As-contaminated groundwater.
Selenium has been shown to be effective in reducing the incidence of cancer in animal models and human clinical trials (El-Bayoumy and Sinha 2005; Ip et al. 2002; Milner et al. 2001; Yoshizawa et al. 1998), but the molecular basis of selenium remained unclear. This issue has been recently reviewed extensively (El-Bayoumy and Sinha 2005). In the mouse model, there is experimental evidence that selenium induces genes involved in cell cycle, apoptosis, transcription and immune/inflammatory response (Novoselov et al. 2005). The present study in humans, also demonstrated molecular mechanism of selenium induced effect on genes related to apoptosis (TNF, IL1B, IL8, SOD2, ETS2, ID2, CXCL2, CCL3, IER3), transcription factor (TNF, IL1B, IL8, SOD2) and immune/inflammatory response (CCL3, CCL3L1, CXCL2, CIAS1, TNF).
Although preliminary and needs further investigations, our pilot study identified a number of differentially expressed genes that may elucidate the biological basis of potentially beneficial effects of selenium supplementation among individuals with As-induced skin lesions. Four of the genes (SOD2, TNF, IL1B and IL8) found to be up-regulated after selenium therapy in the present study, have documented regulatory effects on four cellular components – mitochondrial membrane, tight junction, matrix and collagen. Up-regulation of SOD2 increases mitochondrial membrane potential (Goering et al. 2001). TNF-alpha can specifically down-regulate the tight junction (Schulzke et al. 1998). TNF-alpha stimulates degeneration of extracellular matrix by inducing the expression of MMP 1 and stromelysin 1 (MMP 3) by fibroblast (Reunanen et al. 1998; Shalom-Barak et al. 1998). There is in vitro evidence that IL1B and TNF-alpha decreases collagen synthesis and activate metalloproteinase activity that degrade collagen (Cruwys et al. 1990; Siwik et al. 2000). TNF is also found to inhibit the type I collagen gene (Brenner et al. 1989). Both TNF and IL1B can increase the expression of SOD2 (Kayanoki et al. 1994; Rogers et al. 2001). IL8 increases the expression of TNF (Kampik et al. 2000). These provide the molecular basis for the potential beneficial effect of selenium on the regression of arsenic-induced skin lesion.
Recently, we conducted another study to examine differentially expressed genes among individuals with As-induced skin lesions as compared to individuals without such lesions (Argos et al. 2006). The top 50 differentially expressed genes were reported in that study. By applying identical methods of normalization and statistical comparisons used in the present study in that study population, we found 228 probes/genes to be down-regulated in skin-lesion individuals (data not shown). Using the list of 228 probes, we further compared the pre- and post-selenium supplementation gene expression data in the present study population. Interestingly, we observed that out of the 228 probes down-regulated in skin lesion individuals, 32 probes (covering 21 known genes), were up-regulated by at least 2.0 fold (with a FDR of 0.05) and 58 probes (covering 35 known genes) were up-regulated by at least 1.5 fold in response to six-months selenium supplementation in the present study. Among the genes down-regulated in arsenic-induced skin lesion patients, we found that 21 of those genes were up-regulated at least 2-fold and 35 were up-regulated by at least 1.5 fold, after selenium therapy in the present study. Biological Network analysis of those 35 genes (1.5 fold up-regulated) also suggested the effect on the following same targets - collagen, matrix, tight junction and mitochondrial membrane. These findings may support the rationale of selenium supplementation for arsenical skin lesion cases.
In yeast, As has been shown to channel sulfur into glutathione, which then leads to indirect oxidative stress by depleting glutathione pools (Haugen et al. 2004). In human, we found that As exposure down-regulated oxidative stress related gene SOD2 (Argos et al. 2006) and here we show that selenium therapy, in As-induced skin lesion patients, up-regulated the SOD2 gene.
There are some limitations of the study that should be noted. First, one must keep in mind that the gene expression changes following selenium supplementation were observed in PBMC in this study and not directly in target skin tissue which is the commonest site of arsenic-induced carcinogenesis. PBMC may not be perfect surrogate marker for As-induced skin lesion, but that was readily available. In future, we plan to investigate the gene expression changes in skin biopsy samples. Second, in the absence of comparison of pre- and post-treatment samples of the placebo group, it is difficult to rule out the possibility of other external factors such as seasonal variation or inflammatory processes that may have contributed to differential gene expression. In future studies, we plan to analyze gene expression profiles among individuals in the placebo arm (before and after receiving placebo) for further confirmation of these findings. Third, the short-term follow-up and limited sample size of the present study did not allow us to look at the prognostic significance of the differential gene expression on visible skin lesion change. Comparison of the three study subjects with modest clinical improvements with the remaining subjects without such improvements did not reveal any significantly differentially expressed genes. It is possible that use of more definitive measures of clinical improvements, e.g., progression to NMSC (rather than improvements in skin lesions) may allow such evaluations more appropriate and feasible. Finally, the current study was restricted only among male smokers to minimize impact of subject heterogeneity, thereby limiting the generalizability of the study findings. Clearly, larger and longer-term studies with more definitive clinical endpoints are needed to examine the clinical significance of the gene expression changes and the generalizability of these findings. We are currently conducting a large scale (N=5,000) placebo-controlled randomized trial with five-year selenium and vitamin E supplementations to examine cancer and mortality endpoints which would allow us to address these issues more definitively.
There are several advantages to the design and analysis of the present study. First, to minimize the influence of extraneous factors, we kept our study population relatively homogenous with regard to age, gender, and smoking status. Second, we also used three different normalization methods of gene expression data to strengthen confidence in the list of differentially expressed genes selected. Third, we have also confirmed some of the main results from microarray experiments by RT-PCR method.
In conclusion, by comparing genome-wide gene expression data in arsenic-induced skin lesion patients before and after selenium supplementation, we identified a number of biologically-relevant, differentially expressed genes that may be induced by selenium. These selenium-induced gene expression changes are in opposite direction to the changes seen among the As-induced skin lesion individuals compared to those without, as we previously observed in different set of individuals in this population. These findings may suggest some potential benefit of selenium therapy in patients with premalignant As-induced skin lesions.
Acknowledgments
This research was supported by U.S. National Institute of Environmental Health Sciences Grants P42 ES10349 and P30 ES09089, and National Institutes of Health Grants R01 CA107431 and R01 CA102484. We would like to thank our staff, field workers and study participants in Bangladesh without whom this work would have been impossible.
Abbreviations
- As
Arsenic
- NMSC
non-melanocytic skin cancers
- SCC
squamous cell carcinoma
- BCC
basal cell carcinoma
- ROS
reactive oxygen species
- PBMC
peripheral blood mononuclear cells
- FDR
false discovery rate
- Reunanen et al
Robust Multi-chip Analysis
- PLIER
Probe Logarithmic Intensity Error
Footnotes
Publisher's Disclaimer: This is a PDF file of an unedited manuscript that has been accepted for publication. As a service to our customers we are providing this early version of the manuscript. The manuscript will undergo copyediting, typesetting, and review of the resulting proof before it is published in its final citable form. Please note that during the production process errors may be discovered which could affect the content, and all legal disclaimers that apply to the journal pertain.
References
- Affymetrix. Affymetrix GeneChip Expression analysis technical manual. Santa Clara, CA: Affymetrix; 2001. [Google Scholar]
- Alain G, Tousignant J, Rozenfarb E. Chronic arsenic toxicity. Int J Dermatol. 1993;32(12):899–901. doi: 10.1111/j.1365-4362.1993.tb01413.x. [DOI] [PubMed] [Google Scholar]
- Alvaro-Gracia JM, Zvaifler NJ, Firestein GS. Cytokines in chronic inflammatory arthritis. V. Mutual antagonism between interferon-gamma and tumor necrosis factor-alpha on HLA-DR expression, proliferation, collagenase production, and granulocyte macrophage colony-stimulating factor production by rheumatoid arthritis synoviocytes. J Clin Invest. 1990;86(6):1790–1798. doi: 10.1172/JCI114908. [DOI] [PMC free article] [PubMed] [Google Scholar]
- Amundson SA, Bittner M, Chen Y, Trent J, Meltzer P, Fornace AJ., Jr Fluorescent cDNA microarray hybridization reveals complexity and heterogeneity of cellular genotoxic stress responses. Oncogene. 1999;18(24):3666–3672. doi: 10.1038/sj.onc.1202676. [DOI] [PubMed] [Google Scholar]
- Argos M, Kibriya MG, Parvez F, Jasmine F, Rakibuz-Zaman M, Ahsan H. Gene expression profiles in peripheral lymphocytes by arsenic exposure and skin lesion status in a Bangladeshi population [accepted for publication] Cancer Epidemiol Biomarkers Prev. 2006 doi: 10.1158/1055-9965.EPI-06-0106. [DOI] [PubMed] [Google Scholar]
- Arlt A, Grobe O, Sieke A, Kruse ML, Folsch UR, Schmidt WE, et al. Expression of the NF-kappa B target gene IEX-1 (p22/PRG1) does not prevent cell death but instead triggers apoptosis in Hela cells. Oncogene. 2001;20(1):69–76. doi: 10.1038/sj.onc.1204061. [DOI] [PubMed] [Google Scholar]
- Benjamini Y, Yekutieli D. Quantitative trait Loci analysis using the false discovery rate. Genetics. 2005;171(2):783–790. doi: 10.1534/genetics.104.036699. [DOI] [PMC free article] [PubMed] [Google Scholar]
- Bethea JR, Gillespie GY, Benveniste EN. Interleukin-1 beta induction of TNF-alpha gene expression: involvement of protein kinase C. J Cell Physiol. 1992;152(2):264–273. doi: 10.1002/jcp.1041520207. [DOI] [PubMed] [Google Scholar]
- Borrello S, Demple B. NF kappa B-independent transcriptional induction of the human manganous superoxide dismutase gene. Arch Biochem Biophys. 1997;348(2):289–294. doi: 10.1006/abbi.1997.0355. [DOI] [PubMed] [Google Scholar]
- Boyd KE, Farnham PJ. Identification of target genes of oncogenic transcription factors. Proc Soc Exp Biol Med. 1999;222(1):9–28. doi: 10.1111/j.1525-1373.1999.09992.x. [DOI] [PubMed] [Google Scholar]
- Brenner DA, O’Hara M, Angel P, Chojkier M, Karin M. Prolonged activation of jun and collagenase genes by tumour necrosis factor-alpha. Nature. 1989;337(6208):661–663. doi: 10.1038/337661a0. [DOI] [PubMed] [Google Scholar]
- Breviario F, d’Aniello EM, Golay J, Peri G, Bottazzi B, Bairoch A, et al. Interleukin-1-inducible genes in endothelial cells. Cloning of a new gene related to C-reactive protein and serum amyloid P component. J Biol Chem. 1992;267(31):22190–22197. [PubMed] [Google Scholar]
- Cruwys SC, Davies DE, Pettipher ER. Co-operation between interleukin-1 and the fibrinolytic system in the degradation of collagen by articular chondrocytes. Br J Pharmacol. 1990;100(3):631–635. doi: 10.1111/j.1476-5381.1990.tb15858.x. [DOI] [PMC free article] [PubMed] [Google Scholar]
- DiBattista JA, Martel-Pelletier J, Fujimoto N, Obata K, Zafarullah M, Pelletier JP. Prostaglandins E2 and E1 inhibit cytokine-induced metalloprotease expression in human synovial fibroblasts. Mediation by cyclic-AMP signalling pathway. Lab Invest. 1994;71(2):270–278. [PubMed] [Google Scholar]
- El-Bayoumy K, Sinha R. Molecular chemoprevention by selenium: A genomic approach. Mutat Res. 2005;591(1–2):224–236. doi: 10.1016/j.mrfmmm.2005.04.021. [DOI] [PubMed] [Google Scholar]
- Garcia J, Ye Y, Arranz V, Letourneux C, Pezeron G, Porteu F. IEX-1: a new ERK substrate involved in both ERK survival activity and ERK activation. Embo J. 2002;21(19):5151–5163. doi: 10.1093/emboj/cdf488. [DOI] [PMC free article] [PubMed] [Google Scholar]
- Goering E, Gold S, Schutz G. HoFe - Garnet soft XMCD measurements below and above the compensation temperature. J Synchrotron Radiat. 2001;8(Pt 2):422–424. doi: 10.1107/s0909049500018355. [DOI] [PubMed] [Google Scholar]
- Graness A, Chwieralski CE, Reinhold D, Thim L, Hoffmann W. Protein kinase C and ERK activation are required for TFF-peptide-stimulated bronchial epithelial cell migration and tumor necrosis factor-alpha-induced interleukin-6 (IL-6) and IL-8 secretion. J Biol Chem. 2002;277(21):18440–18446. doi: 10.1074/jbc.M200468200. [DOI] [PubMed] [Google Scholar]
- Haugen AC, Kelley R, Collins JB, Tucker CJ, Deng C, Afshari CA, et al. Integrating phenotypic and expression profiles to map arsenic-response networks. Genome Biol. 2004;5(12):R95. doi: 10.1186/gb-2004-5-12-r95. [DOI] [PMC free article] [PubMed] [Google Scholar]
- Hochberg Y, Benjamini Y. More powerful procedures for multiple significance testing. Stat Med. 1990;9(7):811–818. doi: 10.1002/sim.4780090710. [DOI] [PubMed] [Google Scholar]
- Hua LL, Lee SC. Distinct patterns of stimulus-inducible chemokine mRNA accumulation in human fetal astrocytes and microglia. Glia. 2000;30(1):74–81. doi: 10.1002/(sici)1098-1136(200003)30:1<74::aid-glia8>3.0.co;2-c. [DOI] [PubMed] [Google Scholar]
- Ip C, Dong Y, Ganther HE. New concepts in selenium chemoprevention. Cancer Metastasis Rev. 2002;21(3–4):281–289. doi: 10.1023/a:1021263027659. [DOI] [PubMed] [Google Scholar]
- Irizarry RA, Hobbs B, Collin F, Beazer-Barclay YD, Antonellis KJ, Scherf U, et al. Exploration, normalization, and summaries of high density oligonucleotide array probe level data. Biostatistics. 2003;4(2):249–264. doi: 10.1093/biostatistics/4.2.249. [DOI] [PubMed] [Google Scholar]
- Isumi Y, Minamino N, Katafuchi T, Yoshioka M, Tsuji T, Kangawa K, et al. Adrenomedullin production in fibroblasts: its possible function as a growth regulator of Swiss 3T3 cells. Endocrinology. 1998;139(5):2552–2563. doi: 10.1210/endo.139.5.6004. [DOI] [PubMed] [Google Scholar]
- Jayaraman G, Srinivas R, Duggan C, Ferreira E, Swaminathan S, Somasundaram K, et al. p300/cAMP-responsive element-binding protein interactions with ets-1 and ets-2 in the transcriptional activation of the human stromelysin promoter. J Biol Chem. 1999;274(24):17342–17352. doi: 10.1074/jbc.274.24.17342. [DOI] [PubMed] [Google Scholar]
- Kampik D, Schulte R, Autenrieth IB. Yersinia enterocolitica invasin protein triggers differential production of interleukin-1, interleukin-8, monocyte chemoattractant protein 1, granulocyte-macrophage colony-stimulating factor, and tumor necrosis factor alpha in epithelial cells: implications for understanding the early cytokine network in Yersinia infections. Infect Immun. 2000;68(5):2484–2492. doi: 10.1128/iai.68.5.2484-2492.2000. [DOI] [PMC free article] [PubMed] [Google Scholar]
- Kayanoki Y, Fujii J, Suzuki K, Kawata S, Matsuzawa Y, Taniguchi N. Suppression of antioxidative enzyme expression by transforming growth factor-beta 1 in rat hepatocytes. J Biol Chem. 1994;269(22):15488–15492. [PubMed] [Google Scholar]
- Kessel M, Liu SX, Xu A, Santella R, Hei TK. Arsenic induces oxidative DNA damage in mammalian cells. Mol Cell Biochem. 2002;234–235(1–2):301–308. [PubMed] [Google Scholar]
- Li A, Dubey S, Varney ML, Dave BJ, Singh RK. IL-8 directly enhanced endothelial cell survival, proliferation, and matrix metalloproteinases production and regulated angiogenesis. J Immunol. 2003;170(6):3369–3376. doi: 10.4049/jimmunol.170.6.3369. [DOI] [PubMed] [Google Scholar]
- Liu F, Jan KY. DNA damage in arsenite- and cadmium-treated bovine aortic endothelial cells. Free Radic Biol Med. 2000;28(1):55–63. doi: 10.1016/s0891-5849(99)00196-3. [DOI] [PubMed] [Google Scholar]
- Liu SX, Davidson MM, Tang X, Walker WF, Athar M, Ivanov V, et al. Mitochondrial damage mediates genotoxicity of arsenic in mammalian cells. Cancer Res. 2005;65(8):3236–3242. doi: 10.1158/0008-5472.CAN-05-0424. [DOI] [PubMed] [Google Scholar]
- Livak KJS. Analysis of Relative Gene Expression Data Using Real-Time Quantitative PCR and the 2-ddCT Method. Methods. 2001;25:402–408. doi: 10.1006/meth.2001.1262. [DOI] [PubMed] [Google Scholar]
- Lynn S, Gurr JR, Lai HT, Jan KY. NADH oxidase activation is involved in arsenite-induced oxidative DNA damage in human vascular smooth muscle cells. Circ Res. 2000;86(5):514–519. doi: 10.1161/01.res.86.5.514. [DOI] [PubMed] [Google Scholar]
- Mauviel A, Chung KY, Agarwal A, Tamai K, Uitto J. Cell-specific induction of distinct oncogenes of the Jun family is responsible for differential regulation of collagenase gene expression by transforming growth factor-beta in fibroblasts and keratinocytes. J Biol Chem. 1996;271(18):10917–10923. doi: 10.1074/jbc.271.18.10917. [DOI] [PubMed] [Google Scholar]
- May MJ, Wheeler-Jones CP, Houliston RA, Pearson JD. Activation of p42mapk in human umbilical vein endothelial cells by interleukin-1 alpha and tumor necrosis factor-alpha. Am J Physiol. 1998;274(3 Pt 1):C789–798. doi: 10.1152/ajpcell.1998.274.3.C789. [DOI] [PubMed] [Google Scholar]
- Milner JA, McDonald SS, Anderson DE, Greenwald P. Molecular targets for nutrients involved with cancer prevention. Nutr Cancer. 2001;41(1–2):1–16. doi: 10.1080/01635581.2001.9680606. [DOI] [PubMed] [Google Scholar]
- Nirodi C, NagDas S, Gygi SP, Olson G, Aebersold R, Richmond A. A role for poly(ADP-ribose) polymerase in the transcriptional regulation of the melanoma growth stimulatory activity (CXCL1) gene expression. J Biol Chem. 2001;276(12):9366–9374. doi: 10.1074/jbc.M009897200. [DOI] [PMC free article] [PubMed] [Google Scholar]
- Novoselov SV, Calvisi DF, Labunskyy VM, Factor VM, Carlson BA, Fomenko DE, et al. Selenoprotein deficiency and high levels of selenium compounds can effectively inhibit hepatocarcinogenesis in transgenic mice. Oncogene. 2005;24(54):8003–8011. doi: 10.1038/sj.onc.1208940. [DOI] [PubMed] [Google Scholar]
- O’Connor W, Jr, Harton JA, Zhu X, Linhoff MW, Ting JP. Cutting edge: CIAS1/cryopyrin/PYPAF1/NALP3/CATERPILLER 1.1 is an inducible inflammatory mediator with NF-kappa B suppressive properties. J Immunol. 2003;171(12):6329–6333. doi: 10.4049/jimmunol.171.12.6329. [DOI] [PubMed] [Google Scholar]
- Ohno Y, Lee J, Fusunyan RD, MacDermott RP, Sanderson IR. Macrophage inflammatory protein-2: chromosomal regulation in rat small intestinal epithelial cells. Proc Natl Acad Sci U S A. 1997;94(19):10279–10284. doi: 10.1073/pnas.94.19.10279. [DOI] [PMC free article] [PubMed] [Google Scholar]
- Oriente A, Fedarko NS, Pacocha SE, Huang SK, Lichtenstein LM, Essayan DM. Interleukin-13 modulates collagen homeostasis in human skin and keloid fibroblasts. J Pharmacol Exp Ther. 2000;292(3):988–994. [PubMed] [Google Scholar]
- Reunanen N, Westermarck J, Hakkinen L, Holmstrom TH, Elo I, Eriksson JE, et al. Enhancement of fibroblast collagenase (matrix metalloproteinase-1) gene expression by ceramide is mediated by extracellular signal-regulated and stress-activated protein kinase pathways. J Biol Chem. 1998;273(9):5137–5145. doi: 10.1074/jbc.273.9.5137. [DOI] [PubMed] [Google Scholar]
- Rogers RJ, Monnier JM, Nick HS. Tumor necrosis factor-alpha selectively induces MnSOD expression via mitochondria-to-nucleus signaling, whereas interleukin-1beta utilizes an alternative pathway. J Biol Chem. 2001;276(23):20419–20427. doi: 10.1074/jbc.M008915200. [DOI] [PubMed] [Google Scholar]
- Roussel RR, Barchowsky A. Arsenic inhibits NF-kappaB-mediated gene transcription by blocking IkappaB kinase activity and IkappaBalpha phosphorylation and degradation. Arch Biochem Biophys. 2000;377(1):204–212. doi: 10.1006/abbi.2000.1770. [DOI] [PubMed] [Google Scholar]
- Schulzke JD, Schmitz H, Fromm M, Bentzel CJ, Riecken EO. Clinical models of intestinal adaptation. Ann N Y Acad Sci. 1998;859:127–138. doi: 10.1111/j.1749-6632.1998.tb11117.x. [DOI] [PubMed] [Google Scholar]
- Sevilla L, Zaldumbide A, Carlotti F, Dayem MA, Pognonec P, Boulukos KE. Bcl-XL expression correlates with primary macrophage differentiation, activation of functional competence, and survival and results from synergistic transcriptional activation by Ets2 and PU.1. J Biol Chem. 2001;276(21):17800–17807. doi: 10.1074/jbc.M008270200. [DOI] [PubMed] [Google Scholar]
- Shalom-Barak T, Quach J, Lotz M. Interleukin-17-induced gene expression in articular chondrocytes is associated with activation of mitogen-activated protein kinases and NF-kappaB. J Biol Chem. 1998;273(42):27467–27473. doi: 10.1074/jbc.273.42.27467. [DOI] [PubMed] [Google Scholar]
- Shi H, Hudson LG, Ding W, Wang S, Cooper KL, Liu S, et al. Arsenite causes DNA damage in keratinocytes via generation of hydroxyl radicals. Chem Res Toxicol. 2004;17(7):871–878. doi: 10.1021/tx049939e. [DOI] [PubMed] [Google Scholar]
- Siwik DA, Chang DL, Colucci WS. Interleukin-1beta and tumor necrosis factor-alpha decrease collagen synthesis and increase matrix metalloproteinase activity in cardiac fibroblasts in vitro. Circ Res. 2000;86(12):1259–1265. doi: 10.1161/01.res.86.12.1259. [DOI] [PubMed] [Google Scholar]
- Smith AH, Lingas EO, Rahman M. Contamination of drinking-water by arsenic in Bangladesh: a public health emergency. Bull World Health Organ. 2000;78(9):1093–1103. [PMC free article] [PubMed] [Google Scholar]
- Song KS, Lee WJ, Chung KC, Koo JS, Yang EJ, Choi JY, et al. Interleukin-1 beta and tumor necrosis factor-alpha induce MUC5AC overexpression through a mechanism involving ERK/p38 mitogen-activated protein kinases-MSK1-CREB activation in human airway epithelial cells. J Biol Chem. 2003;278(26):23243–23250. doi: 10.1074/jbc.M300096200. [DOI] [PubMed] [Google Scholar]
- Soucy NV, Ihnat MA, Kamat CD, Hess L, Post MJ, Klei LR, et al. Arsenic stimulates angiogenesis and tumorigenesis in vivo. Toxicol Sci. 2003;76(2):271–279. doi: 10.1093/toxsci/kfg231. [DOI] [PubMed] [Google Scholar]
- Tamura M. [Regulation of collagenase gene expression in human osteosarcoma-derived osteoblastic cell lines] Kokubyo Gakkai Zasshi. 1991;58(1):284–299. doi: 10.5357/koubyou.58.284. [DOI] [PubMed] [Google Scholar]
- Terui Y, Ikeda M, Tomizuka H, Kasahara T, Ohtsuki T, Uwai M, et al. Activated endothelial cells induce apoptosis in leukemic cells by endothelial interleukin-8. Blood. 1998;92(8):2672–2680. [PubMed] [Google Scholar]
- Verret WJ, Chen Y, Ahmed A, Islam T, Parvez F, Kibriya MG, et al. A randomized, double-blind placebo-controlled trial evaluating the effects of vitamin E and selenium on arsenic-induced skin lesions in Bangladesh. J Occup Environ Med. 2005;47(10):1026–1035. doi: 10.1097/01.jom.0000183095.45050.97. [DOI] [PubMed] [Google Scholar]
- Vlahopoulos S, Boldogh I, Casola A, Brasier AR. Nuclear factor-kappaB-dependent induction of interleukin-8 gene expression by tumor necrosis factor alpha: evidence for an antioxidant sensitive activating pathway distinct from nuclear translocation. Blood. 1999;94(6):1878–1889. [PubMed] [Google Scholar]
- Wang W, Wang S, Yan L, Madara P, Del Pilar Cintron A, Wesley RA, et al. Superoxide production and reactive oxygen species signaling by endothelial nitric-oxide synthase. J Biol Chem. 2000;275(22):16899–16903. doi: 10.1074/jbc.M000301200. [DOI] [PubMed] [Google Scholar]
- Weinmann P, Gaehtgens P, Walzog B. Bcl-Xl- and Bax-alpha-mediated regulation of apoptosis of human neutrophils via caspase-3. Blood. 1999;93(9):3106–3115. [PubMed] [Google Scholar]
- Yoshizawa K, Willett WC, Morris SJ, Stampfer MJ, Spiegelman D, Rimm EB, et al. Study of prediagnostic selenium level in toenails and the risk of advanced prostate cancer. J Natl Cancer Inst. 1998;90(16):1219–1224. doi: 10.1093/jnci/90.16.1219. [DOI] [PubMed] [Google Scholar]


