

Abstract
We describe an improved artificial neural network (ANN)-based method for predicting peptide retention times in reversed phase liquid chromatography. In addition to the peptide amino acid composition, this study investigated several other peptide descriptors to improve the predictive capability, such as peptide length, sequence, hydrophobicity and hydrophobic moment, and nearest neighbor amino acid, as well as peptide predicted structural configurations (i.e., helix, sheet, coil). An ANN architecture that consisted of 1052 input nodes, 24 hidden nodes, and 1 output node was used to fully consider the amino acid residue sequence in each peptide. The network was trained using ~345,000 non-redundant peptides identified from a total of 12,059 LC-MS/MS analyses of more than 20 different organisms, and the predictive capability of the model was tested using 1303 confidently identified peptides that were not included in the training set. The model demonstrated an average elution time precision of ~1.5% and was able to distinguish among isomeric peptides based upon the inclusion of peptide sequence information. The prediction power represents a significant improvement over our earlier report (Petritis et al., Anal. Chem. 2003, 75, 1039–1048) and other previously reported models.
Introduction
The analysis of peptides (e.g. tryptically digested proteins) by on-line coupling of liquid chromatography (LC) with electrospray-mass spectrometry (ESI-MS) is presently the most common approach for characterizing complex proteomes. While several methods and software tools are available for identifying peptides/proteins from mass spectra, the high complexity of a digested proteome (containing thousands or even millions of detectable peptides) and the vastly larger number of possible peptide sequences makes accurate peptide/protein identification challenging; final results can include large numbers of false positive identifications.1
We have been working to make the use of supplementary information such as LC retention time to improve the confidence in peptide identifications, an approach also recently suggested by a group working to establish publication guidelines for peptide and protein identification.2 The use of peptide retention time information has proved useful in the past for LC method development of simple peptide mixtures,3, 4 purification of peptides of interest,4, 5 and identification of simple peptide mixtures in conjunction with UV and/or fluorescence and/or colorimetric methods of detection6.
Efforts to predict the chromatographic behavior of peptides on the basis of amino acid composition are not new. In 1951, Knight7 and Pardee8 showed that synthetic peptide retardation factors (Rf) in paper chromatography could be predicted with some accuracy. In 1952, Sanger9 demonstrated that peptides of the same amino acid composition, but different sequence, could frequently be separated. More recently, there have been several reports on the prediction of peptide elution times in reversed-phase (RP)10–15 and normal-phase16, 17 LC. Most of this reported work used the so-called “retention coefficient” approach, which is based on the summation of empirically determined amino acid residue retention coefficients. The assumption that the chromatographic behavior of peptides is mainly or solely dependent on amino acid composition holds up fairly well for small peptides (up to 15–20 residues), but is inadequate for proteomic applications e.g. involving tryptic peptides, where the practical upper limit can exceed 50 amino acid residues. Furthermore, with the retention coefficient approach, isomeric peptides are predicted to elute at the same time, which is not the case18–21.
Improving peptide retention time prediction in RPLC requires an understanding of the various factors affecting peptide retention. These factors have been thoroughly investigated, and it is now widely accepted that retention behavior of peptides in RPLC is governed by 1) amino acid composition,10–15 2) peptide length (or mass),13, 22–24 and 3) sequence-dependent effects.25–37 The third category can be further divided into nearest neighbor and conformation effects, where the former is defined to be amino acid sequence-dependent, but independent of peptide conformation.25 Mant et al.13 tried to improve peptide retention time prediction by extending the retention coefficient approach by including the peptide length. Krokhin et al.38 used separate retention coefficients for amino acids at the N-terminus of the peptide in addition to the peptide length, further improving the retention coefficient model. Liu et al.39 applied a support vector machine and the heuristic method to develop nonlinear and linear models between the capacity factor (logk) and seven peptide molecular constitutional and topological descriptors (i.e., number of single bonds, number of rings, etc.), but did not take into account peptide structure. Recently, Kaliszan and co-workers40, 41 used quantitative structure retention relationships (QSRR) to predict peptide retention times. Descriptors used to derive the necessary QSRR included the logarithm of the sum of retention times of the amino acids that composed the peptide, the logarithm of the Van der Waals volume of the peptide, and the logarithm of the peptide calculated n-octanol-water partition coefficient. Makrodimitris et al.42 used a mesoscopic simulation that employed Langevin dipoles on a lattice for the solvent and calculated partial charges for the solute to estimate free energies of adsorption from data on reversed-phase chromatography. The authors were able to predict the elution order of nine derivatized peptides that covered a wide range of structures. In 2003, we introduced an artificial neural networks (ANNs) method for predicting peptide elution times43 that was originally based on amino acid composition and later extended to include partial peptide sequence information.44
We have previously reported an accurate mass and time (AMT) tag proteomics approach that uses accurate mass measurements in conjunction with observed peptide retention time information to more confidently identify peptides. 45–48 Palmblad et al.49, 50 have more recently shown that retention time prediction can be combined with accurate mass measurements to improve proteomics measurements; however, their peptide elution time prediction error was high, possibly due to the limitations of the retention coefficient approach used. In various applications we have shown that when peptide retention time prediction was combined with peptide/protein identification programs such as SEQUEST, the number of false positive identifications could be decreased and/or the number of confident peptide identifications from LC-MS/MS experiments51–53 increased. Le Bihan et al.54 used peptide elution time prediction parameters to build an empirical model for predicting peptides that are likely to be observable by LC-MS/MS; the model was used for targeted mass spectrometric identification of low abundance proteins in complex protein samples. Kawakami et al.55 developed a program that validates peptide assignments based solely on the correlation between the measured and predicted LC elution time of each peptide. In a recent publication, Norbeck et al.56 demonstrated how accurate mass and normalized elution time (NET) information improved peptide identifications in the study of proteomes of high complexity. Such improvements can significantly extended the protein coverage of highly confident peptide identifications. Similarly, Cargile et al.57–59 demonstrated confident peptide identifications could be further enhanced by the application of information from isoelectric focusing fractionation as a first dimension in shotgun proteomics. The good correlations observed between predicted and experimental peptide pI values allowed pI information to be used as an additional filtering step to increase the confidence of peptide/protein identifications.
In the model development reported herein, we have explored various approaches for increasing peptide elution time prediction accuracy in RPLC. In addition to more complex ANN architectures, we examined several peptide physicochemical (peptide length, hydrophobicity, etc.) and sequence dependent parameters (peptide sequence, amphipathicity, nearest neighbor etc.) that have been shown to affect the peptide retention time in LC. The predictive capability of the model was evaluated by comparing it with several other previously described peptide retention time prediction models. The result shown here has been a significant improvement in predictive capability.
Experimental Section
Sample preparation of bacterial tryptic peptides
Peptide identifications from a number of different bacterial organisms and from an array of studies were used to train and test the ANN. Table 2 lists the bacteria and cites published studies providing the detailed sample preparation for each organism.60–70 In general, bacterial cells were cultured in tryptone, glucose, and yeast extract (TGY) medium to an approximate optical density of 600 nm and harvested by centrifugation at 10,000×g at 4°C. Prior to lysis, cells were resuspended and washed 3 times with 100 mM ammonium bicarbonate and 5 mM EDTA (pH 8.4). Cells were lysed by beating with 0.1-mm acid zirconium beads for three, 1-min cycles at 5000 rpm and incubated on ice for 5 min between each cycle. The supernatant containing soluble cytosolic proteins was recovered following centrifugation at 15,000×g for 15 min to remove cell debris. Proteins were denatured and reduced in 50 mM Tris buffer (pH 8.2), 8 M urea, 10 mM tributyl phosphine for 1 h at 37°C. The protein sample was diluted 10 times using 20 mM Tris buffer (pH 8.2) and then digested overnight at 37°C using sequencing grade, modified porcine trypsin (Promega, Madison, WI) at a trypsin:protein ratio of 1:50. The digests were purified using SPE C18 columns (Supelco, Bellefonte, PA) according to the manufacturer’s instructions and dried under vacuum.
Table 2.
Organisms from which the peptides were identified, number of LC-MS analyses for each organism, number of redundant peptides identified from each organism before any filtering and the last column shows the number of different peptides used from each organism after filtering with the criteria of Table 1. The references are meant to be representative of the samples and sample preparation methods for each organism; it should be noted that the peptide identifications for each organism may contain some quantity of samples and sample preparations that are currently unpublished
| Organism | # of LC-MS/MS runs | Total Peptide ID's | Unique filtered Peptides | Reference |
|---|---|---|---|---|
| Arabidopsis thaliana | 36 | 8,567 | 2,049 | Unpublished |
| Borrelia burgdorferi | 186 | 145,067 | 6,945 | Jacobs et al. 61 |
| Bovine serum albumin | 45 | 5,853 | 32 | N.A. |
| Cytomegalovirus | 125 | 88,166 | 3,342 | Varnum et al. 62 |
| Deinococcus radiodurans | 1,063 | 491,437 | 21,912 | Lipton et al. 63 |
| Desulfovibrio desulfuricans | 426 | 624,901 | 28,826 | Unpublished |
| Desulfovibrio vulgaris | 66 | 49,332 | 650 | In preparation |
| Escherchia coli | 16 | 7,247 | 126 | Unpublished |
| Geobacter metallireducens | 116 | 400,292 | 21,509 | Unpublished |
| Geobacter sulfurreducens | 791 | 909,730 | 26,446 | Ding et al. 64 |
| Homo sapiens | 1,254 | 523,142 | 31,505 | Liu et al. 65, Jacobs et al. 66 |
| Mus musculus | 697 | 570,471 | 34,579 | In preparation |
| Plasmodium falciparum | 21 | 73,421 | 7,059 | Unpublished |
| Protein standard mixture* | 1,067 | 1,183,116 | 1,154 | Purvine et al. 67 |
| Rhodobacter sphaeroides | 1,062 | 432,450 | 22,766 | Callister et al. 68 |
| Rhodopseudomonas palustris | 131 | 15,750 | 4,433 | Unpublished |
| Saccharomyces cerevisia | 606 | 286,528 | 12,035 | Prokisch et al. 69 |
| Salmonella typhi | 418 | 1,353,968 | 27,411 | In preparation |
| Salmonella typhimurium | 492 | 1,692,917 | 32,920 | Adkins et al. 70 |
| Shewanella oneidensis | 2,348 | 3,040,760 | 33,480 | Kolker et al. 71 |
| Synechocystis | 343 | 274,200 | 15,185 | In preparation |
| Vaccinia Virus | 13 | 27,298 | 1,546 | In preparation |
| Yersina pestis | 737 | 221,196 | 10,052 | In preparation |
| Total | 12,059 | 12,425,809 | 345,962 |
The protein standard mixture contains the same peptides and proteins as described by Purvine et al. 200466.
Preparation of Yeast (Saccharomycess cerevisiae) protein digests
Saccharomycess cerevisiae (ATCC 26108, Lot 137504) was grown in a batch shaker flask at 37 °C on yeast nitrogen base without amino acids. Media was prepared with the addition of 5 g/L glucose, and 5 g/L fructose. Cells were harvested at mid-logarithmic and stationary phases by centrifugation at 4000 rpm for 10 min. Cells were combined in a ratio of 1:3 stationary phase cells to mid-logarithm cells. Half of the cells were resuspended in 4 pellet volumes of a denaturation solution (7M urea, 2M thiourea, in 50 mM ammonium bicarbonate buffer, pH 7.8). Lysis was achieved by bead beating the cell mixture with 0.1 mm zirconia/silica beads in a mini-beadbeater (Biospec, Bartlesville OK) for 90 sec at 4500 rpm. Lysate was collected and placed immediately on ice to inhibit proteolysis. The other half of the cells were subjected to bead beating with a denaturation solution, in which thiourea was absent.
The lysates were reduced by adding neutralized Tris 2-carboxyethylphosphine (TCEP; Pierce, Rockford IL) to a final concentration of 5 mM and incubated for 30 min at 60°C. The lysates were then diluted 10-fold with 50 mM ammonium bicarbonate (pH 7.8), and 1 M calcium chloride was added to a final concentration of 1 mM. Proteolysis was achieved by adding sequencing grade modified trypsin (Promega, Madison, WI) in an approximate protease to lysate protein ratio of 1:50. The samples were digested for 5 hrs at 37°C. The lysate that contained no thiourea was alkylated by adding 195 mM iodoacetamide to a final concentration of 10 mM and incubated at room temperature for 30 min. Finally, the lysates were combined, and the peptides were desalted using Supelco (St. Louis, MO) Supelclean C-18 tubes with a Supelco vacuum manifold.
Preparation of mouse brain tissue and voxel samples
Brain tissue samples from C57BL/6J male mice were prepared as previously described.71 The samples were lysed in 80 μL of 5 mM PBS with 80 μL TFE with intermittent sonication in an ice-water bath. The lysate was reduced with 5 mM TBP and digested by trypsin overnight, and the digests were lyophilized immediately after digestion without further cleanup. Peptide samples were re-dissolved in 100 μL 50 mM NH4HCO3 and the peptide concentrations were measured by using the BCA protein assay.
Preparation of Human Mammalian Epithelial Cell (HMEC) protein digests
Samples were prepared as described previously65.
Nearest-neighbor effect
The simplest and most direct way of incorporating the nearest-neighbor effect of the 21 amino acids is to construct either a 21×21 or 21×21×21 dimensional array that include all 441 or 9261 possible combinations (i.e., AA, AC, AD, … or AAA, AAC, AAD,…), respectively. The bipeptides/tripeptides in a given peptide are either counted or structured in the ANN in the same way as they appear in the peptide sequence. Alternatively, it is possible to construct the nearest-neighbor list based on an amino acid property. The 21 amino acids can be divided on the basis of their side chain properties into 5 groups: 1) nonpolar aliphatic (AGILPV), 2) polar uncharged (CMNQST and Calkylated), 3) aromatic (FWY), 4) positively charged (HKR), and 5) negatively charged (DE). We used this alternative approach to obtain a reduced 5×5 dimensional nearest-neighbor array, which is optimal when the number of training peptides is not large enough.
Quasi-sequence-order approach
Due to the extremely large number of possible amino acid residue sequences, it is difficult to directly incorporate the amino acid sequence order effectively into a statistical prediction algorithm. As a result, we used the “quasi-sequence-order” approach, first introduced by Chou72, 73 to predict protein sub-cellular locations and attributes. The idea is to assume that the sequence order effect of L amino acids with the form a1a2a3a4a5⋯aL, can be approximately reflected through the following set of sequence-order-coupling factors:
| (1) |
where τ1 denotes the 1st-rank sequence-order coupling factor that reflects the sequence-order correlation among all the most contiguous residues along a peptide sequence, τ2 is the 2nd-rank sequence-order-coupling factor that reflects the sequence-order correlation between all the second most contiguous residues, and so forth; when λ ≥ L , we assign τλ = 0 . The correlation function is described by
| (2) |
where D(ai, aj) is the physicochemical evolution distance from amino acid ai to amino acid aj that was derived on the basis of the residue properties hydrophobicity, hydrophilicity, polarity and side-chain volume (see Table 1 of Schneider and Wrede74).
Table 1.
Filtering criteria (Xcorr thresholds) used to select development data. The criteria are different depending on the ion trap instrument, the charge state of the peptides and the peptide molecular weight (in the case of singly charged peptides no partially-tryptic peptides with MW<1000 were used).
| LCQ | LTQ | |||
|---|---|---|---|---|
| Charge State and MW | Partially-tryptic | Fully-tryptic | Partially-tryptic | Fully-tryptic |
| CS: +1, MW<1000 | NO | 1.6 | NO | 1.7 |
| CS: +1, MW>1000 | 2.8 | 2.2 | 2.9 | 2.3 |
| CS: +2 MW: any | 3 | 2.2 | 4.3 | 2.4 |
| CS: +3, MW: any | 3.7 | 2.9 | 4.7 | 3.2 |
Secondary structure contributions
To incorporate conformational information, that can influence chromatographic behavior, we introduced the predicted secondary structural contents (SSC) for each peptide. The SSC attempts to represent the percentage of a peptide’s residues that reside in a secondary structural state, e.g., α-helix, β-sheet, or coil. In this study, two different approaches were used to calculate the SSC. In the first approach, the SSC was predicted from the amino acid composition using the shared program SSCP.75 In the second approach, the SSC was converted from the secondary structure predicted by SSP, which makes use of profiles generated by the PSI-BLAST program. and the PSIPRED secondary structure prediction method of Jones.76 Generally, peptides with only sufficient lengths have secondary structures, so the SSP was employed for peptides with at least 15 amino acid residues. For those peptides with residues < 15, we arbitrarily treated them as coil.
Hydrophobic moment
A known phenomenon that causes retention time shifts for isomer peptides is the amphipathicity of the peptides. The amphiphilic helices are those in which one surface of each helix projects mainly hydrophilic side chains, while the opposite surface projects mainly hydrophobic side chains. To quantify the amphiphilicity of a helix, we applied the hydrophobic moment proposed by Eisenberg et al.77–79 The mean hydrophobic moment can be calculated for an amino acid sequence of N residues and their associated hydrophobicities Hn with the following equation:
| (3) |
A large value for < μH > equates to a large peptide amphipathicity.
Capillary LC coupled with ESI-MS
HPLC-grade water and acetonitrile were purchased from Aldrich (Milwaukee, WI). Fused-silica capillary columns (30–85 cm, 50 to150 μm i.d. x 180 to360 μm o.d., Polymicro Technologies, Phoenix, AZ) packed with 3.5-μm C18 Jupiter300 particles (Phenomenex, Torrance, CA) were manufactured in-house as described previously.80 Capillary RPLC was performed using an ISCO LC system (Model 100DM, ISCO, Lincoln, NE), and the mobile phases for the gradient elution consisted of (A) acetic acid/TFA/water (0.2:0.05:100 v/v) and (B) TFA/acetonitrile/water (0.1:90:10, v/v). The mobile phases were delivered at 5000 to 10000 psi, using two ISCO pumps to a stainless steel mixer (~2.5 mL), where they were mixed using a magnetic stirrer. The flow was split prior to entering the separation capillary to generate a non-linear (exponential) gradient81 and an analysis separation time of ~100 min. Fused-silica capillary flow splitters (various lengths) were used to control the gradient speed. Capillary RPLC was coupled on-line with MS through an ESI interface (a stainless steel union was used to connect the ESI emitter and the capillary separation column)81.
The peptide database was generated from analyses performed previously using several mass spectrometers, including 3.5, 7, 9, and 11.4 Tesla capillary LC-FTICR instruments (described elsewhere in detail82 and in references therein), an LTQ-FT (ThermoFinnigan San Jose, CA), and LCQ Duo, LCQ Deca, LCQ XP and LTQ (ThermoFinnigan, San Jose, CA) ion trap mass spectrometers. The ANN software NeuroWindows Version 4.5 (Ward Systems Group, USA) utilized a standard back propagation algorithm on a Pentium 3.0 GHz personal computer.
Results and Discussion
In this study, parameters that have been shown to affect the peptide retention time in LC were examined, in order to investigate their incorporation in approaches for improvement in the predictive capability of the model. Some of these values (i.e. hydrophobic moment, secondary structure etc) are calculated/predicted values, while others (i.e. length, sequence etc.) are known values -as long as the peptide identification is correct- that have been encoded in the model by using more complex artificial neural networks. In the case of full encoding of the peptide sequence, a large number of peptide identifications were necessary for the training set. As a result, for reasons described later, new filtering criteria for selection of the most confidently identified peptides as well as improved peptide LC elution time normalization procedures were needed.
Normalization of peptide LC elution times
The ANN and training algorithm employed for the present model development effort were described in our previous relevant work.43 Briefly, peptides identified from the radiation-resistant organism Deinococcus radiodurans (~7000 peptides) were used to train the ANN and peptides identified from the metal-reducing organism Shewanella oneidensis (~5200) were used to test it. A genetic algorithm developed to normalize the peptide elution times into a range (from 0 to 1) and correlate data sets enabled accurate comparison of numerous LC-MS datasets and improved the peptide elution time reproducibility to ~1%. This algorithm was based on a linear regression of a set of six peptides identified frequently in both organisms of the study 43 and normalized peptide elution times coming from both the same and different organisms.
While generating excellent results, this normalization approach became time prohibitive as the number of peptides used increased significantly. To train/test the present model, we employed confidently identified peptides from 22 different organisms, as well as a mixture of standard proteins/peptides,66 that provided a set of about 12 million peptides identifications. The time needed to normalize this set of peptide identifications using the genetic algorithm (described above) would be on the order of several weeks due to the many generations (iterations) required to align all analyses through multiple regressions.83, 84 Consequently, we revised the process to normalize each LC-MS/MS analysis independently by regressing all the observed peptide elution times in a given analysis against the predicted normalized elution time (NET) for the same peptides. Although we initially constructed the scale of predicted NET values by using the previously trained genetic algorithm, once the algorithm had been trained we were able to use the NET values predicted by this algorithm for LC-MS/MS alignment. The alignment of each LC-MS/MS dataset against the list of predicted NET values provided the means to convert the observed elution time for each peptide to an observed NET value on the basis of the relationship NETobserved = (slope × elution timeobserved) + intercept.
A step in the accurate mass and time (AMT) tag proteomics approach developed in our laboratory involves using peptide observations from multiple (and often extensive sets of) LC-MS/MS analyses of appropriately related samples45, 46 to create a reference database of accurate mass and observed LC NET values for each identified peptide. These AMT tags are used to identify peptides in subsequent high throughput LC-MS analyses of the same organism. For peptides observed in several LC-MS/MS analyses, the observed NET values are averaged, which provides statistics on the distribution of NET values for each peptide. In analyses by LC-MS, e.g., LC- Fourier transform ion cyclotron resonance (FTICR), data consist of a list of observed peptide “features,” wherein each feature consists of a monoisotopic mass (after collapse of the isotopic distribution for the peptide and subtraction of the proton(s) mass) and an observed elution time. To derive NET values for the detected features, we used an iterative process to regress the observed accurate mass and elution time against the computed masses and averaged observed NETs in the reference database. The regression residual converges when the observed accurate mass and elution time match their theoretical/predicted ones. The slope and intercept of the trend line are used for linear (regression)-based mapping of observed elution time to observed NET. Figure 1 shows some representative “real-world” data of the present normalization method applied to LC-FTICR experiments of mouse brain voxels. Fig. 1A depicts the base peak chromatograms of given mouse brain voxels from different spatial brain sections of the same mouse. The voxels 4B1 and 7E4 were analyzed by LC-FTICR-MS on the same day while the voxel B09 was analyzed 3 months later in a different chromatographic column of the same dimensions. Fig. 1B shows the correlations obtained when observed accurate mass and time are regressed against computed masses and average observed NET values form LC-MS/MS using an iterative process. Finally, Fig. 1C of this figure shows that the NETs of peptides in common among LC-FTICR analyses are highly correlated (R2>0.99), even for experiments that were performed three months apart. By normalizing the elution time of all peptides, we optimize the overall alignment of both LC-MS and LC-MS/MS datasets, an important step for more effective peptide identification45, 46 and quantitation using the AMT tag approach.85
Figure 1.
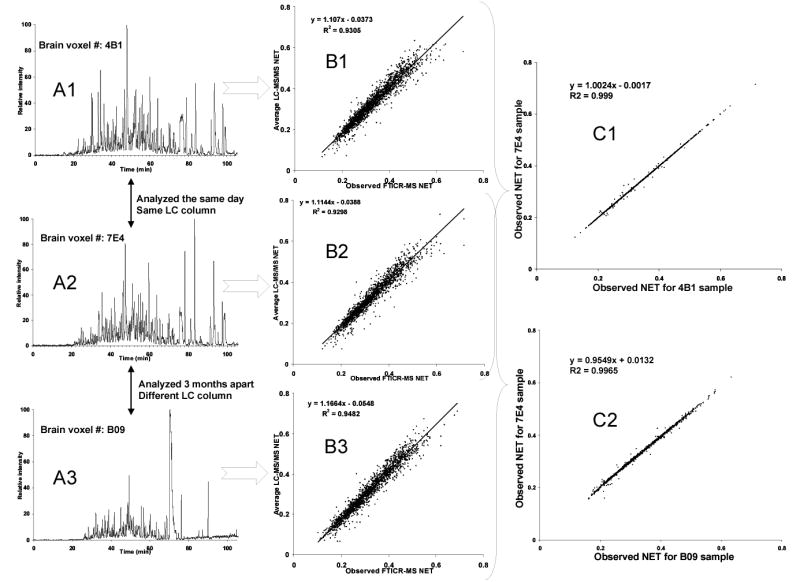
Schematic representation of the present study normalization method. (A1–3) The figure depicts the base peak chromatograms of given mouse brain voxels from different brain regions of the same mouse. The voxels 4B1 and 7E4 were analyzed by LC-FTICR MS on the same day and with the same chromatographic column. The voxels B09 was analyzed 3 months later using different chromatographic column (but having the same dimensions and chromatographic packing). (B1–3) Observed accurate mass and time are regressed against computed masses and average observed NET values from LC-MS/MS using an iterative process. The regression residual converges when the observed accurate mass and time match their theoretical/predicted ones. The slope and intercept of the trendline are used for the linear (regression) based mapping of observed elution time to observed NET (C1,2) These plots show the correlation of observed NET values for the peptides in common between different LC-FTICR MS analyses.
Peptide identification data for the training and testing of the artificial neural network model
Our earlier work43 was limited by both the uncertain levels of confidence associated with peptide identifications and the relatively small number of different peptides. However, by using different organisms to training and test the ANN model, we demonstrated that the earlier model was unbiased towards the peptides of a specific organism and therefore, peptides from any organism could be used to populate the training/testing database.
One of the main objectives of this study was to incorporate peptide sequence information into an ANN architecture, and it was evident from the start that a large training set would be required. Based on our experience, the best way to obtain a large number of new peptide structures was by analyzing different organisms. We eliminated the filtering requirement of ≥ 3 identifications per peptide so that peptides from “new” organisms (that had not been analyzed multiple times) were included in the dataset, and we also changed our filtering criteria. A peptide database of about 12 million redundant peptides identified by SEQUEST from LC-MS/MS analyses of tryptically digested proteomes for an array of organisms was assembled and used to calculate a new set of criteria that provided the best correlation between observed and predicted peptide NETs. A minimum of 5 amino acid residues was required for each peptide identification and the data were filtered to include only those peptides with Xcorr ≥ 1.5 for peptide mass <1000 Da and Xcorr ≥ 2.0 for peptide mass ≥ 1000 Da. The filtered peptides were separated into categories according to their charge (1+, 2+, 3+), tryptic state (fully and partial tryptic), and ion-trap MS analyzer (LCQ or LTQ). In the case of singly charged peptides, peptides were further categorized on the basis of mass, i.e., MW < 1000 Da and MW ≥ 1000.
For each category, we calculated the elution time prediction error vs. the different peptide Xcorr values by using one of our previously developed peptide elution time predictors44. Figure 2 illustrates these calculations for triply charged peptides, analyzed by LC-ion trap (LCQ) MS for fully and partial tryptic peptides. The Xcorr thresholds were set to values that provided good correlations between observed and predicted NETs. Table 1 summarizes the Xcorr threshold for each peptide category. Note that higher Xcorr threshold values were needed for the LTQ-based analyses than for the LCQ. This finding might be attributed to the better signal-to-noise ratios provided by LTQ mass spectrometers.86 For singly charged ions, lower Xcorr threshold values worked better with MW<1000 than with MW ≥ 1000. This finding may be potentially attributed to the known bias of the SEQUEST algorithm towards peptide mass.87
Figure 2.
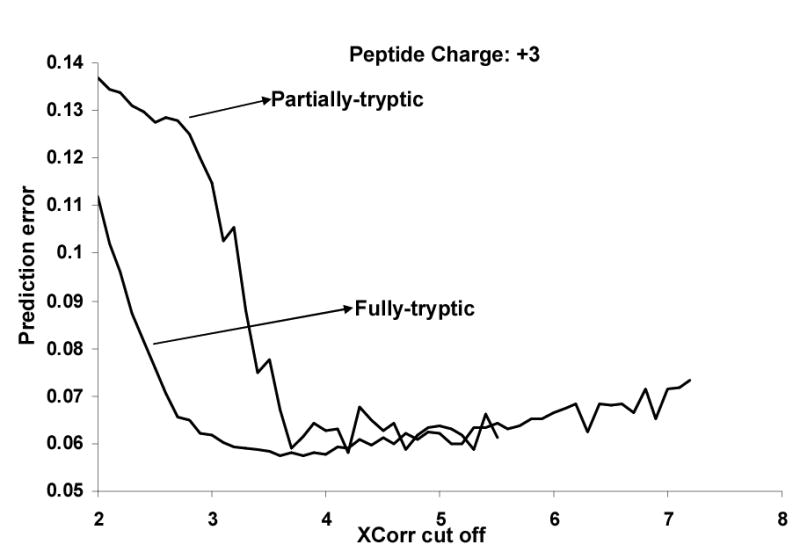
Peptide retention time prediction error distribution vs. peptide Xcorr values for partial and fully tryptic triply charged peptides run on a Thermo Finnigan LCQ ion trap. The filtering criteria given in Table 1 were generated from such plots.
Table 2 provides the organism from which peptides were identified, the number of LC-MS/MS analyses for each organism, the number of unfiltered redundant peptides identified from each organism, and the number of unique peptides identified from each organism after filtering with the criteria used to train/test our model (Table 1). Note that the 12,059 LC-MS analyses generated 345,965 unique filtered peptides for training/testing the present model.
Improvement of the peptide elution time prediction by incorporating peptide sequence and conformation information
Our previous ANN peptide elution time prediction model43 was based solely on amino acid composition, but had the added advantage over other similar models in that the ANN architecture could better handle non-linearities. To further improve the peptide elution time prediction, we explored incorporation of several sequence/structural peptide descriptors, including peptide length, sequence, predicted secondary conformation (i.e., helix, sheet, or coil), and hydrophobic moment. In addition to the 20 proteinogenic amino acids, we added alkylated cysteine, since cysteines are reduced and alkylated in most of our mammalian proteomic research.
The first peptide descriptors tested were length and hydrophobic moment. Added to our previous ANN architecture as two additional inputs, these descriptors provided a slight improvement in predictive capability. This improvement is evidenced by looking at the first four rows in Table 3, which show that the correlation between predicted and observed peptide elution time increased from 0.870 to 0.884. Next, we investigated the effect of incorporating peptide sequence into the model by using the quasi-sequence-order approach (see Experimental Section) to describe peptide sequence, and the results were compared with our previous ANN model.43 This approach did not provide any noticeable improvement over our previous model, so we searched for alternative approaches.
Table 3.
Improvement in peptide retention time prediction with implementation of sequence information, hydrophobic moment, and length of the peptide in the artificial neural network model. The encoding column refers to the number of amino acid residues defined in the beginning and end of each peptide. The hidden column refers to the number of hidden nodes in the ANN model. RMSE: Root mean square error.
| Encoding | Hidden | Length | Hydro.Moment | Train RMSE | Test RMSE | R-square |
|---|---|---|---|---|---|---|
| 0/0 | 4 | No | No | 0.050575 | 0.057994 | 0.87011 |
| 0/0 | 4 | No | Yes | 0.050504 | 0.057678 | 0.87135 |
| 0/0 | 4 | Yes | No | 0.048854 | 0.055177 | 0.87991 |
| 0/0 | 4 | Yes | Yes | 0.048153 | 0.05439 | 0.88385 |
| 1/1 | 6 | Yes | Yes | 0.044673 | 0.052086 | 0.8924 |
| 2/2 | 6 | Yes | Yes | 0.040411 | 0.045895 | 0.91632 |
| 3/3 | 7 | Yes | Yes | 0.038277 | 0.042905 | 0.92672 |
| 4/4 | 7 | Yes | Yes | 0.036746 | 0.040275 | 0.93542 |
| 5/5 | 10 | Yes | Yes | 0.035007 | 0.037347 | 0.94425 |
| 6/6 | 10 | Yes | Yes | 0.034179 | 0.036939 | 0.94502 |
| 7/7 | 12 | Yes | Yes | 0.033143 | 0.035445 | 0.94951 |
| 8/8 | 12 | Yes | Yes | 0.032658 | 0.034555 | 0.95196 |
| 9/9 | 14 | Yes | Yes | 0.031793 | 0.034251 | 0.95322 |
| 10/10 | 14 | Yes | Yes | 0.031223 | 0.033571 | 0.95477 |
| 11/11 | 16 | Yes | Yes | 0.031836 | 0.033811 | 0.95391 |
| 12/12 | 16 | Yes | Yes | 0.031482 | 0.033437 | 0.95504 |
| 25/25 | 24 | Yes | Yes | 0.02698 | 0.028579 | 0.96697 |
Our prediction models have encoded increasingly large quantities of peptide sequence information as the number of datasets grew significantly larger. While increasing the complexity of the ANN model, both in sequence information and number of hidden nodes, we carefully monitored the process to avoid “overfitting” by using cross-validation during the training process. All results presented here are from ANN models that were trained until both the training and cross-validation errors converged at their lowest values. Thus, early stopping was not necessary, and overfitting was avoided in the final ANN models presented.
Figure 3 shows a generic diagram of the new ANN architecture, illustrating how peptides were encoded. The new architecture contains 1052 input nodes, 24 hidden nodes, and 1 output node (referred to as model 1052-24-1). Each amino acid residue is coded as a 21-dimensional binary vector that consists of 20 zero values and 1 one value that corresponds to the amino acid residue occupying that position. The length and hydrophobic moment were used as normalized scalar values. In other words, the calculated values of length and hydrophobic moment were normalized to [0–1] ranges and incorporated in the ANN as numerical values.
Figure 3.
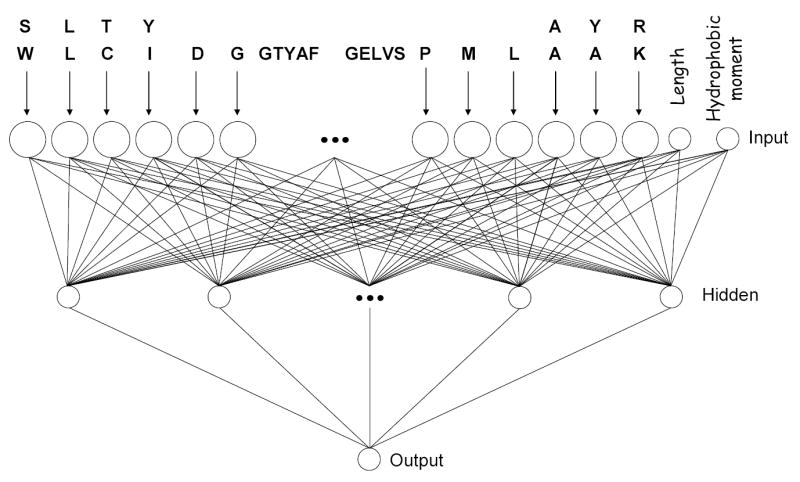
Schematic representation of the artificial neural network architecture used in this study (1052 input nodes, 24 hidden nodes and 1 output node). The large circles represent 21 length vectors while the smaller circles represent single scalar inputs. The small black circles (middle) are used to show continuance.
The amino acid residues were positioned in the ANN, starting from the N and C termini and working towards the center of the vector. Using the 7 residue peptide SLTYAYR as an example, the amino acid residues SLTY are positioned at the first 4×21 ANN inputs, and the amino acid residues AYR are positioned at the three last 3×21 ANN inputs, leaving the center filled with zero values. Only peptides with 50 amino acid residues fill all of the ANN inputs. Table 4 summarizes the number of times each amino acid residue appeared in different ANN positions. The last column of this Table shows the total number of amino acid residues in each position. From this column, readers can extrapolate statistics with regard to the lengths of the peptides in our training/testing database. Table 4 shows that with the exception of some zero values in the center, there are a significant number of residues per position, even for low abundant amino acid residues such as Cys and Trp. The same holds true for the 50th position, despite the obvious bias towards Lys and Arg as a result of trypsin, which was used for protein digestion. Furthermore, it should be noted that there are several peptides with Pro appearing as the first amino acid residue, despite the difficulty of trypsin to cleave KP or RP bonds.
Table 4.
Number of times each amino acid residue was found in different ANN vector positions.

The model was tested using 1303 (the highest confident identifications) of the 345,914 peptides identified from more than 90 different LC-MS/MS experiments. The other 344,611 peptides were used for training. Table 3 shows the improvements in peptide retention time prediction due to implementation of increased sequence information, hydrophobic moment, and length of the peptide in the ANN model. Using the same training and testing datasets with our previous ANN model43 (based solely on amino acid composition), we achieved a correlation coefficient of 0.87. The correlation increased to 0.967 when the full peptide sequence was encoded, and the length and hydrophobic moment were added. Most of the improvement was achieved when at least 5 amino acid residues were encoded from each side of the peptide (i.e., correlation coefficient increases to 0.944), after which the rate of the improvement slowed down. A number of hidden nodes were tested for each residue encoded until an optimal number was determined.
It should be noted that data acquired over ~3 years was used to provide sufficient peptide identifications to fully encode peptides of up to 50 amino acid residues. We first introduced the idea of using peptide sequence information in 2004 showing results for a database of about 98,000 peptides that allowed us to encode 12 amino acids residues at each peptide terminus44. We found that encoding amino acids residues that were close to N and C termini provided improved predictions compared to encoding amino acids residues located in the middle of the peptide as shown in Table 5. We did sensitivity analysis with the "perturb" method88 to determine how much each residue position affected the elution time. The method tests how much each input, if perturbed, change the output of the model, while the other inputs are fixed. We used the testing set of peptides as the fixed inputs to the model. Each input was tested for each peptide, and the sums of these tests were averaged so that the sets of twenty one consecutive inputs, representing each residue position, gave us a relative strength of that position. Sensitivity analysis shows that N and C terminus amino acid encoding is more important than the encoding of amino acids residues in the middle of the peptide. This may be because the amino acid residues at the termini of the peptides are more likely to interact with the stationary phase than amino acid residues in the middle of the peptide. Finally, sensitivity analysis shows that the incorporation of the length and hydrophobic moment in the model is not as important as the incorporation of the peptide sequence.
Table 5.
Sensitivity analysis88 of different variables used for the peptide elution time predictor
| Position | Sensitivity analysis |
|---|---|
| 1 | 0.1375 |
| 2 | 0.1708 |
| 3 | 0.1107 |
| Middle average | 0.0867 |
| n-2 | 0.1955 |
| n-1 | 0.1993 |
| n | 0.2562 |
| Length | 0.00521 |
| Hydrophobic moment | 0.00486 |
To further improve the model, peptide conformational effects were incorporated by adding predicted secondary peptide structural states (α-helix, β-sheet and coil). However, the addition of these predicted states75, 76 to both the present and earlier versions of the model did not improve the elution time prediction. A possible explanation is that the approaches used to calculate the peptide secondary structural states in this study failed to predict values that adequately simulate the medium that the peptides are dissolved in and their environment during the LC separation (i.e., water/acetonitrile/TFA/acetic acid, acidic pH, hydrophobic stationary phase). As a result, while these values might work for other applications, they failed to improve upon the present model.
Finally, we evaluated the incorporation of information on nearest-neighbors into the model. Several different approaches as described in the experimental section were investigated. The 5×5 dimensional nearest-neighbor list, which divided the amino acids according to their side chain properties, failed to provide any improvement in our present model, as well as the earlier model. When we incorporated the 21×21 dimensional nearest-neighbor list into our earlier model, we observed a significant improvement, i.e., the correlation between observed and predicted elution times increased from 0.87 to 0.91. However, this model was still inferior to the 1052-24-1 model that encodes only the peptide sequence. Fusion of the two models into a single ANN architecture overfits our training set (i.e., insufficient data for training) and would result in poor predictions. The 21×21×21 dimensional array also overfit our data. Contrary to our expectations, incorporation of the nearest neighbor effect into our model did not further improve the elution time predictability. We strongly suspect this is because the 1052-24-1 ANN architecture has already implicitly captured the nearest neighbor information.
In addition to better elution time predictions, the new 1052-24-1 ANN model is also able to more accurately predict isomeric peptide elution times, a capability that no previously published model has accomplished. Previously described predictors43, 89 were able to model separate LC elution times for isobaric peptides, but were unable to differentiate the elution times of isomeric peptides. Table 6 shows several examples of accurate predictions among isomeric/isobaric peptides. For example, the isobaric/isomeric peptides NLISKR, VILASGR, and AVGILSR have identical MW’s of 714.4435 and are indistinguishable by accurate mass measurements alone. However, because of their different elution times and the ability of the model to accurately predict these elution times, it is now possible to distinguish isobaric/isomeric peptides.
Table 6.
Predicted and observed Normalized Elution Time (NET) values of several isobaric/isomeric peptides.
| NET | ||||
|---|---|---|---|---|
| Peptide | MW | Predicted | Observed | Abs. error |
| VMAELK | 689.3829 | 0.137673 | 0.131735 | 0.005938 |
| MEVLAK | 689.3829 | 0.141518 | 0.14236 | 0.000842 |
| NLISLR | 714.4435 | 0.257648 | 0.225998 | 0.03165 |
| VILASGR | 714.4435 | 0.13171 | 0.142392 | 0.010682 |
| AVGILSR | 714.4435 | 0.184029 | 0.179694 | 0.004335 |
| IFEDVK | 749.4006 | 0.165442 | 0.164227 | 0.001215 |
| IEFVDK | 749.4006 | 0.182281 | 0.173211 | 0.00907 |
| FDVEIK | 749.4006 | 0.202775 | 0.191268 | 0.011508 |
| ELMLER | 789.4102 | 0.193284 | 0.193441 | 0.000157 |
| ELMELR | 789.4102 | 0.208153 | 0.20877 | 0.000617 |
| AMGVDVAK | 789.4102 | 0.127098 | 0.118302 | 0.008796 |
| LFQNDPTGR | 1046.519 | 0.133044 | 0.13235 | 0.000693 |
| FDGNPQTLR | 1046.519 | 0.152405 | 0.154723 | 0.002319 |
| IAFVSTESGNK | 1151.587 | 0.176421 | 0.169248 | 0.007173 |
| STIEGFVNASK | 1151.587 | 0.232176 | 0.229142 | 0.003034 |
| VLNESTILIFPK | 1372.801 | 0.376012 | 0.384751 | 0.008739 |
| VNFLPEIITLSK | 1372.801 | 0.426017 | 0.458545 | 0.032528 |
| TIGLGDAAVAEMIR | 1415.749 | 0.361089 | 0.390157 | 0.029068 |
| GTGLIAAIEMVADR | 1415.749 | 0.49876 | 0.482163 | 0.016598 |
| AGAPQSVDAPLGETVRK | 1694.9 | 0.18286 | 0.18352 | 0.00066 |
| KAGAPQSVDAPLGETVR | 1694.9 | 0.191434 | 0.19353 | 0.002096 |
| NAALPIFVSTILAPGLNEIR | 2108.204 | 0.563867 | 0.575534 | 0.011666 |
| NAALPVFISTILAPGLNEIR | 2108.204 | 0.591099 | 0.589784 | 0.001315 |
| IQALEDILDAEHPNWRER | 2204.102 | 0.372155 | 0.380546 | 0.008391 |
| ERIQALEDILDAEHPNWR | 2204.102 | 0.401762 | 0.408566 | 0.006804 |
| GNYAERVGAGAPVYMAAVLEYLTAEILELAGNAARDNKK | 4108.109 | 0.747845 | 0.750595 | 0.00275 |
| KGNYAERVGAGAPVYMAAVLEYLTAEILELAGNAARDNK | 4108.109 | 0.805271 | 0.839432 | 0.03416 |
| LKEISYIHAEAYAAGELKHGPLALIDADMPVIVVAPNNELLEK | 4654.476 | 0.508866 | 0.511891 | 0.003026 |
| EISYIHAEAYAAGELKHGPLALIDADMPVIVVAPNNELLEKLK | 4654.476 | 0.530865 | 0.543784 | 0.012919 |
Finally, Table 7 shows the present work has provided a significant improvement in the peptide elution time prediction errors compared with those of our previous ANN model, regardless the length of the peptide. Longer peptides (i.e., 11–40 amino acid residues) show a larger degree of improvement than do very small peptides. This observation is reasonable as the longer the peptide, the more it deviates from the simplistic assumption that elution time depends on the peptide amino acid composition. However, in spite of the improvements afforded by this study in predicting the elution times of longer peptides, smaller peptides are still predicted with higher precision. Continued population of our database with longer peptides (31–50 residues) will further improve their predicted NETs.
Table 7.
Average Mean Square Error (av MSE) of the peptide elution time prediction in relation to the peptide length.
| peptide length | peptides with that length | av. MSE (Petritis et al. 2003)43 | av MSE present study |
|---|---|---|---|
| 5–10 | 107 | 0.00072 | 0.00027 |
| 11–20 | 684 | 0.00240 | 0.00053 |
| 21–30 | 403 | 0.00503 | 0.00121 |
| 31–40 | 104 | 0.00592 | 0.00170 |
| 41–50 | 5 | 0.00447 | 0.00226 |
Comparison of peptide elution time prediction models
Several peptide elution time prediction models have been described in the past. However, all of them have used different sets of peptides to train their models and most of them did not use a separate set of peptides to test their model (i.e., the model was tested using the training set) making comparison difficult. Furthermore, many of the models used synthetic peptides for training and testing, while others used “real-world” data from mainly proteomic applications, where the potential of false positive identifications filtered through the training and testing set might have negatively affected the reported prediction capability.
For comparison, we decided to train and test several previously reported prediction models10, 13, 38, 40, 43 with the peptide dataset used in this study. Among the previously published peptide elution time predictors, we were unable to reproduce the study by Liu et al., 200439, as it used software unavailable to us for calculating peptide constitutional and topological descriptors. In addition, the study by Kaliszan et al. 200540 used HyperChem software to calculate the peptide hydrophobicity clogP and molecular volume VDWVol. We generated these values by using alternative published algorithms,90, 91 and our calculated values were similar to the Kaliszan values. The optimization for each model was accomplished by using genetic algorithms, which continued to optimize the variables in the algorithms to our data until the errors converged. A comprehensive table of the observed and predicted elution times obtained from the different predictors for the 1303 peptides of the testing test are provided as Supplementary Data.
Figure 4 shows the correlation coefficients between observed and predicted NETs from 5 previously reported models and the 1052-24-1 ANN model developed in this study. All previously described peptide elution time predictors yielded inferior correlations compared with the ANN-based elution time predictors. The best model developed by other workers (Krokhin et al.),38, 89 provides a correlation coefficient of 0.8435. In general, all of these models performed similarly, with correlation coefficients varying from 0.8156 to 0.8435. This similarity in performance can be expected as all the models were based on the retention coefficient approach.10 The Kaliszan et al. 200540 model provided only small improvements over the Meek model;10 as in our case, the genetic algorithm underweighted the clogP and VDWVol parameters. As expected, all models gave better correlations than the original Meek model10.
Figure 4.

Comparison of peptide retention time prediction for 6 different models. The diagrams show the predicted vs. observed normalized elution time correlations of each method for the 1303 confidently peptides identifications of the testing set.
Figure 5 shows the prediction error distribution of all the prediction models. Note that the current model has 50% of the peptides within ± 1.52% error and performs about 2-fold better than both our previously described model and any other described model. For all other models, 99% of the peptides were within about ±20% of their predicted values, while for our current model, 99% of the peptides were under ±10% of their predicted values, confirming the present model demonstrates a 2-fold improvement over all previously published models. Figures 4 and 5 indicate that this is the first major improvement in making more accurate peptide elution time predictions since the original work by Meek.
Figure 5.

Comparison of peptide retention time prediction for 6 different models. The diagram shows the prediction error distributions for 1303 confidently identified peptides. The method described in this study provides approximately 2-fold better predictions than previously described methods. ▴Present study, — Petritis et al. 2003, + Krokhin et al. 2004, ▪Mant et al. 1988, •Kaliszan et al. 2005, ♦Meek 1980.
It must be noted here that the disadvantage of the present model over previously developed predictors is the large number of peptide identifications needed to train it. The generation of such a large training set is time consuming and could limit its use from other groups that would like to reproduce the present predictor for different chromatographic conditions. However, to some extent it is possible to adapt the present model to separations with modest changes (e.g. gradient shape). We note that the development of improved alignment algorithms for LC-MS data provides a likely basis for effective alignment of datasets from different chromatographic systems (e.g. using different gradient shapes). Preliminary results92 show that by using a transformation function, it should also be possible to transform peptide elution time predictions from our current chromatographic system to other chromatographic systems without losing much predictive capability. This development, if validated, will facilitate broader application of the present model without the necessity of adopting all of the present chromatographic conditions or acquiring the large datasets of peptide identifications needed to develop the present predictive capability.
Conclusions
In this study, an improved ANN-based peptide retention time predictor was developed that provides an average error of 1.5%. Most of the improvement arises from incorporation of peptide sequence information into the model as opposed to simply amino acid composition. Moreover, the peptide length and hydrophobic moment provided additional small improvements in the model’s prediction capability. Predictor encoding was limited to 50 amino acid residues since most present MS/MS data is limited to this regime. In addition to the 20 proteinogenic amino acids, the present model was trained to predict the retention time of peptides that contain alkylated cysteines. Unlike any of the previously developed predictors, this model is now able to accurately predict the retention times of both isobar and isomer peptides. Such capability allows more confident identification of isomer/isobar peptides otherwise indistinguishable by accurate mass measurements.
The development of the present predictive capability was enabled by the availability of a large quantities of data accumulated over the years using identical chromatographic conditions, and providing a extremely large set of confident peptide identifications. Approximately 346,000 peptides were used to train the ANN predictor. In addition, the development of a new generation of ion trap instruments from several manufacturers that offer faster cycle times and better sensitivities helped in accumulating sufficient training data. To the best of our knowledge, this is the first time that such massive quantities of proteomic data has been used for the development of a peptide retention time predictor or for any other reason. Due to the large amount of data that needed to be normalized, we revised the normalization procedure to an independent linear regression for each analysis. In a comparison with previously reported models, our model provided ~2-fold improvement.
Finally, preliminary results indicate that by using a transformation function, it should also be possible to transform peptide elution time predictions from the current chromatographic system to other similar chromatographic conditions without losing much predictive capability. This development will facilitate broader application of the present model without the necessity of adopting all of the present chromatographic conditions or acquiring the large datasets of peptide identifications needed to develop the present predictive capability. We also plan to explore the use of ANNs for predicting the elution times of peptides with post-translational modifications. This capability would allow the implementation of targeted experiments; that is, the expected mass of the modified peptide (if detected at the predicted elution window) would be added to the inclusion list of the masses to be selected for fragmentation. We further plan to apply the ANN approach to predict the elution time of peptides separated by ion-exchange chromatography for e.g. further quality assurance. This will add another dimension of confidence and be especially useful for research groups that use on-line (e. g., MudPIT) or off-line strong cation exchange columns for peptide separation/fractionation.
Acknowledgments
This work was supported by the NIH National Center for Research Resources (RR18522). Peptide identifications originated from projects funded by the National Institute of Allergy and Infectious Diseases (NIH/DHHS through interagency agreement Y1-AI-4894-01), the Genomics: GtL Program and the Chemical and Biological National Security Program (Office of Biological and Environmental Research, U. S. Department of Energy), and the Biological Countermeasures Program (Department of Homeland Security). The work was performed in the Environmental Molecular Sciences Laboratory, a U.S. Department of Energy (DOE) national scientific user facility located at the Pacific Northwest National Laboratory (PNNL) in Richland, Washington. PNNL is a multiprogram national laboratory operated by Battelle for the DOE under Contract DE-AC05-76RL01830. Work by Drs. Yan and Xu was supported in part by National Science Foundation (#NSF/DBI-0354771, #NSF/ITR-IIS-0407204) and by the DOE Genomes:GtL Program (Carbon Sequestration in Synechococcus sp: From Molecular Machines to Hierarchical Modeling project).
References
- 1.Cottingham K. Anal Chem. 2004;76:95A–97A. doi: 10.1021/ac0415206. [DOI] [PubMed] [Google Scholar]
- 2.Carr S, Aebersold R, Baldwin M, Burlingame A, Clauser K, Nesvizhskii A. Mol Cell Proteomics. 2004;3:531–533. doi: 10.1074/mcp.T400006-MCP200. [DOI] [PubMed] [Google Scholar]
- 3.Sanz-Nebot V, Toro I, Barbosa J. J Chromatogr A. 1999:25–38. [Google Scholar]
- 4.Sanz-Nebot V, Benavente F, Toro I, Barbosa J. Analytical and Bioanalytical Chemistry. 2003;377:306–315. doi: 10.1007/s00216-003-2104-x. [DOI] [PubMed] [Google Scholar]
- 5.Browne CA, Bennett HPJ, Solomon S. Anal Biochem. 1982;124:201–208. doi: 10.1016/0003-2697(82)90238-x. [DOI] [PubMed] [Google Scholar]
- 6.Perrin E, Miclo L, Driou A, Linden G. Analytical Communications. 1996;33:143–147. [Google Scholar]
- 7.Knight CA. J Biol Chem. 1951;190:753–756. [PubMed] [Google Scholar]
- 8.Pardee AB. J Biol Chem. 1951;190:757–762. [PubMed] [Google Scholar]
- 9.Sanger F. Adv Protein Chem. 1952;7:1–7. doi: 10.1016/s0065-3233(08)60017-0. [DOI] [PubMed] [Google Scholar]
- 10.Meek JL. Proc Natl Acad Sci, USA. 1980;77:1632–1636. doi: 10.1073/pnas.77.3.1632. [DOI] [PMC free article] [PubMed] [Google Scholar]
- 11.Meek JL, Rossetti ZL. J Chromatogr. 1981;211:15–28. [Google Scholar]
- 12.Guo D, Mant CT, Taneja AK, Parker JMR, Hodges RS. Journal of Chromatography A. 1986;359:499–517. [Google Scholar]
- 13.Mant CT, Burke TWL, Black JA, Hodges RS. Journal of Chromatography A. 1988;458:193–205. doi: 10.1016/s0021-9673(00)90564-8. [DOI] [PubMed] [Google Scholar]
- 14.Wilce MCJ, Aguilar MI, Hearn MTW. J Chromatogr. 1991;536:165–183. [Google Scholar]
- 15.Wilce MCJ, Aguilar MI, Hearn MTW. J Chromatogr. 1993;632:11–18. doi: 10.1016/0021-9673(93)80020-9. [DOI] [PubMed] [Google Scholar]
- 16.Yoshida T. Journal of Chromatography A. 1998;811:61–67. [Google Scholar]
- 17.Yoshida T, Okada T. J Chromatogr A. 1999;841:19–32. doi: 10.1016/s0021-9673(99)00284-8. [DOI] [PubMed] [Google Scholar]
- 18.Hearn MTW, Aguilar MI. J Chromatogr. 1987;392:33–49. doi: 10.1016/s0021-9673(01)94252-9. [DOI] [PubMed] [Google Scholar]
- 19.Petritis K, Brussaux S, Guenu S, Elfakir C, Dreux M. J Chromatogr A. 2002;957:173–185. doi: 10.1016/s0021-9673(02)00372-2. [DOI] [PubMed] [Google Scholar]
- 20.Houghten RA, Ostresh JM. BioChromatography. 1987;2:80–84. [Google Scholar]
- 21.Terabe S, Konaka R, Inouye K. J Chromatogr. 1979;172:163–177. doi: 10.1016/s0021-9673(00)90954-3. [DOI] [PubMed] [Google Scholar]
- 22.O'Hare MJ, Nice EC. J Chromatogr. 1979;171:209–221. doi: 10.1016/s0021-9673(01)95300-2. [DOI] [PubMed] [Google Scholar]
- 23.Wehr CT, Correia L, Abbott SR. J Chromatogr Sci. 1982;317:129–135. [Google Scholar]
- 24.Su SJ, Grego B, Niven B, Hearn MTW. J Liq Chromatogr. 1981;4:1745–1753. [Google Scholar]
- 25.Zhou NE, Mant CT, Hodges RS. Peptide Research. 1990;3:8–20. [PubMed] [Google Scholar]
- 26.Blondelle SE, Buttner K, Houghten RA. J Chromatogr. 1992;625:199–206. doi: 10.1016/0021-9673(92)85203-6. [DOI] [PubMed] [Google Scholar]
- 27.Buttner K, Pinilla C, Appel JR, Houghten RA. J Chromatogr. 1992;625:191–198. doi: 10.1016/0021-9673(92)85202-5. [DOI] [PubMed] [Google Scholar]
- 28.Sereda TJ, Mant CT, Sonnichsen FD, Hodges RS. J Chromatogr A. 1994;676:139–153. doi: 10.1016/0021-9673(94)00371-8. [DOI] [PubMed] [Google Scholar]
- 29.Su JY, Hodges RS, Kay CM. Biochemistry. 1994;33:15501–15510. doi: 10.1021/bi00255a032. [DOI] [PubMed] [Google Scholar]
- 30.Rothemund S, Krause E, Beyermann M, Dathe M, Engelhardt H, Bienert M. J Chromatogr A. 1995;689 doi: 10.1016/0021-9673(94)00909-s. [DOI] [PubMed] [Google Scholar]
- 31.Sereda TJ, Mant CT, Hodges RS. J Chromatogr A. 1995;695:205–221. doi: 10.1016/0021-9673(94)01147-7. [DOI] [PubMed] [Google Scholar]
- 32.Blondelle SE, Ostresh JM, Houghten RA, Perez-Paya E. Biophysical Journal. 1995;68:351–359. doi: 10.1016/S0006-3495(95)80194-3. [DOI] [PMC free article] [PubMed] [Google Scholar]
- 33.Wimley WC, Creamer TP, White SH. Biochemistry. 1996;35:5109–5124. doi: 10.1021/bi9600153. [DOI] [PubMed] [Google Scholar]
- 34.Steer DL, Thompson PE, Blondelle SE, Houghten RA, Aguilar MI. J Peptide Res. 1998;51:401–412. doi: 10.1111/j.1399-3011.1998.tb00638.x. [DOI] [PubMed] [Google Scholar]
- 35.Yu YB, Wagschal KC, Mant CT, Hodges RS. J Chromatogr A. 2000;890:81–94. doi: 10.1016/s0021-9673(00)00472-6. [DOI] [PubMed] [Google Scholar]
- 36.Wieprecht T, Rothemund S, Bienert M, Krause E. J Chromatogr A. 2001;912:1–12. doi: 10.1016/s0021-9673(01)00531-3. [DOI] [PubMed] [Google Scholar]
- 37.Chen Y, Mant CT, Hodges RS. Journal of Chromatography A. 2003;1010:46–61. doi: 10.1016/s0021-9673(03)00877-x. [DOI] [PubMed] [Google Scholar]
- 38.Krokhin OV, Craig R, Spicer V, Ens W, Standing KG, Beavis RC, Wilkins JA. Mol Cell Proteomics. 2004;3:908–919. doi: 10.1074/mcp.M400031-MCP200. [DOI] [PubMed] [Google Scholar]
- 39.Liu HX, Xue CX, Zhang RS, Wao XJ, Liu MC, Hu ZD, Fan BT. J Chem Inf Comput Sci. 2004;44:1979–1986. doi: 10.1021/ci049891a. [DOI] [PubMed] [Google Scholar]
- 40.Kaliszan R, Baczek T, Cimochowska A, Juszczyk P, Wisniewska K, Grzonka Z. Proteomics. 2005;5:409–415. doi: 10.1002/pmic.200400973. [DOI] [PubMed] [Google Scholar]
- 41.Baczek T, Wiczling P, Marszall M, Heyden YV, Kaliszan R. J Proteome Res. 2005;4:555–563. doi: 10.1021/pr049780r. [DOI] [PubMed] [Google Scholar]
- 42.Makrodimitris K, Fernandez EJ, Woolf TB, O'Connell JP. Anal Chem. 2005;77:1243–1252. doi: 10.1021/ac048812r. [DOI] [PubMed] [Google Scholar]
- 43.Petritis K, Kangas LJ, Ferguson PL, Anderson GA, Pasa-Tolic L, Lipton MS, Auberry KJ, Strittmatter EF, Shen Y, Zhao R, Smith RD. Anal Chem. 2003;75:1039–1048. doi: 10.1021/ac0205154. [DOI] [PubMed] [Google Scholar]
- 44.Petritis K, Kangas LJ, Strittmatter EF, Xu Y, Yan B, Camp DG, II, Lipton MS, Smith RD. 52nd ASMS conference on Mass Spectrometry and Allied Topics; Nashville, USA. poster 2004. [Google Scholar]
- 45.Conrads TP, Anderson GA, Veenstra TD, Pasa-Tolic L, Smith RD. Analytical Chemistry. 2000;72:3349–3354. doi: 10.1021/ac0002386. [DOI] [PubMed] [Google Scholar]
- 46.Smith RD, Anderson GA, Lipton MS, Pasa-Tolic L, Shen Y, Conrads TP, Veenstra TD, Udseth HR. Proteomics. 2002;2:513–523. doi: 10.1002/1615-9861(200205)2:5<513::AID-PROT513>3.0.CO;2-W. [DOI] [PubMed] [Google Scholar]
- 47.Lipton MS, Pasa-Tolic L, Anderson GA, Anderson DJ, Auberry DL, Battista JR, Daly MJ, Fredrickson J, Hixson KK, Kostandarithes H, Masselon C, Markillie LM, Moore R, Romine MF, Shen Y, Strittmatter E, Tolic N, Udseth HR, Venkateswaran A, Wong KK, Zhao R, Smith RD. Proc Natl Acad Sci, USA. 2002;99:11,049–11,054. doi: 10.1073/pnas.172170199. [DOI] [PMC free article] [PubMed] [Google Scholar]
- 48.Strittmatter EF, Ferguson PL, Tang K, Smith RD. J Am Soc Mass Spectrom. 2003;14:980–991. doi: 10.1016/S1044-0305(03)00146-6. [DOI] [PubMed] [Google Scholar]
- 49.Palmblad M, Ramstrom M, Markides KEPH, Bergquist J. Anal Chem. 2002;74:5826–5830. doi: 10.1021/ac0256890. [DOI] [PubMed] [Google Scholar]
- 50.Palmblad M, Ramstrom M, Bailey GB, McCutchen-Maloney SL, Bergquist J, Zeller LC. J Chromatogr B. 2004;803:131–135. doi: 10.1016/j.jchromb.2003.11.007. [DOI] [PubMed] [Google Scholar]
- 51.Strittmatter EF, Kangas LJ, Petritis K, Mottaz HM, Anderson GA, Shen Y, Jacobs JM, Camp DG, 2nd, Smith RD. J Proteome Res. 2004;3:760–769. doi: 10.1021/pr049965y. [DOI] [PubMed] [Google Scholar]
- 52.Varnum SM, Covington CC, Woodbury RL, Petritis K, Kangas LJ, Abdullah MS, Pounds JG, Smith RD, Zangar RC. Breast Cancer Res Treat. 2003;80:87–97. doi: 10.1023/A:1024479106887. [DOI] [PubMed] [Google Scholar]
- 53.Qian WJ, Liu T, Monroe ME, Strittmatter EF, Jacobs JM, Kangas LJ, Petritis K, Camp DG, 2nd, Smith RD. J Proteome Res. 2005;4:53–62. doi: 10.1021/pr0498638. [DOI] [PubMed] [Google Scholar]
- 54.Le Bihan T, Robinson MD, Stewart II, Figeys D. J Proteome Res. 2004;3:1138–1148. doi: 10.1021/pr049909x. [DOI] [PubMed] [Google Scholar]
- 55.Kawakami T, Tateishi K, Yamano Y, Ishikawa T, Kuroki K, Nishimura T. Proteomics. 2005;5:856–864. doi: 10.1002/pmic.200401047. [DOI] [PubMed] [Google Scholar]
- 56.Norbeck AD, Monroe ME, Adkins JN, Anderson KK, Daly DS, Smith RD. J Am Soc Mass Spectrom. 2005;16:1239–1249. doi: 10.1016/j.jasms.2005.05.009. [DOI] [PMC free article] [PubMed] [Google Scholar]
- 57.Cargile BJ, Bundy JL, Freeman TW, Stephenson JL., Jr J Proteome Res. 2004;3:112–119. doi: 10.1021/pr0340431. [DOI] [PubMed] [Google Scholar]
- 58.Cargile BJ, Stephenson JL., Jr Anal Chem. 2004;76:267–275. doi: 10.1021/ac0352070. [DOI] [PubMed] [Google Scholar]
- 59.Cargile BJ, Talley DL, Stephenson JL., Jr Electrophoresis. 2004;25:936–945. doi: 10.1002/elps.200305722. [DOI] [PubMed] [Google Scholar]
- 60.Jacobs JM, Yang XH, Luft BJ, Dunn JJ, Camp DG, Smith RD. Proteomics. 2005;5:1446–1453. doi: 10.1002/pmic.200401052. [DOI] [PubMed] [Google Scholar]
- 61.Varnum SM, Streblow DN, Monroe ME, Smith P, Auberry KJ, Pasa-Tolic L, Wang D, Camp DG, Rodland K, Wiley S, Britt W, Shenk T, Smith RD, Nelson JA. Journal of Virology. 2004;78:13395–13395. doi: 10.1128/JVI.78.20.10960-10966.2004. [DOI] [PMC free article] [PubMed] [Google Scholar]
- 62.Lipton MS, Pasa-Tolic L, Anderson GA, Anderson DJ, Auberry DL, Battista JR, Daly MJ, Fredrickson J, Hixson KK, Kostandarithes H, Masselon C, Markillie LM, Moore RJ, Romine MF, Shen Y, Stritmatter E, Tolic N, Udseth HR, Venkateswaran A, Wong KK, Zhao R, Smith RD. Proceedings of the National Academy of Sciences, USA. 2002;99:11049–11054. doi: 10.1073/pnas.172170199. [DOI] [PMC free article] [PubMed] [Google Scholar]
- 63.Ding YR, Hixson KK, Burns J, Lipton MS, Smith RD, Lovley DR. Journal of Bacteriology. 2005 submitted. [Google Scholar]
- 64.Liu T, Qian W-J, Chen W-NU, Jacobs JM, Moore RJ, Anderson DJ, Gritsenko MA, Monroe ME, Thrall BD, David G, Camp I, Smith RD. Proteomics. 2005 doi: 10.1002/pmic.200401055. epub ahead of print. [DOI] [PMC free article] [PubMed] [Google Scholar]
- 65.Jacobs JM, Mottaz HM, Yu LR, Anderson DJ, Moore RJ, Chen WU, Auberry KJ, Strittmatter EF, Monroe ME, Thrall BD, Camp DG, Smith RD. Journal of Proteome Research. 2004;3:68–75. doi: 10.1021/pr034062a. [DOI] [PubMed] [Google Scholar]
- 66.Purvine S, Picone AF, Kolker E. Omics-a Journal of Integrative Biology. 2004;8:79–92. doi: 10.1089/153623104773547507. [DOI] [PubMed] [Google Scholar]
- 67.Callister SJ, Goddard CD, Zeng X, Roh J, Dominguez M, Tavano C, Kaplan S, Donohue T, Smith RD, Lipton MS. Journal of Bacteriology. 2005 submitted. [Google Scholar]
- 68.Prokisch H, Scharfe C, Camp DG, Xiao WZ, David L, Andreoli C, Monroe ME, Moore RJ, Gritsenko MA, Kozany C, Hixson KK, Mottaz HM, Zischka H, Ueffing M, Herman ZS, Davis RW, Meitinger T, Oefner PJ, Smith RD, Steinmetz LM. Plos Biology. 2004;2:795–804. doi: 10.1371/journal.pbio.0020160. [DOI] [PMC free article] [PubMed] [Google Scholar]
- 69.Adkins JN, Mottaz HM, Norbeck AD, Rue J, Clauss T, Purvine S, Heffron F, Smith RD. Molecular & Cellular Proteomics. 2005 doi: 10.1074/mcp.M600139-MCP200. submitted. [DOI] [PubMed] [Google Scholar]
- 70.Kolker E, Picone AF, Galperin MY, Romine MF, Higdon R, Makarova KS, Kolker N, Anderson GA, Qiu XY, Auberry KJ, Babnigg G, Beliaev AS, Edlefsen P, Elias DA, Gorby YA, Holzman T, Klappenbach JA, Konstantinidis KT, Land ML, Lipton MS, McCue LA, Monroe M, Pasa-Tolic L, Pinchuk G, Purvine S, Serres MH, Tsapin S, Zakrajsek BA, Zhou JH, Larimer FW, Lawrence CE, Riley M, Collart FR, Yates JR, Smith RD, Giometti CS, Nealson KH, Fredrickson JK, Tiedje JM. Proceedings of the National Academy of Sciences of the United States of America. 2005;102:2099–2104. doi: 10.1073/pnas.0409111102. [DOI] [PMC free article] [PubMed] [Google Scholar]
- 71.Brown VM, Ossadtchi A, Khan AH, Yee S, Lacan G, Melega WP, Cherry SR, Leahy RM, Smith DJ. Genome Res. 2002;12:868–884. doi: 10.1101/gr.229002. [DOI] [PMC free article] [PubMed] [Google Scholar]
- 72.Chou KC. Biochem Biophys Res Commun. 2000;278:477–483. doi: 10.1006/bbrc.2000.3815. [DOI] [PubMed] [Google Scholar]
- 73.Chou KC. Proteins: Structure, Function, and Genetics. 2001;43:246–255. doi: 10.1002/prot.1035. [DOI] [PubMed] [Google Scholar]
- 74.Schneider G, Wrede P. Biophy J. 1994;66:335–344. doi: 10.1016/s0006-3495(94)80782-9. [DOI] [PMC free article] [PubMed] [Google Scholar]
- 75.Eisenhaber F, Imperiale F, Argos P, Frommel C. Proteins: Structure, Function, and Genetics. 1996;25:157–168. doi: 10.1002/(SICI)1097-0134(199606)25:2<157::AID-PROT2>3.0.CO;2-F. [DOI] [PubMed] [Google Scholar]
- 76.Jones DT. J Mol Biol. 1999;292:195–202. doi: 10.1006/jmbi.1999.3091. [DOI] [PubMed] [Google Scholar]
- 77.Eisenberg D, Weiss RM, Terwillinger TC. Nature. 1982;299:371–374. doi: 10.1038/299371a0. [DOI] [PubMed] [Google Scholar]
- 78.Eisenberg D. Ann Rev Biochem. 1984;53:595–623. doi: 10.1146/annurev.bi.53.070184.003115. [DOI] [PubMed] [Google Scholar]
- 79.Eisenberg D, Weiss RM, Terwillinger TC. Proc Natl Acad Sci U S A. 1984;81:140–144. doi: 10.1073/pnas.81.1.140. [DOI] [PMC free article] [PubMed] [Google Scholar]
- 80.Shen Y, Zhao R, Belov ME, Conrads TP, Anderson GA, Tang K, Pasa-Tolic L, Veenstra TD, Lipton MS, Smith RD. Anal Chem. 2001;73:1766–1775. doi: 10.1021/ac0011336. [DOI] [PubMed] [Google Scholar]
- 81.Shen Y, Tolic N, Zhao R, Pasa-Tolic L, Li L, Berger SJ, Harkewicz R, Anderson GA, Belov ME, Smith RD. Analytical Chemistry. 2001;73:3011–3021. doi: 10.1021/ac001393n. [DOI] [PubMed] [Google Scholar]
- 82.Harkewicz R, Belov ME, Anderson GA, Pasa-Tolic L, Masselon CD, Prior DC, Udseth HR, Smith RD. J Am Soc Mass Spectrom. 2002;13:144–154. doi: 10.1016/S1044-0305(01)00343-9. [DOI] [PubMed] [Google Scholar]
- 83.Holland JH. Adaptation in Natural and Artificial Systems. University of Michigan Press; Ann Arbor, MI: 1975. [Google Scholar]
- 84.Goldberg DE. Genetic Algorithms in Search, Optimization and Machine Learning. Addison-Wesley; Reading MS: 1989. [Google Scholar]
- 85.Qian WJ, Jacobs JM, Camp DG, II, Monroe ME, Moore RJ, Gritsenko MA, Calvano SE, Lowry SF, Xiao W, Moldawer LL, Davis RW, Tompkins RG, Smith RD. Proteomics. 2005;5:572–584. doi: 10.1002/pmic.200400942. [DOI] [PMC free article] [PubMed] [Google Scholar]
- 86.Mayya V, Rezaul K, Cong YS, Han D. Mol Cell Proteomics. 2005;4:214–223. doi: 10.1074/mcp.T400015-MCP200. [DOI] [PMC free article] [PubMed] [Google Scholar]
- 87.MacCoss MJ, Wu CC, Yates JR. Anal Chem. 2002;74:5593–5599. doi: 10.1021/ac025826t. [DOI] [PubMed] [Google Scholar]
- 88.Yao J, Teng N, Poh HL, Tan CL. Journal of Information Science and Engineering. 1998;14:843–862. [Google Scholar]
- 89.Krokhin OV, Craig R, Spicer V, Ens W, Standing KG, Beavis R, Wilkins JA. 52nd ASMS conference on Mass Spectrometry and Allied Topics; Nashville, USA. poster 2004. [Google Scholar]
- 90.Bondi A. J Phys Chem. 1964;68:441–445. [Google Scholar]
- 91.Tao P, Wang RX, Lai LH. Journal of Molecular Modeling. 1999;5:189–195. [Google Scholar]
- 92.Jaitly N, Monroe ME, Petyuk V, Clauss TRW, Adkins JN, Smith RD. Analytical Chemistry. 2006 doi: 10.1021/ac052197p. submitted. [DOI] [PubMed] [Google Scholar]