

Abstract
Recently, it was reported that stimulation of the infralimbic cortex produces a feedforward inhibition of central amygdala neurons. The interest of this observation comes from the fact that the central nucleus is the main output station of the amygdala for conditioned fear responses and evidence that the infralimbic cortex plays a critical role in the extinction of conditioned fear. However, the identity of the neurons mediating this infralimbic-evoked inhibition of the central nucleus remains unknown. Likely candidates are intercalated amygdala neurons. Indeed, these cells receive glutamatergic afferents from the infralimbic cortex, use GABA as a transmitter, and project to the central amygdala. Thus, the present study was undertaken to test whether, in adult rats, the infralimbic cortex can affect the activity of intercalated neurons. To this end, disinhibition of the infralimbic cortex was induced by local infusion of the non-competitive GABA-A receptor antagonist picrotoxin. Subsequently, neuronal activation was determined bilaterally within the amygdala using induction of the immediate early gene Fos. Infralimbic disinhibition produced a significant increase in the number of Fos-immunoreactive intercalated cells bilaterally whereas no change was detected in the central nucleus. In the basolateral amygdaloid complex, increases in the number of Fos-immunoreactive cells only reached significance in the contralateral lateral nucleus. These results suggest that glutamatergic inputs from the infralimbic cortex directly activate intercalated neurons. Thus, our findings raise the possibility that the infralimbic cortex inhibits conditioned fear via the excitation of intercalated cells and the consequent inhibition of central amygdala neurons.
Keywords: picrotoxin, immediate early gene, GABA, fear, extinction
Investigating how organisms learn to predict danger on the basis of experience is essential if we are to understand, and ultimately treat, human anxiety disorders (Shekhar et al., 1999). The available evidence, albeit controversial (Cahill et al., 1999; Paré, 2002), suggests that the basolateral complex of the amygdala (BLA) is the site of plastic synaptic events that underlie the acquisition of classically conditioned fear responses (LeDoux, 2000;Everitt et al., 2003). According to the prevalent model, convergence of information about the conditioned stimuli (CS) and unconditioned stimuli would potentiate synapses conveying information about the CS to the BLA. Subsequent presentations of the CS alone would evoke larger responses in the BLA (Quirk et al.,1995;Repa et al., 2001;Rosenkranz and Grace, 2002). Conditioned fear responses would be elicited via BLA projections to the central amygdaloid nucleus (CEA; Krettek and Price, 1978;Kapp et al., 1979) and from there, to a distributed network of hypothalamic and brainstem effectors (Davis, 2000).
Surprisingly however, the extinction of conditioned fear responses does not appear to result from the erasure of the initial learning, but from a new parallel learning that competes with the first one, ultimately preventing the expression of conditioned responses (Rescorla, 2001). Among the data supporting this view, systemic and intra-amygdaloid injection of drugs blocking (Falls et al., 1992; Cox and Westbrook, 1994; Baker and Azorlosa, 1996; Lee and Kim, 1998;Santini et al., 2001) or facilitating (Walker et al., 2002) NMDA responses respectively prevent or accelerate extinction learning. Moreover, when unsignaled shocks are administered after extinction, conditioned fear responses are “reinstated” (Rescorla and Heth, 1975).
At present, the processes underlying extinction learning remain obscure. However, mounting evidence suggests that an extrinsic input to the amygdala plays a critical role (for review see Paré et al., 2004). Indeed, lesions of the medial prefrontal cortex (Morgan et al., 1993) and, in particular, of the infralimbic cortex (Quirk et al., 2000) impair extinction learning. Moreover, in rats not exposed to extinction learning, electrical stimulation of the infralimbic cortex during the CS, reduces conditioned responses (Milad and Quirk, 2002). Finally, electrical stimulation of the infralimbic cortex produces an inhibition of brainstem-projecting CEA neurons (Quirk et al., 2003). Given that infralimbic axons form asymmetric, presumably excitatory synapses in the amygdala (Smith et al., 2000;Pinto and Sesack, 2002), the question is how does this excitatory input inhibit the CEA, presumably preventing the expression of conditioned fear responses?
Recently, it was argued that intercalated (ITC) cells of the amygdala are ideal candidates to mediate the infralimbic-driven inhibition of CEA neurons (Royer and Paré, 2002; Quirk et al., 2003). ITC cell masses are clusters of GABAergic neurons located between the BLA and CEA (Nitecka and Ben-Ari, 1987; McDonald and Augustine, 1993; Paré and Smith, 1993a). These neurons generate feedforward inhibition in the CEA in response to glutama-tergic inputs arising in the BLA (Paré and Smith, 1993b; Royer et al., 1999). Moreover, the infralimbic cortex sends a massive projection to ITC cell masses (McDonald et al., 1996; Pinto and Sesack, 2002).
The present study was undertaken to test whether the infralimbic cortex can affect the activity of ITC neurons. Acute infusions of the chloride channel blocker picrotoxin were performed in the infralimbic region to locally block GABA-A inhibition and, thus, increase the activity of infra-limbic neurons (Chagnac-Amitai and Connors, 1989a). To test whether ITC neurons are responsive to infralimbic activation, we used expression of the immediate early gene product Fos as an indicator of neuronal activation (Hughes and Dragunow, 1995). Our results indicate that infralimbic activation produces a marked increase in the number of Fos-immunoreactive (IR) ITC neurons.
EXPERIMENTAL PROCEDURES
Surgical procedures
All procedures were approved by the Institutional Animal Care and Use Committee of McLean Hospital, in compliance with the Guide for the Care and Use of Laboratory Animals (Department of Health and Human Services publication 86-23). Particular care was taken in order to minimize the number of animals used and their suffering. Under sterile conditions, 16 Sprague-Dawley rats (male, approximately 300 g) were anesthetized with a mixture of ketamine and xylazine (87 and 13 mg/kg, i.p., respectively) and placed in a stereo-taxic apparatus (Stoelting, Wood Dale, IL, USA). After drilling a burr hole on the skull, a 27 G indwelling guide cannula (Small Parts, Miami Lakes, FL, USA) was positioned 2 mm above the superficial layers of the infralimbic cortex (A 2.6, L 0.6, H 4.5; Bregma; Paxinos and Watson, 1986) and fixed to the skull with screws and dental cement. An obturator was inserted inside the guide cannula. All animals were allowed a week to recover from surgery.
On the day of the experiment, the obturator was removed and an injection needle (33 G) was inserted in the guide, protruding 2 mm in order to reach the superficial layers of the infralimbic cortex (see Fig. 1). We targeted superficial layers because most infralimbic projections to the amygdala originate from layer II neurons (Ottersen, 1982). Before insertion, the injection needle was loaded with either picrotoxin (n=8) or vehicle (n=8) and connected through a polyethylene tubing to a microprocessor controlled dual syringe pump (Stoelting Co.). Picrotoxin (100 μM), or vehicle (saline, 0.9%), was infused slowly (0.02 μl/min for an hour; total of 1.2 μl) while the rats were freely moving in their home cages and closely monitored. A picrotoxin- and a vehicle-treated rat was always perfused simultaneously to control for variables such as time of the day and possible variations in the environment (e.g. background noise). It should be noted that picrotoxin was simply used to increase the activity of prefrontal neurons. We cannot rule out that local hypersynchronous neuronal activity was induced by the picrotoxin infusions. Two hours and 15 min after infusion onset, the animals were deeply anesthetized (pentobarbital; 400 mg/kg, i.p.) and then perfused transcardially with 4% paraformaldehyde in 0.1 M phosphate buffer (PB; pH 7.4).
Fig. 1.

Histological determination of infusion sites in the prefrontal cortex. Injection cannulas were aimed at the superficial layers of the infralimbic cortex. In A, a microphotograph of a Cresyl Violet-stained brain section from a rat infused with picrotoxin. The arrow indicates the tip of the cannula track, located within the superficial layers of the infralimbic cortex. In B, diagrammatic representations of two levels of the prefrontal cortex (modified from Swanson, 1992) indicating the tip of the cannula tracks for saline- (triangles) and picrotoxin- (stars) injected rats. Solid symbols mark successful infralimbic injections. Dotted symbols represent five cases that were excluded from the final analysis because the tip of the cannula track lay outside the infralimbic cortex. Abbreviations: IL, infralimbic cortex; PL, prelimbic cortex.
Immunocytochemical procedures
Brains were removed, postfixed for 1 h in 4% paraformaldehyde, 0.1 M PB and cryoprotected overnight in 20% glycerol in 0.1 M PB. Twelve identical sets of serial 30 μm-thick coronal sections were cut using a freezing microtome. One series of section was then stained with Cresyl Violet to aid in the identification of the infusion site (Fig. 1A)and the delineation of amygdala nuclei. A second series of sections, adjacent to the first one, was then processed for two-color immunocytochemistry in order to detect GABA and Fos protein products within the same sections. Free-floating sections were washed in 0.01 M PB containing 0.9% NaCl, 0.2% Triton X-100 (PBS-Tx; pH 7.4) incubated with 0.3% H2O2and 10% methanol in PBS-Tx (10 min) and then in 2% bovine albumin serum (BSA; 30 min). Sections were placed in the Fos primary antiserum for 48 h (raised in rabbit 1:30,000; Oncogene Research Products, Cambridge, MA, USA) and then incubated (2 h) with a 1:400 solution containing biotinylated goat anti-rabbit secondary antiserum (Vector Laboratories, Burlingame CA, USA) and then in streptavidin (Zymed, San Francisco, CA, USA) (1:4000; 2 h). Finally, sections were incubated in nickel-enhanced diaminobenzidine (DAB; 0.02%; 0.08% nickel sulfate in 0.1 M PB) containing 0.002% hydrogen peroxidase. Sections were rinsed with 0.1 M PB repeatedly after DAB and placed overnight in 0.01 PBS-Tx on a rotator at 4 °C. Blocking steps were 0.3% H2O2, avidin, biotin and 2% BSA (30 min each). Sections were then carried through a second immunocytochemistry procedure, as described above, for GABA staining. The primary antiserum was a goat anti-GABA (1: 16K; Sigma-Aldrich Inc., St Louis, MO, USA); biotinylated secondary antibody, rabbit anti-goat (1:500; Vector Laboratories, Burlingame, CA, USA). For detection of the reaction product, sections were finally incubated in a solution containing 0.02 M Na cacodylate buffer (pH 7.4), 0.05% DAB, 0.005% hydrogen peroxidase (brown reaction product; Berretta et al., 1997). PBS-Tx was used for rinses before and after each step and for all solutions unless mentioned otherwise. Sections from all brains included in the study were processed simultaneously within the same immunocytochemistry session to avoid procedural differences. Also, care was taken that each six-well staining dish used for immunocytochemistry contained sections from both picrotoxin- and vehicle-treated rats and was carried through each immunocytochemistry step (particularly the DAB incubation) for the same duration of time, so to avoid sequence effects.
Areas of interest
In these experiments, we focused our observations on the circuits linking the infralimbic cortex to the ITC cell masses as well as the lateral, basal and central nuclei of the amygdala. Because these nuclei receive bilateral projections from the infralimbic cortex (Cassell and Wright, 1986; Sesack et al., 1989; Buchanan et al., 1994; McDonald et al., 1996; Vertes, 2004) both hemispheres were included in the analysis. In consideration of the fact that the infralimbic cortex sends a more robust projection at rostral amyg-daloid levels, at least on the ipsilateral side (McDonald et al., 1996; Vertes, 2004) and that preliminary inspection of the distribution of Fos-IR within the amygdala suggested heterogeneity along the rostro-caudal axis (Fig. 2), data from the rostral and caudal halves of the amygdalar nuclei were analyzed as such, as well as overall for each nucleus. Furthermore, in a subset of sections (two/rat; posterior 2.2 and 3.0 mm from the Bregma), we used cytoarchitectonic and neurochemical criteria to subdivide the ipsilateral lateral nucleus in a dorsal and ventral subregion, the basal nucleus in its magnocellular (anterior) and parvocellular (posterior) subdivisions and the central nucleus in its medial (CeM) and lateral (CeL) portions (Swanson, 1992; Paré and Smith, 1993a; Kemppainen and Pitkanen, 2000; McDonald and Mascagni, 2001). Note that we did not attempt to subdivide the CeL in capsular and lateral sectors because they could not reliably be distinguished in our material.
Fig. 2.
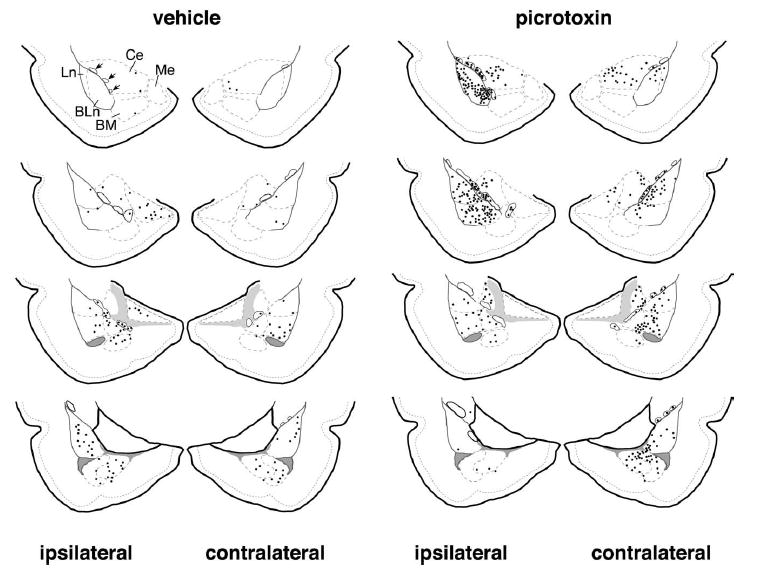
Distribution of Fos-IR cells in rats that received vehicle vs. picrotoxin injections in the infralimbic cortex. Picrotoxin infusion in the infralimbic cortex was associated with an increase of Fos induction overall in the amygdala. Such increase was particularly noticeable within the ITC cell masses, both ipsi- and contra-laterally respect to the injection site. Diagrammatic representations of the amygdala (modified from Swanson, 1992) are shown for representative vehicle- (left) and picrotoxin- (right) treated animals. Sections are displayed in rostro-caudal order from top to bottom. Each black dot represents three Fos-IR nuclei. ITC cell masses are outlined with a continuous line and are marked by arrows in the upper left diagram, while the borders of the other amygdala nuclei are marked with a dashed line. BLn, basolateral nucleus; BM, basomedial nucleus; Ce, central nucleus; Ln, lateral nucleus; Me, medial nucleus.
Cell counts
Slides were coded so that analysis could be performed blindly. For each rat, serial 30 μm thick sections, double labeled for Fos and GABA and representing the whole amygdala (distance between sections 360 μm; overall approximately five to six sections/brain) were included in the analysis. Using a microscope connected to a computer equipped with analytical software (Bioquant Nova Image Analysis Corp., Nashville, TN, USA), the borders of the amyg-dala nuclei of interest were traced with a 4× objective, using accepted cytoarchitectonic criteria (Swanson, 1992) evident in adjacent sections stained with Cresyl Violet. ITC cell masses could be easily distinguished from the CEA and BLA because of their intense GABA-IR (Nitecka and Ben-Ari, 1987; McDonald and Augustine, 1993; Paré and Smith, 1993a). In order to divide the amygdala in a rostral and a caudal portion, the emergence of the tail of the lateral ventricle was used as a landmark. Using a 40× objective, all Fos-IR nuclei showing immunolabeling intensity above a pre-set threshold and located within the nuclei of interest were counted. Using a threshold subroutine (Bioquant Nova), a threshold was set so that, within a ‘reference’ amygdala from a control case, only faintly stained nuclei were excluded. Light intensity histograms, as well as frequent comparisons with the ‘reference’ case, were used to control for possible shifts of the threshold both during the same counting session and in between sessions. In a pilot study, the reliability of this method was tested using sections immunostained for Fos only.
Data analysis
The total volume of the lateral, basal and central nuclei was calculated according to the Cavalieri principle,V=t×k× Σa; where t= the average thickness of the section, k= interval between sections, Σa= sum of the areas of the sections studied (Cavalieri, 1966). Estimates of total numbers of IR neurons were obtained by multiplying the observed number/section (ns) by the interval between sections. Numerical densities were then calculated as Dn=Tn/V, where Tnis the total number. It is important to note that Fos-IR nuclei were counted throughout each nucleus. This method was preferred to the use of ‘counting boxes’ in order to account for substantial heterogeneity in the distribution of Fos-IR nuclei rostro-caudally as well as medio-laterally (see Fig. 2). Counting throughout the zaxis prevented errors inherent to the unevenness of shrinkage and immunostaining in this axis (Benes and Lange, 2001;Gardella et al., 2003). It is important to note that both DnandTn values strictly refer to Fos-IR nuclei showing immunostaining intensity above threshold, reflecting the dynamic nature of the particular protein under investigation.
Statistical analysis
The primary comparison was between vehicle-treated vs. picrotoxin-treated animals; the main outcomes are the numerical densities and total number of Fos-IR nuclei within each amygdala subregion. After the codes were broken, the data were expressed as a mean±S.E.M. for each group. Outcome measures were checked for their distributional properties (Shapiro/Wilk W Goodness-of-Fit test; Unequal Variances Bartlett, Levene and Brown-Forsythe tests). Parametric statistical methods (ANOVA) were used to as-sess significance of differences between the groups for each of the amygdala subregions examined.
RESULTS
Behaviorally, rats that received picrotoxin infusion into the infralimbic cortex were more active than paired controls. The latter were only active during the first 10–15 min of the vehicle infusion, when grooming, exploring and rearing were observed. They spent the rest of the infusion time resting or sleeping. In contrast, picrotoxin-treated rats engaged in rearing, sniffing and rapid walking for the whole duration of the infusion. No seizures were detected behaviorally.
Infralimbic injection sites
The location of the injection needle within layer II/III of the infralimbic cortex was determined on coronal sections counterstained with Cresyl Violet. Fig. 1A illustrates an example of successful injection site. Of 16 rats, 11 had injection sites located within the borders of the infralimbic cortex. Six of these rats received picrotoxin and five received vehicle injections.Fig. 1B shows the location of the needle tips for these successful cases (filled stars, picro-toxin; filled triangles, vehicle). The five rats (picrotoxin n=2; vehicle=3; Fig. 1B , empty symbols) excluded from the study had injections sites that were either too dorsal (prelimbic cortex or dorsal anterior cingulate gyrus) and/or too lateral.
Fos induction
Fos induction was noted at the injection sites, mostly restricted to layers II and III of the infralimbic cortex. Blind subjective rating indicated that the number of Fos-IR nuclei was markedly higher in picrotoxin-treated rats as compared with controls. Fos induction was also detected in other brain regions not specifically investigated in the present study. Among these were the pyriform cortex, the medio-dorsal striatum, some portions of the nucleus accumbens, and the septum. As shown in Table 1 , vehicle-treated rats showed an overall lower intensity of Fos induction ipsi- and contralaterally. Picrotoxin infusion induced significant increases in Fos expression in some amygdala regions as described below (see Table 1 ).
Table 1.
Summary of results for total number and numerical densities of Fos-IR nuclei in amygdala following picrotoxin (n=6) or vehicle (n=5) infusionin the infralimbic cortexa
| Ipsilateral | Contralateral | ||||||||||||
|---|---|---|---|---|---|---|---|---|---|---|---|---|---|
| R+C | R | C | R+C | R | C | ||||||||
| mean | SEM | mean | SEM | mean | SEM | mean | SEM | mean | SEM | mean | SEM | ||
| ITC | |||||||||||||
| Tn | picro | 1629.0 | 471.7 | 799.2 | 127.6 | 922.5 | 387.5 | 514.8 | 188.7 | 465.0 | 234.8 | 219.6 | 58.1 |
| vehicle | 1101.6 | 225.4 | 212.4 | 87.7 | 889.2 | 236.4 | 190.8 | 128.8 | 126.0 | 104.9 | 64.8 | 27.6 | |
| F ratio
p value |
F=1.17
p=0.31 |
F=14.36
p=0.005 |
F=0.005
p=0.94 |
F=2.0
p=0.19 |
F=1.5
p=0.25 |
F=5.7
p=0.042 |
|||||||
| V | picro | 0.086 | 0.009 | 0.046 | 0.010 | 0.046 | 0.012 | 0.044 | 0.004 | 0.022 | 0.004 | 0.023 | 0.001 |
| vehicle | 0.096 | 0.018 | 0.045 | 0.011 | 0.051 | 0.012 | 0.033 | 0.008 | 0.014 | 0.005 | 0.018 | 0.004 | |
| F ratio
p value |
F=0.21
p=0.6 |
F=0.002
p=0.96 |
F=0.073
p=0.79 |
F=1.32
p=0.28 |
F=1.17
p=0.30 |
F=1.06
p=0.33 |
|||||||
| Dn (Tn/V) | picro | 1.8*10p−5 | 4.3*10p−6 | 2.3*10p−5 | 7.0*10p−6 | 1.7*10p−5 | 4.0*10p−6 | 1.5*10p−5 | 3.9*10p−6 | 1.7*10p−5 | 8.4*10p−6 | 0.9*10p−5 | 2.2*10p−6 |
| vehicle | 1.3*10p−5 | 3.1*10p−6 | 0.4*10p−5 | 1.2*10p−6 | 2.4*10p−5 | 1.0*10p−6 | 0.4*10p−5 | 1.8*10p−6 | 0.5*10p−5 | 3.8*10p−6 | 0.3*10p−5 | 1.1*10p−6 | |
| F ratio
p value |
F=1.15
p=0.31 |
F=6.56
p=0.033 |
F=0.32
p=0.58 |
F=3.09
p=0.11 |
F=1.2
p=0.29 |
F=5.6
p=0.044 |
|||||||
| LN | |||||||||||||
| Tn | picro | 2192.4 | 555.9 | 531.0 | 159.5 | 1659.6 | 534.7 | 741.6 | 166.6 | 396.0 | 117.7 | 428.4 | 117.6 |
| vehicle | 5655.6 | 2021.3 | 514.8 | 132.5 | 5140.8 | 1913.7 | 432.0 | 157.2 | 46.8 | 21.7 | 385.2 | 145.4 | |
| F ratio
p value |
F=2.7
p=0.13 |
F=0.005
p=0.9 |
F=3.06
p=0.11 |
F=1.8
p=0.21 |
F=7.0
p=0.026 |
F=0.05
p=0.8 |
|||||||
| V | picro | 0.741 | 0.168 | 0.264 | 0.033 | 0.474 | 0.130 | 0.773 | 0.118 | 0.296 | 0.027 | 0.492 | 0.097 |
| vehicle | 0.865 | 0.091 | 0.332 | 0.062 | 0.533 | 0.070 | 0.701 | 0.164 | 0.273 | 0.078 | 0.427 | 0.091 | |
| F ratio
p value |
F=0.41
p=0.53 |
F=0.99
p=0.34 |
F=0.1
p=0.70 |
F=0.12
p=0.73 |
F=0.08
p=0.77 |
F=0.23
p=0.63 |
|||||||
| Dn (Tn/V) | picro | 4.1*10p−6 | 1.5*10p−6 | 2.1*10p−6 | 0.6*10p−6 | 6.0*10p−6 | 2.5*10p−6 | 9.9*10p−7 | 2.4*10p−7 | 1.3*10p−6 | 3.5*10p−7 | 1.1*10p−6 | 4.1*10p−7 |
| vehicle | 6.9*10p−6 | 2.10*10p−6 | 0.1*10p−6 | 0.5*10p−6 | 10*10p−6 | 3.5*10p−6 | 5.3*10p−7 | 1.2*10p−7 | 0.1*10p−6 | 0.6*10p−7 | 0.7*10p−6 | 2.0*10p−7 | |
| F ratio
p value |
F=0.83
p=0.38 |
F=0.19
p=0.6 |
F=1.01
p=0.3 |
F=2.8
p=0.12 |
F=7.6
p=0.021 |
F=0.3
p=0.5 |
|||||||
| BN | |||||||||||||
| Tn | picro | 7106.4 | 1300.5 | 2046.0 | 632.3 | 5122.8 | 1049.6 | 2829.6 | 1040.3 | 1440.0 | 627.6 | 1494.0 | 306.4 |
| vehicle | 5644.8 | 2041.6 | 1173.6 | 367.2 | 4471.2 | 1918.9 | 1044.0 | 677.8 | 288.0 | 135.6 | 756.0 | 241.9 | |
| F ratio
p value |
F=0.36
p=0.5 |
F=1.27
p=0.28 |
F=0.08
p=0.77 |
F=2.7
p=0.13 |
F=2.6
p=0.13 |
F=3.5
p=0.095 |
|||||||
| V | picro | 1.703 | 0.366 | 0.815 | 0.116 | 0.864 | 0.246 | 1.743 | 0.234 | 0.880 | 0.101 | 0.858 | 0.184 |
| vehicle | 1.599 | 0.175 | 0.786 | 0.098 | 0.811 | 0.141 | 1.773 | 0.280 | 0.842 | 0.143 | 0.930 | 0.168 | |
| F ratio
p value |
F=0.06
p=0.80 |
F=0.03
p=0.85 |
F=0.03
p=0.85 |
F=0.006
p=0.93 |
F=0.04
p=0.82 |
F=0.08
p=0.78 |
|||||||
| Dn (Tn/V) | picro | 4.5*10p−6 | 0.8*106 | 2.5*10p−6 | 0.9*10p−6 | 7.5*10p−6 | 2.2*10p−6 | 1.6*10p−6 | 0.5*10p−6 | 1.4*10p−6 | 0.5*10p−6 | 2.2*10p−6 | 0.6*10p−6 |
| vehicle | 3.9*10p−6 | 1.7*106 | 1.6*10p−6 | 0.4*10p−6 | 5.7*10p−6 | 2.7*10p−6 | 0.5*10p−6 | 0.1*10p−6 | 0.3*10p−6 | 0.2*10p−6 | 0.7*106 | 0.1*10p−6 | |
| F ratio
p value |
F=0.11
p=0.7 |
F=0.7
p=0.4 |
F=0.2
p=0.6 |
F=3.1
p=0.11 |
F=2.6
p=0.13 |
F=4.5
p=0.064 |
|||||||
| CE | |||||||||||||
| Tn | picro | 1896.0 | 625.7 | 1569.6 | 799.4 | ||||||||
| vehicle | 1443.6 | 483.6 | 846.0 | 434.5 | |||||||||
| F ratio
p value |
F=0.3
p=0.5 |
F=0.6
p=0.4 |
|||||||||||
| V | picro | 0.777 | 0.211 | 1.218 | 0.186 | ||||||||
| vehicle | 0.866 | 0.185 | 1.03 | 0.147 | |||||||||
| F ratio
p value |
F=0.14
p=0.71 |
F=0.62
p=0.45 |
|||||||||||
| Dn (Tn/V) | picro | 2.7*10p−6 | 0.9*10p−6 | 1.1*10p−6 | 0.5*10p−6 | ||||||||
| vehicle | 2.0*10p−6 | 0.6*10p−6 | 0.6*10p−6 | 0.2*10p−6 | |||||||||
| F ratio
p value |
F=0.3
p=0.5 |
F=0.6
p=0.4 |
|||||||||||
Significant results are indicated in bold; trends are indicated in bold/italic. Results for tde intercalated cells masses and tde lateral and basolateral nuclei are given for rostral (R) and caudal (C) portions separately as well as for the whole nuclei (R+C). Volumes are expressed in mm3.BN, basolateral nucleus; CE, central nucleus; Dn, numerical densities; LN, lateral nucleus; Tn, total neuron numbers; V, volume.
ITC cell masses
Consistent with previous findings (Nitecka and Ben-Ari, 1987;McDonald and Augustine, 1993;Paré and Smith, 1993a), GABA immunohistochemistry revealed the presence of small patches of intense immunostaining in between the BLA and CEA: the ITC cell masses. Fig. 3A , B shows low power photomicrographs of amygdala sections processed to reveal both GABA and Fos immunoreactivity. ITC masses are indicated by arrows. Higher magnification examples of GABA-IR ITC clusters are shown in Fig. 3 C(control) and D (picrotoxin).
Fig. 3.
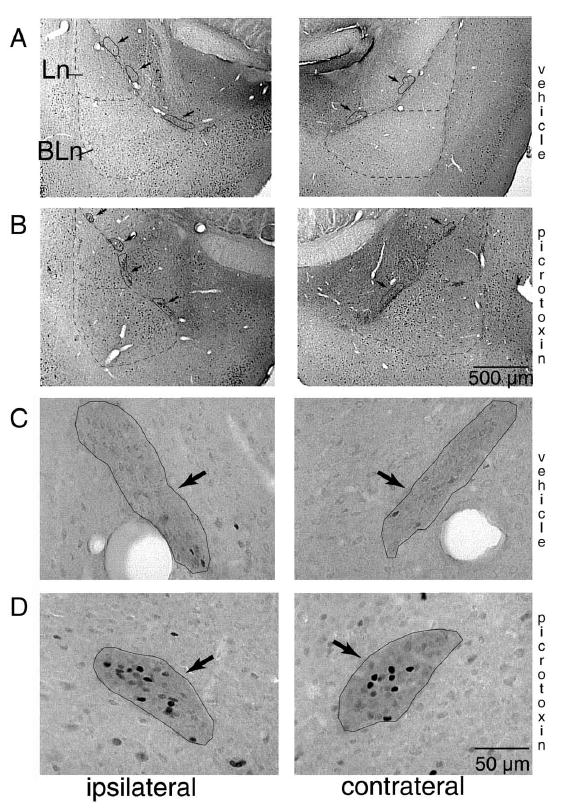
GABA and Fos immunoreactivity in the ITC cell masses. Low (A, B) and high (C, D) magnification microphotographs of brain sections processed for dual antigen immunocytochemistry for GABA and Fos. The borders of the Ln and BLn are indicated with a dashed line while the ITC cell masses are outlined with a continuous line and marked with arrows. Fos-IR nuclei can be seen as darkly stained cell nuclei. GABA immunostaining was detectable as a diffuse neuropil labeling that was sufficiently intense to allow a reliable delineation of the ITC cell masses even though individual cell bodies were only sporadically detected. Sections shown in A (vehicle) and B (picrotoxin) are typical for distribution of Fos-IR nuclei within the amygdalar subnuclei. Statistically significant increases were only detected in the ITC cells masses and in the contralateral lateral nucleus of picrotoxin-treated rats. In C (vehicle) and D (picrotoxin), examples of ITC cell masses are outlined in black. Note the numerous Fos-IR nuclei in the rat treated with picrotoxin (D). BLn, basolateral nucleus; BM, basomedial nucleus; Ce, central nucleus; Ln, lateral nucleus; Me, medial nucleus.
As shown in Table 1 and Figs. 2–4, Fos-IR neurons were detected in the ITC masses of both vehicle- and picrotoxin-treated rats. However, total numbers of Fos-IR neurons were significantly increased following picrotoxin infusion. In particular, total numbers of Fos-IR neurons were increased in the ipsilateral rostral ITC (F ratio=14.3; p=0.005; 3.7-fold increase; Figs. 2–4). Note that this is consistent with the stronger projections of the infralimbic cortex to rostral portions of the amygdala (McDonald et al., 1996).
Fig. 4.

Effect of infralimbic picrotoxin infusions on the number Fos-IR cells in the ITC cell masses. Significant increases in the total number of Fos-IR nuclei were detected in the rostral (ipsilaterally) and caudal (contralaterally) ITC cell masses in rats infused with picrotoxin within the infralimbic cortex.
Contralaterally, the opposite pattern was found. Total numbers of Fos-IR nuclei were significantly increased in the caudal ITC (F ratio=5.7; p=0.042; 3.38-fold increase), while no significant changes were detected rostrally (Table 1 and Figs. 2, 4).
Central nucleus
In control animals, a uniformly low density of Fos-IR cells was found throughout the central nucleus. Overall, the CeL showed higher densities than the CeM (Fig. 5). In keeping with the weak infralimbic projections to the central nucleus, no differences were found between total numbers or numerical densities of Fos-IR neurons in rats infused with vehicle vs. picrotoxin in the infralimbic cortex (total numbers: ipsilateral, F ratio=0.3, p=0.5; contralateral, Fratio=0.6, p=0.44; see also Table 1 and Fig. 2). This was true whether the central nucleus was considered as a whole, or when its lateral and medial sectors were considered separately.
Fig. 5.

Effect of infralimbic picrotoxin infusions on the densities of Fos-IR cells in the ipsilateral Ln, BLnM, BLnP, CeL and CeM of the amygdala. No significant changes of densities of Fos-IR nuclei were detected ipsilaterally in any of the regions examined. In both the picrotoxin- and the vehicle-treated groups, densities of Fos-IR nuclei showed a tendency to be higher in the parvocellular subregion of the BLnP as compared with the BLnM and in the central Ln as compared with the CeM. Ln, lateral nucleus; BLnM, basolateral nucleus, magno-cellular; BLnP, basolateral nucleus, parvocellular.
Lateral nucleus
On the ipsilateral side, no significant differences in the density of Fos-IR cells were found in the lateral nucleus between rats that received vehicle vs. picrotoxin injections in the infralimbic cortex. This was true at both rostral and caudal amygdaloid levels (see Table 1 ) whether the lateral nucleus was treated as a whole or when its dorsal and ventral sectors were examined separately. In the rostral portion of the contralateral lateral nucleus, we detected substantial (eight-fold) increases of Fos-IR neurons (total Fos-IR number: Fratio=7.03, p=0.026; numerical density, Fratio=7.6, p=0.021; see Table 1 ).
Basolateral nucleus
Fos-IR cells were detected in the basolateral nucleus of both controls and picrotoxin-treated rats. Overall, the par-vocellular subregion had higher densities than the magno-cellular one in both groups (Fig. 5). However, no significant differences in the total numbers and numerical densities of Fos-IR cells were found in the basolateral nucleus between rats that received vehicle vs. picrotoxin injections. This was true at both rostral and caudal amygdaloid levels (see Table 1 ), whether the basolateral nucleus was considered as a whole or separating the magnocellular and parvocellular subregions (Fig. 5). It should be noted however that, at least contralaterally, there were substantial increases of Fos-IR (see Figs. 2,3A, B). In the caudal portion of the basolateral nucleus, these increases were close to significant levels (total numbers, F ratio=3.5, p=0.095, 1.97-fold increase; numerical density, F ratio= 4.5, p=0.064, 2.89-fold increase). In the rostral portion, a 3.65-fold increase was measured in numerical density (F ratio=2.6, p=0.13) and a five-fold increase in total numbers (Fratio=2.6, p=0.13; see Table 1 ).
Effects of picrotoxin injections outside the infralimbic cortex
As a further control, we analyzed data obtained from animals that received picrotoxin infusions just outside the infralimbic cortex (n=2). In one of these rats, the injection site was located within the deep layers of dorsal anterior cingulate gyrus while the other ended within the prelimbic cortex. In these rats, very few Fos-IR neurons were detected within the ITC cell masses and in the amygdala overall.
DISCUSSION
The present study was undertaken to test whether the infralimbic cortex can affect the activity of ITC neurons. The interest of this issue stems from the fact that ITC cells send a GABAergic projection to the main output station of the amygdala for conditioned fear responses (Paré and Smith, 1993a,b; Royer et al., 1999), and that behavioral studies implicate the infralimbic cortex in the extinction of these responses (Morgan et al., 1993; Milad and Quirk, 2002). Using Fos immunoreactivity as an index of neuronal activation, our results suggest that infralimbic inputs do increase the activity of ITC cells. This effect might explain how infralimbic stimulation inhibits brainstem projecting neurons of the central nucleus (Quirk et al., 2003) and the expression of conditioned fear responses (Milad and Quirk, 2002).
In the following account, we will discuss the main findings of the study and consider their significance for the extinction of Pavlovian fear responses.
Technical considerations
In the present study, local picrotoxin injections in awake freely moving rats were performed to increase the activity of infralimbic neurons. Picrotoxin is a non-competitive antagonist of the GABAA receptor-chloride ionophore supramolecular complex, which consists of GABA receptors, benzodiazepine receptors and various modulatory sites such as the picrotoxin and the neurosteroid receptors (for review see Chebib and Johnston, 1999). The picrotoxin receptor is functionally coupled with the chloride ionophore. Within the context of the present experiments, picrotoxin has pharmacological properties that are advantageous compared with other GABA-A receptor antagonists such as bicuculline. For instance, picrotoxin is a use-dependent non-competitive antagonist, which implies that, in presence of an increase in GABA release, picrotoxin would become more effective while bicuculline would be displaced from its binding site and become less effective (Chebib and Johnston, 1999). An increase in GABA release is, in fact, likely under the present experimental conditions because disinhibition of pyramidal neurons induced by GABA blockade, in turn, excites interneurons via recurrent collaterals.
As we have previously noted (Berretta et al., 1997;Berretta et al., 2001), the use of local injections of picro-toxin to activate cortical neurons also offers several experimental advantages compared with other methods. By reducing GABA-A currents, picrotoxin disinhibits cortical cells, thereby increasing their firing rates without activating passing fibers (Chagnac-Amitai and Connors, 1989b). In addition, the activation produced by picrotoxin relies on endogenous excitatory activity, because it is induced by blockade of an intrinsic inhibitory mechanism.
Diffusion of picrotoxin to regions surrounding the infra-limbic cortex could, potentially, have influenced the results reported here. However, several considerations point to the contrary. Drug diffusion is most likely to occur dorsally, along the needle track. Picrotoxin infusion dorsally to the infralimbic cortex result in a pattern of Fos induction that differs from that described here or produces no Fos induction (see Results). The lack of significant picrotoxin spread to adjacent brain regions may be partly due to the slow infusion rate. This idea is supported by previous studies from this and other laboratories. For instance, local epidural application of picrotoxin does not result in widespread diffusion in the cortex (Berretta et al., 1997), suggesting that this drug has a low diffusion coefficient and/or a rapid metabolism in rodents. Moreover, a number of laboratories have reported site-specific effects of picrotoxin infusions withinthe same brain structures (Kodsi and Swerdlow, 1995; Ikemoto et al., 1997), again suggesting a limited spread of this drug.
Infralimbic projections to the amygdala and the distribution of Fos-IR neurons
The infralimbic cortex sends substantial projections to the ITC cell masses and to components of the BLA, particularly to the lateral, basal and basomedial nuclei. Sparser infralimbic projections also reach the CEA (Cassell and Wright, 1986; Buchanan et al., 1994; McDonald et al., 1996;Ghashghaei and Barbas, 2002; Pinto and Sesack, 2002).
While the increased number of Fos-IR cells in the ITC cell masses following picrotoxin injection in the infralimbic cortex, as well as the lack of differences between the two groups in the CEA, is consistent with the anatomical data, the results obtained in the lateral nucleus are not. Indeed, in the lateral nucleus, a significant increase in the density of Fos-IR cells was only found contralateral to the picrotoxin injection. This is puzzling because infralimbic projections to the lateral nucleus are denser on the ipsilateral side (McDonald et al., 1996). It is possible that the background Fos expression detected in controls masked some of the effects of picrotoxin infusion within the infralimbic cortex. Fos is not usually detected at significant levels in the amygdala of naive animals (e.g. Campeau et al., 1991; Schettino and Otto, 2001; Singewald et al., 2003; Berretta, unpublished observations), indicating that the vehicle itself or the trauma induced by the infusion needle may have caused its induction.
Another possible solution to this paradox might reside in the powerful system of intrinsic inhibitory pressures found in the lateral nucleus. Indeed, in vitroand in vivo intracellular studies have reported that afferent stimulation elicits an initial EPSP that is truncated by a large and prolonged hyperpolarizing potential in projection cells of the lateral nucleus ( Rainnie et al., 1991 ; Washburn and Moises, 1992 ; Lang and Paré, 1997a ,b ; Danober and Pape, 1998 ; Szinyei et al., 2000 ) accounting for their low firing rates in behaving animals ( Paré and Gaudreau, 1996 ). These large hyperpolarizations are generated by the combined action of synaptic conductances (IPSPs) and synaptically activated intrinsic potassium conductances ( Paré et al., 2003 ). As a result of these inhibitory pressures, projection cells of the lateral nucleus respond in a narrow range of low stimulation intensities, below which EPSPs remain sub-threshold and above which, they are obliterated by large hyperpolarizing potentials. Thus, we speculate that a failure to induce a significant increase of Fos expression in the ipsilateral BLA may be accounted for by a strong inhibition triggered by its dense infralimbic projections. On the other hand, the lighter contralateral projection provided a degree of excitation that lay in this optimal range for eliciting orthodromic spikes and, possibly, Fos induction.
Irrespective of the underlying mechanism, the dissociation between the results obtained in the ITC cell masses and BLA suggests that the infralimbic cortex activates ITC cells directly, not via the BLA. On the ipsilateral side, infralimbic disinhibition produced significant increases in the number of Fos-IR neurons in the ITC cell masses, but not in the lateral or the basolateral nuclei. It is reasonable to postulate that this would not be the case if the induction in the ITC cells were mediated through the BLA. Furthermore, previous studies have revealed that there is a lat-eromedial correspondence between the position of ITC neurons and that of the basolateral sites most effective in exciting them (Royer et al., 1999). As a result, if increased activity in the lateral nucleus was responsible for the activation of ITC cell masses, increased Fos expression should not have occurred throughout the lateromedial extent of the ITC cell masses, as seen here (Fig. 2).
Significance for the extinction of Pavlovian fear responses
The expression of conditioned fear responses is currently believed to result from an increased CS responsiveness of basolateral cells. In turn, these basolateral neurons would excite cells of the CEA that project to brainstem and hypothalamic structures mediating fear responses (Davis, 2000;LeDoux, 2000).
Our results suggest that the infralimbic region powerfully activates ITC neurons. These cells are known to send a GABAergic projection to the CEA and to receive gluta-matergic inputs from the BLA (Paré and Smith, 1993a,b; Royer et al., 1999). Since infralimbic axons are presumed to release glutamate in the amygdala (Smith et al., 2000), the infralimbic cortex likely depolarizes ITC cells, thereby increasing the amount of feedforward inhibition they generate in CEA neurons, and effectively reducing the impact of basolateral inputs in the CEA.
Thus, our results imply that the infralimbic cortex may, via ITC cells, prevent the expression of conditioned fear responses. This speculation is consistent with the inhibitory effects of infralimbic stimulation on output neurons of the CEA (Quirk et al., 2003) and the expression of conditioned fear responses (Milad and Quirk, 2002). Moreover, this contention provides a likely explanation for the reduced long-term retention of extinction seen after infralim-bic lesions (Quirk et al., 2000). Finally, it is important to emphasize that immediate early gene induction implies changes in protein synthesis (Hughes and Dragunow, 1995). This raises the possibility that the effects of the infralimbic cortex on these neurons involve a lasting trace of extinction learning. In this context, it should be mentioned that ITC cells express NMDA-dependent long-term potentiation (Royer and Paré, 2002,2003). It is possible that coincident activation of CS-related basolateral and infralimbic inputs to ITC cells produces a long-term increase in the efficacy of basolateral inputs to ITC cells. As a result, following extinction training, the CS would, via ITC cells, evoke more inhibition in central output neurons. Eventually, this process might even become independent of the infralimbic cortex. In closing, it should also be mentioned that medial prefrontal inputs might participate in extinction via a feed-forward activation of inhibitory interneurons of the BLA. Indeed, it was reported that electrical stimulation of the prefrontal cortex activates presumed interneurons, causing an inhibition of principal cells (Rosenkranz and Grace, 2001) and a reduction of their responses to previously CS (Rosenkranz et al., 2003).
CONCLUSIONS
We have shown that activation of the infralimbic cortex increases the number of Fos-IR neurons within the ITC cell masses of the amygdala. These results suggest that the infralimbic cortex directly activates ITC neurons. Such activation is likely to result in prolonged effects, involving changes in gene expression and protein synthesis that could modify the responsiveness of ITC neurons to specific stimuli. In the context of fear extinction, we suggest that infralimbic activation of ITC neurons may play a major role in modulating the response of brainstem projecting central neurons to CS-related inputs arising in the BLA.
Acknowledgments
This work was supported by NIMH grant 066955 and NIMH grant 066280 to S.B., NSF grant IBN-0208712 and NIMH grant 066856 to D.P.
Abbreviations
- BLA
basolateral complex of the amygdala
- BSA
bovine albumin serum
- CEA
central amygdaloid nucleus
- CeL
central nucleus lateral portion
- CeM
central nucleus medial portion
- CS
conditioned stimuli
- DAB
nickel-enhanced diaminobenzidine
- IR
immunoreactive
- ITC
intercalated
- PB
phosphate buffer
- PBS-Tx
phosphate buffer containing 0.9% NaCl, 0.2% Triton X-100
References
- Baker JD, Azorlosa JL. The NMDA antagonist MK-801 blocks the extinction of Pavlovian fear conditioning. Behav Neurosci. 1996;110:618–620. doi: 10.1037//0735-7044.110.3.618. [DOI] [PubMed] [Google Scholar]
- Benes FM, Lange N. Two-dimensional versus three-dimensional cell counting: a practical perspective. Trends Neurosci. 2001;24:11–17. doi: 10.1016/s0166-2236(00)01660-x. [DOI] [PubMed] [Google Scholar]
- Berretta S, Munno DW, Benes FM. Amygdalar activation alters the hippocampal GABA system: ‘partial’ modelling for postmortem changes in schizophrenia. J Comp Neurol. 2001;431:129–138. doi: 10.1002/1096-9861(20010305)431:2<129::aid-cne1060>3.0.co;2-6. [DOI] [PubMed] [Google Scholar]
- Berretta S, Parthasarathy HP, Graybiel AM. Local release of GABAergic inhibition in the motor cortex induces immediate-early gene expression in indirect pathway neurons of the striatum. J Neurosci. 1997;17:4752–4763. doi: 10.1523/JNEUROSCI.17-12-04752.1997. [DOI] [PMC free article] [PubMed] [Google Scholar]
- Buchanan SL, Thompson RH, Maxwell BL, Powell DA. Efferent connections of the medial prefrontal cortex in the rabbit. Exp Brain Res. 1994;100:469–483. doi: 10.1007/BF02738406. [DOI] [PubMed] [Google Scholar]
- Cahill L, Weinberger NM, Roozendaal B, McGaugh JL. Is the amygdala a locus of “conditioned fear”? Some questions and caveats. Neuron. 1999;23:227–228. doi: 10.1016/s0896-6273(00)80774-6. [DOI] [PubMed] [Google Scholar]
- Campeau S, Hayward MD, Hope BT, Rosen JB, Nestler EJ, Davis M. Induction of the c-fos proto-oncogene in rat amygdala during unconditioned and conditioned fear. Brain Res. 1991;565:349–352. doi: 10.1016/0006-8993(91)91669-r. [DOI] [PubMed] [Google Scholar]
- Cassell MD, Wright DJ. Topography of projections from the medial prefrontal cortex to the amygdala in the rat. Brain Res Bull. 1986;17:321–333. doi: 10.1016/0361-9230(86)90237-6. [DOI] [PubMed] [Google Scholar]
- Cavalieri B. Geometria degli Indivisibili. Torino: Unione Tipogra-fica Editrice; 1966. [Google Scholar]
- Chagnac-Amitai Y, Connors BW. Horizontal spread of synchronized activity in neocortex and its control by GABA-mediated inhibition. J Neurophysiol. 1989a;61:747–758. doi: 10.1152/jn.1989.61.4.747. [DOI] [PubMed] [Google Scholar]
- Chagnac-Amitai Y, Connors BW. Synchronized excitation and inhibition driven by intrinsically bursting neurons in neocortex. J Neurophysiol. 1989b;62:1149–1162. doi: 10.1152/jn.1989.62.5.1149. [DOI] [PubMed] [Google Scholar]
- Chebib M, Johnston GA. The ‘ABC’ of GABA receptors: a brief review. Clin Exp Pharmacol Physiol. 1999;26:937–940. doi: 10.1046/j.1440-1681.1999.03151.x. [DOI] [PubMed] [Google Scholar]
- Cox J, Westbrook RF. The NMDA receptor antagonist MK-801 blocks acquisition and extinction of conditioned hypoalgesic responses in the rat. Q J Exp Psychol B. 1994;47:187–210. [PubMed] [Google Scholar]
- Danober L, Pape HC. Mechanisms and functional significance of a slow inhibitory potential in neurons of the lateral amygdala. Eur J Neurosci. 1998;10:853–867. doi: 10.1046/j.1460-9568.1998.00092.x. [DOI] [PubMed] [Google Scholar]
- Davis M. The role of the amygdala in conditioned and unconditioned fear and anxiety. In: Aggleton JP, editor. The amygdala: a functional analysis . Oxford: Oxford University Press; 2000. pp. 213–287. [Google Scholar]
- Everitt BJ, Cardinal RN, Parkinson JA, Robbins TW. Appetitive behavior: impact of amygdala-dependent mechanisms of emotional learning. Ann NY Acad Sci. 2003;985:233–250. [PubMed] [Google Scholar]
- Falls WA, Miserendino MJ, Davis M. Extinction of fear-potentiated startle: blockade by infusion of an NMDA antagonist into the amygdala. J Neurosci. 1992;12:854–863. doi: 10.1523/JNEUROSCI.12-03-00854.1992. [DOI] [PMC free article] [PubMed] [Google Scholar]
- Gardella D, Hatton WJ, Rind HB, Rosen GD, von Bartheld CS. Differential tissue shrinkage and compression in the z-axis: implications for optical disector counting in vibratome-, plastic- and cryosections. J Neurosci Methods. 2003;124:45–59. doi: 10.1016/s0165-0270(02)00363-1. [DOI] [PubMed] [Google Scholar]
- Ghashghaei HT, Barbas H. Pathways for emotion: interactions of prefrontal and anterior temporal pathways in the amygdala of the rhesus monkey. Neuroscience. 2002;115:1261–1279. doi: 10.1016/s0306-4522(02)00446-3. [DOI] [PubMed] [Google Scholar]
- Hughes P, Dragunow M. Induction of immediate early genes and the control of neurotransmitter-regulated gene expression within the nervous system. Pharmacol Rev. 1995;47:133–178. [PubMed] [Google Scholar]
- Ikemoto S, Murphy JM, McBride WJ. Self-infusion of GABA(A) antagonists directly into the ventral tegmental area and adjacent regions. Behav Neurosci. 1997;111:369–380. doi: 10.1037//0735-7044.111.2.369. [DOI] [PubMed] [Google Scholar]
- Kapp BS, Frysinger RC, Gallagher M, Haselton JR. Amygdala central nucleus lesions: effect on heart rate conditioning in the rabbit. Physiol Behav. 1979;23:1109–1117. doi: 10.1016/0031-9384(79)90304-4. [DOI] [PubMed] [Google Scholar]
- Kemppainen S, Pitkanen A. Distribution of parvalbumin, calretinin, and calbindin-D(28k) immunoreactivity in the rat amygdaloid complex and colocalization with gamma-aminobutyric acid. J Comp Neurol. 2000;426:441–467. doi: 10.1002/1096-9861(20001023)426:3<441::aid-cne8>3.0.co;2-7. [DOI] [PubMed] [Google Scholar]
- Kodsi MH, Swerdlow NR. Prepulse inhibition in the rat is regulated by ventral and caudodorsal striato-pallidal circuitry. Behav Neurosci. 1995;109:912–928. doi: 10.1037//0735-7044.109.5.912. [DOI] [PubMed] [Google Scholar]
- Krettek JE, Price JL. A description of the amygdaloid complex in the rat and cat, with observations on intra-amygdaloid axonal connections. J Comp Neurol. 1978;178:255–280. doi: 10.1002/cne.901780205. [DOI] [PubMed] [Google Scholar]
- Lang EJ, Paré D. Similar inhibitory processes dominate the responses of cat lateral amygdaloid projection neurons to their various afferents. J Neurophysiol. 1997a;77:341–352. doi: 10.1152/jn.1997.77.1.341. [DOI] [PubMed] [Google Scholar]
- Lang EJ, Paré D. Synaptic and synaptically activated intrinsic conductances underlie inhibitory potentials in cat lateral amygda-loid projection neurons in vivo. J Neurophysiol. 1997b;77:353–363. doi: 10.1152/jn.1997.77.1.353. [DOI] [PubMed] [Google Scholar]
- LeDoux JE. Emotion circuits in the brain. Annu Rev Neurosci. 2000;23:155–184. doi: 10.1146/annurev.neuro.23.1.155. [DOI] [PubMed] [Google Scholar]
- Lee H, Kim JJ. Amygdalar NMDA receptors are critical for new fear learning in previously fear-conditioned rats. J Neurosci. 1998;18:8444–8454. doi: 10.1523/JNEUROSCI.18-20-08444.1998. [DOI] [PMC free article] [PubMed] [Google Scholar]
- McDonald AJ, Augustine JR. Localization of GABA-like immu-noreactivity in the monkey amygdala. Neuroscience. 1993;52:281–294. doi: 10.1016/0306-4522(93)90156-a. [DOI] [PubMed] [Google Scholar]
- McDonald AJ, Mascagni F. Colocalization of calcium-binding proteins and GABA in neurons of the rat basolateral amygdala. Neuroscience. 2001;105:681–693. doi: 10.1016/s0306-4522(01)00214-7. [DOI] [PubMed] [Google Scholar]
- McDonald AJ, Mascagni F, Guo L. Projections of the medial and lateral prefrontal cortices to the amygdala: a Phaseolus vulgaris leucoagglutinin study in the rat. Neuroscience. 1996;71:55–75. doi: 10.1016/0306-4522(95)00417-3. [DOI] [PubMed] [Google Scholar]
- Milad MR, Quirk GJ. Neurons in medial prefrontal cortex signal memory for fear extinction. Nature. 2002;420:70–74. doi: 10.1038/nature01138. [DOI] [PubMed] [Google Scholar]
- Morgan MA, Romanski LM, LeDoux JE. Extinction of emotional learning-contribution of medial prefrontal cortex. Neurosci Lett. 1993;163:109–113. doi: 10.1016/0304-3940(93)90241-c. [DOI] [PubMed] [Google Scholar]
- Nitecka L, Ben-Ari Y. Distribution of GABA-like immunoreactivity in the rat amygdaloid complex. J Comp Neurol. 1987;266:45–55. doi: 10.1002/cne.902660105. [DOI] [PubMed] [Google Scholar]
- Ottersen OP. Connections of the amygdala of the rat: IV. Corticoamygdaloid and intraamygdaloid connections as studied with axonal transport of horseradish peroxidase. J Comp Neurol. 1982;205:30–48. doi: 10.1002/cne.902050104. [DOI] [PubMed] [Google Scholar]
- Paré D. Mechanisms of Pavlovian fear conditioning: has the engram been located? Trends Neurosci. 2002;25:436–437. doi: 10.1016/s0166-2236(02)02243-9. [DOI] [PubMed] [Google Scholar]
- Paré D, Gaudreau H. Projection cells and interneurons of the lateral and basolateral amygdala: distinct firing patterns and differential relation to theta and delta rhythms in conscious cats. J Neurosci. 1996;16:3334–3350. doi: 10.1523/JNEUROSCI.16-10-03334.1996. [DOI] [PMC free article] [PubMed] [Google Scholar]
- Paré D, Quirk GJ, Ledoux JE. New vistas on amygdala networks in conditioned fear. J Neurophysiol. 2004;92:1–9. doi: 10.1152/jn.00153.2004. [DOI] [PubMed] [Google Scholar]
- Paré D, Royer S, Smith Y, Lang EJ. Contextual inhibitory gating of impulse traffic in the intra-amygdaloid network. Ann NY Acad Sci. 2003;985:78–91. doi: 10.1111/j.1749-6632.2003.tb07073.x. [DOI] [PubMed] [Google Scholar]
- Paré D, Smith Y. Distribution of GABA immunoreactivity in the amygdaloid complex of the cat. Neuroscience. 1993a;57:1061–1076. doi: 10.1016/0306-4522(93)90049-l. [DOI] [PubMed] [Google Scholar]
- Paré D, Smith Y. The intercalated cell masses project to the central and medial nuclei of the amygdala in cats. Neuroscience. 1993b;57:1077–1090. doi: 10.1016/0306-4522(93)90050-p. [DOI] [PubMed] [Google Scholar]
- Paxinos G, Watson C. The rat brain in stereotaxic coordinates. New York: Academic Press; 1986. [DOI] [PubMed] [Google Scholar]
- Pinto A, Sesack SR. Prefrontal cortex projection to the rat amygdala: ultrastructural relationship to dopamine D1 and D2 receptors. Soc Neurosci Abstr. 2002;28:587–586. [Google Scholar]
- Quirk GJ, Likhtik E, Pelletier JG, Paré D. Stimulation of medial prefrontal cortex decreases the responsiveness of central amyg-dala output neurons. J Neurosci. 2003;23:8800–8807. doi: 10.1523/JNEUROSCI.23-25-08800.2003. [DOI] [PMC free article] [PubMed] [Google Scholar]
- Quirk GJ, Repa C, LeDoux JE. Fear conditioning enhances short-latency auditory responses of lateral amygdala neurons: parallel recordings in the freely behaving rat. Neuron. 1995;15:1029–1039. doi: 10.1016/0896-6273(95)90092-6. [DOI] [PubMed] [Google Scholar]
- Quirk GJ, Russo GK, Barron JL, Lebron K. The role of ventro-medial prefrontal cortex in the recovery of extinguished fear. J Neurosci. 2000;20:6225–6231. doi: 10.1523/JNEUROSCI.20-16-06225.2000. [DOI] [PMC free article] [PubMed] [Google Scholar]
- Rainnie DG, Asprodini EK, Shinnick Gallagher P. Inhibitory transmission in the basolateral amygdala. J Neurophysiol. 1991;66:999–1009. doi: 10.1152/jn.1991.66.3.999. [DOI] [PubMed] [Google Scholar]
- Repa JC, Muller J, Apergis J, Desrochers TM, Zhou Y, LeDoux JE. Two different lateral amygdala cell populations contribute to the initiation and storage of memory. Nat Neurosci. 2001;4:724–731. doi: 10.1038/89512. [DOI] [PubMed] [Google Scholar]
- Rescorla RA. Experimental extinction. In: Mowrer RR, Klein S, editors. Handbook of contemporaries learning theories. Mahwah NJ: Erlbaum; 2001. pp. 119–154. [Google Scholar]
- Rescorla RA, Heth CD. Reinstatement of fear to an extinguished conditioned stimulus. J Exp Psychol Anim Behav Process. 1975;1:88–96. [PubMed] [Google Scholar]
- Rosenkranz JA, Grace AA. Dopamine attenuates prefrontal cortical suppression of sensory inputs to the basolateral amygdala of rats. J Neurosci. 2001;21:4090–4103. doi: 10.1523/JNEUROSCI.21-11-04090.2001. [DOI] [PMC free article] [PubMed] [Google Scholar]
- Rosenkranz JA, Grace AA. Dopamine-mediated modulation of odour-evoked amygdala potentials during pavlovian conditioning. Nature. 2002;417:282–287. doi: 10.1038/417282a. [DOI] [PubMed] [Google Scholar]
- Rosenkranz JA, Moore H, Grace AA. The prefrontal cortex regulates lateral amygdala neuronal plasticity and responses to previously conditioned stimuli. J Neurosci. 2003;23:11054–11064. doi: 10.1523/JNEUROSCI.23-35-11054.2003. [DOI] [PMC free article] [PubMed] [Google Scholar]
- Royer S, Martina M, Paré D. An inhibitory interface gates impulse traffic between the input and output stations of the amyg-dala. J Neurosci. 1999;19:10575–10583. doi: 10.1523/JNEUROSCI.19-23-10575.1999. [DOI] [PMC free article] [PubMed] [Google Scholar]
- Royer S, Paré D. Bidirectional synaptic plasticity in intercalated amygdala neurons and the extinction of conditioned fear responses. Neuroscience. 2002;115:455–462. doi: 10.1016/s0306-4522(02)00455-4. [DOI] [PubMed] [Google Scholar]
- Royer S, Paré D. Conservation of total synaptic weight through balanced synaptic depression and potentiation. Nature. 2003;422:518–522. doi: 10.1038/nature01530. [DOI] [PubMed] [Google Scholar]
- Santini E, Muller RU, Quirk GJ. Consolidation of extinction learning involves transfer from NMDA-independent to NMDA-dependent memory. J Neurosci. 2001;21:9009–9017. doi: 10.1523/JNEUROSCI.21-22-09009.2001. [DOI] [PMC free article] [PubMed] [Google Scholar]
- Schettino LF, Otto T. Patterns of Fos expression in the amygdala and ventral perirhinal cortex induced by training in an olfactory fear conditioning paradigm. Behav Neurosci. 2001;115:1257–1272. doi: 10.1037//0735-7044.115.6.1257. [DOI] [PubMed] [Google Scholar]
- Sesack SR, Deutch AY, Roth RH, Bunney BS. Topographical organization of the efferent projections of the medial prefrontal cortex in the rat: an anterograde tract-tracing study with Phaseolus vulgaris leucoagglutinin. J Comp Neurol. 1989;290:213–242. doi: 10.1002/cne.902900205. [DOI] [PubMed] [Google Scholar]
- Shekhar A, Sajdyk TS, Keim SR, Yoder KK, Sanders SK. Role of the basolateral amygdala in panic disorder. Ann NY Acad Sci. 1999;877:747–750. doi: 10.1111/j.1749-6632.1999.tb09315.x. [DOI] [PubMed] [Google Scholar]
- Singewald N, Salchner P, Sharp T. Induction of c-Fos expression in specific areas of the fear circuitry in rat forebrain by anxio-genic drugs. Biol Psychiatry. 2003;53:275–283. doi: 10.1016/s0006-3223(02)01574-3. [DOI] [PubMed] [Google Scholar]
- Smith Y, Paré JF, Paré D. Differential innervation of parvalbumin-immunoreactive interneurons of the basolateral amygdaloid complex by cortical and intrinsic inputs. J Comp Neurol. 2000;416:496–508. [PubMed] [Google Scholar]
- Swanson LW. Brain maps: structure of the rat brain. Amsterdam: Elsevier ; 1992. [Google Scholar]
- Szinyei C, Heinbockel T, Montagne J, Pape HC. Putative cortical and thalamic inputs elicit convergent excitation in a population of GABAergic interneurons of the lateral amygdala. J Neurosci. 2000;20:8909–8915. doi: 10.1523/JNEUROSCI.20-23-08909.2000. [DOI] [PMC free article] [PubMed] [Google Scholar]
- Vertes RP. Differential projections of the infralimbic and prelim-bic cortex in the rat. Synapse. 2004;51:32–58. doi: 10.1002/syn.10279. [DOI] [PubMed] [Google Scholar]
- Walker DL, Ressler KJ, Lu KT, Davis M. Facilitation of conditioned fear extinction by systemic administration or intra-amygdala infusions of D-cycloserine as assessed with fear-potentiated startle in rats. J Neurosci. 2002;22:2343–2351. doi: 10.1523/JNEUROSCI.22-06-02343.2002. [DOI] [PMC free article] [PubMed] [Google Scholar]
- Washburn MS, Moises HC. Inhibitory responses of rat basolat-eral amygdaloid neurons recorded in vitro. Neuroscience. 1992;50:811–830. doi: 10.1016/0306-4522(92)90206-h. [DOI] [PubMed] [Google Scholar]