Abstract
Exact expressions for the static light scattering of a solution containing up to three species of point-scattering solutes in highly nonideal solutions at arbitrary concentration are obtained from multicomponent scattering theory. Explicit expressions for thermodynamic interaction between solute molecules, required to evaluate the scattering relations, are obtained using an equivalent hard particle approximation similar to that employed earlier to interpret scattering of a single protein species at high concentration. The dependence of scattering intensity upon total protein concentration is calculated for mixtures of nonassociating proteins and for a single self-associating protein over a range of concentrations up to 200 g/l. An approximate semiempirical analysis of the concentration dependence of scattering intensity is proposed, according to which the contribution of thermodynamic interaction to scattering intensity is modeled as that of a single average hard spherical species. Simulated data containing pseudo-noise comparable in magnitude to actual experimental uncertainty are modeled using relations obtained from the proposed semiempirical analysis. It is shown that by using these relations one can extract from the data reasonably reliable information about underlying weak associations that are manifested only at very high total protein concentration.
INTRODUCTION
The quantitative characterization of proteins in highly concentrated solution is of interest for at least two reasons, one biological and one biotechnological. Some proteins, such as hemoglobin or crystallins, are present at concentrations of hundreds of grams/liter in their normal milieux, and small changes in their self-interaction resulting from changes in environmental variables or covalent modification may result in the formation of pathological aggregates (1,2). When engineered antibodies are formulated as potential biopharmaceutical agents, attention must be paid to the effects of storage and administration in highly concentrated solution upon the association state of the protein and possible consequences for bioactivity and immunogenicity (3).
The characterization of weak associations leading to complex formation at high total protein concentration poses special problems to the experimenter. Weak attractive interactions are likely to be masked by large nonspecific repulsive interactions deriving from excluded volume. The formation of weakly associated complexes at high protein concentration, referred to as hidden associations (4), is revealed only when the contribution of repulsive, or nonideal, interactions to observed solution properties can be assessed explicitly. Techniques for detecting weak protein associations manifested only at high total concentration, based upon novel analysis of sedimentation equilibrium, have been developed by Chatelier and Minton (5,6), Rivas et al. (7), and Zorrilla et al. (8). Other physical-chemical techniques that have been used to characterize concentrated protein solutions include measurement of osmotic pressure (9,10) and static light scattering (11,12). Prior light-scattering investigations revealed that the dependence of scattering intensity upon total concentration in a solution containing a single species of nonassociating protein or a paucidisperse distribution of nonassociating proteins could be well accounted for by a simple model in which the proteins were represented by effective hard spheres, the size of which depended upon the magnitude of repulsive interactions acting between protein molecules in the solution (11–13).
The purpose of the present work is twofold. The first objective is to develop a more complete quantitative description of static light scattering in solutions containing multiple species of proteins at high total concentration, allowing for the possibility of protein equilibrium self-association. The second objective is to develop an approximate analysis of the dependence of light-scattering intensity upon total protein concentration that may be used to detect and qualitatively or semiquantitively characterize weak protein associations in these solutions, without prior knowledge of the composition of the solutions or detailed knowledge regarding the nature of repulsive nonideal interactions acting between individual protein species. The article is organized as follows. In the next section, multicomponent scattering theory is used to develop explicit expressions for the scattering intensity of a solution containing up to three solute species. These expressions are exact, but require specification of the thermodynamic interactions between each pair of scattering species. An effective hard particle model is then introduced that leads to explicit (but approximate) expressions for the thermodynamic interactions between scatterers required by multicomponent scattering theory. Next, a semiempirical analysis is introduced based upon the assumption that the effects of repulsive nonideal interactions upon scattering intensity may be accounted for by a universal correction that is independent (to within an acceptable level of approximation) of the details of the underlying interactions. This assumption is tested by application to analysis of simulated noisy experimental data. The results of the analysis indicate that the approximation is reasonably robust, and permits recovery of information about weak complex formation embedded within the simulated data.
General relations from multicomponent scattering theory
We consider a solution containing multiple species of globular protein, all of which have a maximum dimension that is small relative to the wavelength of incident light (650–700 nm), and therefore behave as point scatterers (14). To simplify computation we shall further assume that all protein species have the same specific refractive increment dñ/dw, where ñ denotes the refractive index of the solution and w the w/v concentration of protein. (Extension to mixtures of scattering species with significantly different values of dñ/dw, such as a solution containing a protein and a nucleic acid, is theoretically straightforward but computationally tedious.) Most proteins that are neither highly glycosylated nor lipidated have the same specific refractive increment (∼0.185 cm3/g) to within reasonable precision (15), and if the different scattering species considered here correspond to different association states of a single protein, then the assumption of equal specific refractive increment is automatically valid. For such a solution, the theory of Rayleigh scattering from multicomponent solutions (14,16) yields
 |
(1) |
where R denotes the (angle-independent) Rayleigh ratio, ño and ñ the refractive index of solvent (buffer) and solution, respectively, Mi the molar mass of the ith scattering species, and 〈Δci Δcj〉 the mean product of the fluctuations of the molar concentrations of the ith and jth scattering species about their respective equilibrium values. R is scaled to an optical constant independent of solution properties, given by
 |
(2) |
where λo denotes the wavelength (in vacuum) of the incident light, and NA Avogadro's number. Over a broad range of concentration, the refractive index of the solution is well described by a linear function of total w/v protein concentration,
 |
(3) |
where wi denotes the w/v concentration of the ith species, and  (17).
(17).
For a solution of up to three scattering species, Eq. 1 expands to
 |
(4) |
Application of concentration fluctuation theory (14) to a mixture of three species, indexed by i, j, and k yields
 |
(5) |
 |
(6) |
 |
(7) |
where
 |
(8) |
and γi and ρi denote, respectively, the thermodynamic activity coefficient and number density of the ith species. The reader may verify that in the limit of low concentration, i.e., as wi and ζij tend toward zero for all i and j, Eqs. 4–8 reduce to the classical result obtained for ideal solutions (18)
 |
(9) |
where Mw denotes the weight average molar mass  and that for a single species at arbitrary concentration, Eqs. 4–8 reduce to the textbook result (18)
 |
(10) |
Scattering from a solution of multiple protein species modeled as hard spherical particles
Rationale and justification for hard sphere model
The effective interaction or potential of mean force between two globular protein molecules in solution may be represented as a sum of two contributions: a hard repulsive interaction due to mutual impenetrability (excluded volume), and a soft interaction reflecting forces between the molecules at distances greater than steric contact. While the hard interaction may be assumed to be independent of solution conditions so long as the protein retains its native three-dimensional structure, the soft interaction may be either attractive or repulsive depending upon the relative strengths of electrostatic and hydrophobic contributions under a particular set of experimental conditions (e.g., pH, buffer composition, temperature) (19). Experimental studies of protein solutions at high concentration carried out under conditions such that soft interactions are largely damped out have revealed that the magnitude of the hard excluded volume interaction between proteins may be estimated semiquantitatively using approximate equations of state for fluids of hard convex particles, in which each protein species is represented by an equivalent hard convex particle of size and shape comparable to that of the actual molecule (7,20). Although such equations of state have been developed for fluids of mixtures of arbitrarily shaped convex particles (21,22), it has been found that so long as a protein is reasonably compact and quasi-spherical (i.e., the largest dimension exceeds the smallest dimension by less than a factor of ∼2), it may be represented by a hard spherical particle of similar volume without introduction of major quantitative error (19). We therefore calculate the values of ζij appearing in Eqs. 5–7 using expressions given in the Appendix, with geometric constants appropriate for hard sphere fluid mixtures (21–23).
It has been pointed out (24) that even though the intensity of light directly scattered by small cosolutes such as salts is negligible relative to that scattered by macrosolutes, the multicomponent theory of light scattering (14,16) predicts that thermodynamic interactions between small cosolutes and macrosolutes may affect the concentration fluctuations of macrosolutes and thus indirectly influence the dependence of light scattering upon macrosolute concentration. The results of test calculations (available upon request) indicate that the presence of 0.15 M NaCl is likely to produce at most a slight effect on the scattering of typical proteins, and that such an effect may be readily accommodated within the context of the effective hard particle model used here to model the nonideal contribution to the concentration dependence.
Single nonassociating protein species
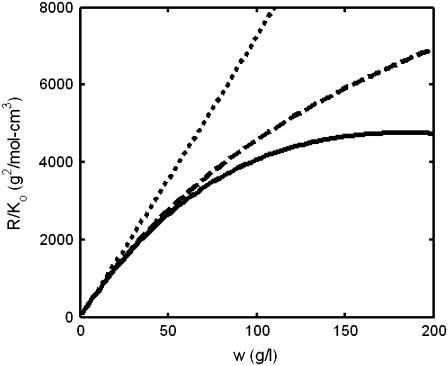
In Fig. 1, the normalized scattering intensity is plotted as a function of the w/v concentration of a 70,000 MW nonassociating protein, modeled as a hard sphere of specific volume 0.73 cm3/g. (For brevity, protein molar masses will subsequently be written in units of 1000, e.g., 70 K.) Also plotted for comparison are the ideal scattering, calculated according to
 |
(11) |
and the scattering calculated taking into account only the first-order correction for thermodynamic nonideality (second virial coefficient for hard spheres),
 |
(12) |
where veq denotes the specific volume of the equivalent sphere in inverse w/v concentration units. We note that actual scattering deviates significantly from ideal scattering (Eq. 11) at concentrations exceeding ∼20 g/l, and deviates significantly from that predicted by the first-order correction to ideality (Eq. 12) at concentrations exceeding ∼50 g/l.
FIGURE 1.
Dependence of normalized scattering intensity upon concentration of a monomeric protein (molar mass M = 70 K) calculated with full accounting for excluded volume effects as described in text (solid line), calculated with a first-order correction for excluded volume (dashed line), and calculated with no correction for excluded volume (dotted line).
Nonassociating mixture of proteins
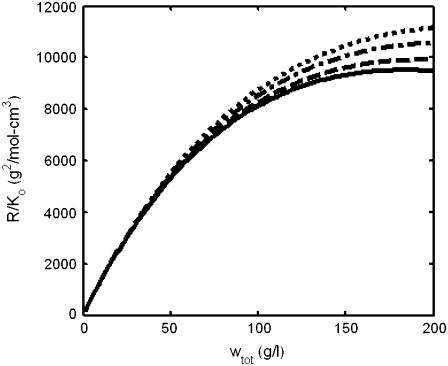
In Fig. 2, normalized scattering intensity is plotted as a function of total protein concentration for several solutions of different composition with identical weight-average molar mass. At low concentrations, the concentration dependence of all solutions is identical, but differences in composition result in a 15–20% variation in scattering intensity at total w/v concentrations approaching 200 g/l.
FIGURE 2.
Dependence of normalized scattering intensity upon concentration of protein solutions of different composition but identical weight-average molar mass (Mw = 140 K). (Solid line) A single protein species with M = 140 K. (Dot-dashed line) A mixture of proteins with M1 = 70 K and M2 = 280 K in the mass ratio 2:1. (Dotted line) A mixture containing proteins with M1 = 70 K and M2 = 420 K in the mass ratio 4:1. (Dashed line) A mixture containing proteins with M1 = 70 K, M2 = 140 K, and M3 = 210 K in the mass ratio 1:1:1.
Self-associating protein
We consider the case of a single protein A of molar mass M1 that may reversibly self-associate to form one or more oligomers Ai with thermodynamic equilibrium association constants given by
 |
(13) |
where ai, γi, and ci denote the thermodynamic activity, activity coefficient, and molar concentration of i-mer, respectively. It follows from Eq. 13 that the concentrations of monomer and i-mer are related by an apparent equilibrium constant
 |
(14) |
In a concentrated solution, such that a substantial fraction of solution volume is occupied by protein, steric exclusion results in values of γ1 and γi that are significantly greater than unity, and depending upon the association scheme, the value of Ki may differ significantly from  (25). Therefore, under highly nonideal conditions, the composition of a solution containing monomer in equilibrium with one or more oligomers should, in principle, be calculated in an iterative fashion, as described previously by Chatelier and Minton (5) and Snoussi and Halle (26). In the present work, the equilibrium solution composition corresponding to a given total w/v protein concentration is calculated as follows:
A value of veq is specified.
The value of ctot is set equal to wtot/M1.
Initial values of the Ki are set equal to the

- The equation of conservation of mass
is solved numerically for c1, and the remaining ci are then calculated via Eq. 14.
(15) The values of the lnγi are calculated from the ci and veq as described in the Appendix, representing each species by a hard sphere with volume proportional to mass.
- The apparent equilibrium constants are recalculated according to

(16)
Steps 4–6 are repeated iteratively until the values of all ci converge. Our criterion of convergence is that between successive iterations the concentrations of all species remain constant to within one part in 1000. The weight-average molar mass may then be calculated according to
 |
(17) |
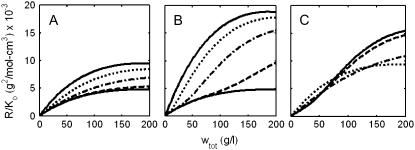
In Fig. 3, normalized scattering intensity is plotted as a function of total w/v protein concentration for three self-association schemes and various combinations of equilibrium association constants within each scheme. It is evident that even at very high concentrations, the scattering intensity is sensitive to changes in solution composition resulting from concentration-dependent self-association, and that, at least in principle, information about weak self-associations that are manifested only at high total protein concentration may be obtained from analysis of an experimental measurement of the dependence of scattering intensity on total protein concentration.
FIGURE 3.
Dependence of normalized scattering intensity upon total protein concentration in solutions of a self-associating protein with M1 = 70 K. (A) Monomer-dimer. (Lower solid curve) Pure monomer; (upper solid curve) pure dimer; (dashed curve) K2 = 10 M−1; (dot-dashed curve) K2 = 100 M−1; (dotted curve) K2 = 1000 M−1. (B) Monomer-tetramer. (Lower solid curve) Pure monomer; (upper solid curve) pure tetramer; (dashed curve) K4 = 106 M−3; (dot-dashed curve) K4 = 108 M−3; (dotted curve) K4 = 1010 M−3. (C) Monomer-dimer-tetramer. (Solid curve) K2 = 0, K4 = 108 M−3; (dashed curve) K2 = 102 M−1, K4 = 108 M−3; (dot-dashed curve) K2 = 103 M−1, K4 = 108 M−3; (dotted curve), K2 = 104 M−1, K4 = 108 M−3.
A simple semiempirical approximation for inclusion of nonideal effects on scattering
We define an experimentally measurable quantity called the apparent weight-average molar mass,
 |
(18) |
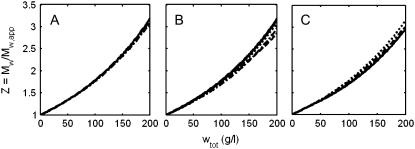
which becomes equal to the true weight-average molar mass in the ideal (low concentration) limit. In Fig. 4, we plot the value of the ratio Mw/Mw,app calculated as a function of wtot for each of the self-association schemes used to create Fig. 3. Although the shapes of these plotted curves depend in detail upon the composition of the scattering species, and can vary by 10–20% at total protein concentrations approaching 200 g/l, the similarity between them suggests that a single universal function, denoted by Z, may be a useful approximation to the actual value of Mw/Mw,app. It follows that
 |
(19) |
FIGURE 4.
Dependence of the ratio Mw/Mw,app upon total concentration of protein in solutions of a self-associating protein with M1 = 70 K. Reaction schemes and association constants within a given reaction scheme are the same as given in the caption to Fig. 3.
The form of Z is further suggested to be that of the exact ratio for a single species, calculated from (10)
 |
(20) |
The value of this function is known quite accurately for a fluid of identical hard spheres over a broad range of concentration (11), and we propose that it be used as an approximate universal ratio between actual and apparent weight-average molar masses,
 |
(21) |
where φ denotes an effective fraction of occupied volume, the value of which is calculated according to
 |
(22) |
In this formulation, veq becomes a semiempirical parameter, the value of which is to be estimated by modeling as described below. Since the volume excluded by one macromolecule to another macromolecule must exceed the volume excluded by that macromolecule to solvent (27), we obtain the lower bound,
 |
(23) |
where  denotes the partial specific volume of solute, approximately equal to 0.73 cm3/g for most polypeptides (Appendix 2 of (28)). Combination of Eqs. 19 and 23 yields the following lower bound to the weight-average molar mass:
 |
(24) |
Testing the semiempirical approximation via analysis of simulated data
On the basis of results of simulations of sedimentation equilibrium in concentrated solutions of multiple macrosolute species, Chatelier and Minton (5) suggested that the effect of repulsive nonideal interactions between multiple solute species upon solution properties may be modeled by an effective single species approximation. Subsequently, Muramatsu and Minton (4) employed this approximation to analyze the results of sedimentation equilibrium experiments carried out on self-associating proteins over a range of concentrations extending to 200 g/l. The validity of the approximate analysis of Muramatsu and Minton was later confirmed by a rigorous analysis of the same data carried out by Zorrilla et al. (8).
Although experimental methods for semiautomated measurement of scattering of protein solutions over a broad concentration range are currently under development in our laboratory, actual scattering data on nonassociating mixtures of proteins and self-associating proteins over a sufficiently broad range of concentration are still lacking as of the date of writing. We therefore test the approximate analysis suggested in the preceding section by generating synthetic data sets of normalized scattering intensity as a function of concentration over a broad concentration range (0.2–200 g/l, in equal logarithmic increments), utilizing the full treatment of nonideality described above and in the Appendix. A value of veq = 1.0 cm3/g (27) was used for all simulations. Normally distributed pseudo-noise, with a standard deviation equal to 3% of the theoretical value, was added to the calculated scattering to simulate experimental uncertainty of measurement (29).
Nonassociating protein mixtures
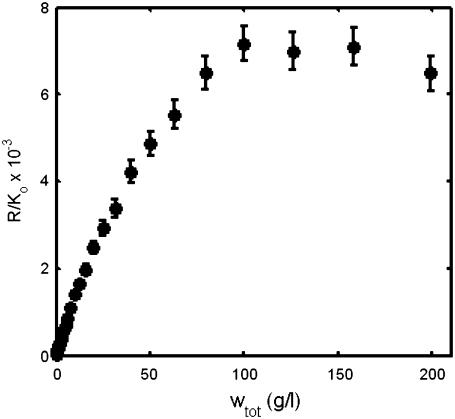
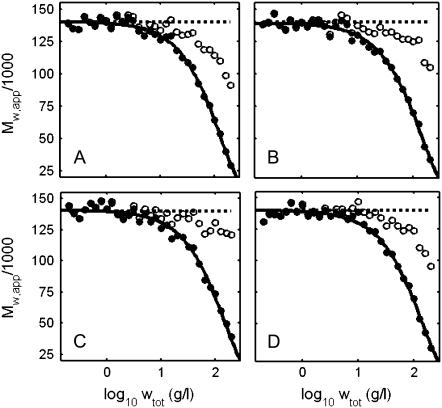
Sets of experimental data were generated for four solutions with different composition and equal weight-average molar mass, as described in the caption to Fig. 2. The data set for one mixture is plotted in Fig. 5, and may be compared with the corresponding generating function plotted in Fig. 2. Using Eqs. 3 and 18, each data set was transformed to an equivalent data set of the form {log wtot, Mw,app}, plotted in Fig. 6, A–D. Values of Mw,min were calculated according to Eq. 24 and are plotted together with the data in each panel. It is noted that in no case does Mw,min exceed the limiting value at low concentration, indicating that it may be possible to account for the data without postulating concentration-dependent association. This was confirmed by fitting Eq. 19 to each of the data sets by nonlinear minimization of χ-square to determine best-fit values of Mw (assumed independent of concentration) and veq. Curves calculated using best-fit parameter values given in the figure caption are also plotted in each panel.
FIGURE 5.
Simulated experimental dependence of R/Ko upon wtot for a solution containing an equal amount (by weight) of three proteins with molar masses 70 K, 140 K, and 210 K. Error bars correspond to ±2 SD.
FIGURE 6.
Simulated experimental dependence of Mw,app (•) and calculated dependence of Mw,min (○) upon the logarithm of wtot for the following solutions of nonassociating proteins with Mw = 140 K: (A) 140 K; (B) 70:280 K 2:1; (C) 70:420 K 4:1; and (D) 70:140:210 K 1:1:1. Solid curves are calculated using Eq. 18 with the following best-fit parameter values: (A) Mw = 140 K, veq = 1.01. (B) Mw = 139 K, veq = 0.90. (C) Mw = 140 K, veq = 0.88. (D) 140 K, veq = 0.94.
Self-associating proteins
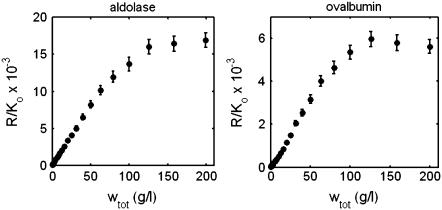
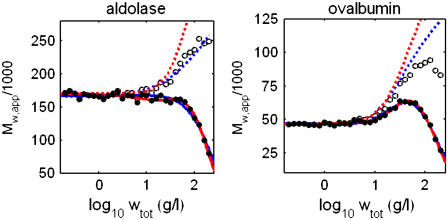
Association schemes and equilibrium constants used to generate synthetic data sets simulating the scattering behavior of aldolase and ovalbumin are specified in Table 1. These values were taken from Muramatsu and Minton (4), who found that the sedimentation equilibrium of aldolase and ovalbumin up to 200 g/l could be accounted for quantitatively by either of two self-association schemes. To avoid biasing our modeling results in favor of either scheme, we generated synthetic data of the form {wtot, R/Ko} using each association scheme and then averaged them to obtain the final synthetic data sets plotted in Fig. 7. Using Eq. 18, the simulated data were transformed into equivalent sets of data of the form {log wtot, Mw,app}. These data are plotted in Fig. 8, along with the corresponding values of Mw,min calculated according to Eqs. 23 and 24. The monotonically increasing character of Mw,min with concentration clearly indicates that self-association must be invoked to account for the observed concentration dependence of scattering of either protein.
TABLE 1.
Comparison of equilibrium association schemes and parameters used to generate synthetic data sets, and association schemes and parameters obtained via the approximate analysis described in the text
| Generating parameters
|
Best-fit parameters
|
||||||
|---|---|---|---|---|---|---|---|
| Protein | Self-association scheme | M1/1000 | log  [M−(i−1)] [M−(i−1)] |
veq (cm3/g) | M1/1000 | log Ki [M−(i−1)] | veq (cm3/g) |
| Aldolase | Monomer-dimer | 163 | 2.8 | 1.0 | 165 ± 3 | 2.8 ± 0.2 | 0.65* |
| Monomer-trimer | 169 | 6.1 | 1.0 | 170 ± 3 | 6.1 ± 0.2 | 0.97 | |
| Ovalbumin | Monomer-trimer | 46 | 5.8 | 1.0 | 46.5 ± 1 | 5.9 ± 0.1 | 0.90 |
| Monomer-dimer-tetramer | 44.5 | K2: 2.7 | 1.0 | 46 ± 2 | K2: 2.5 (−0.4,+0.3) | 1.09 | |
| K4: 8.9 | K4: 9.0 ± 0.2 | ||||||
Generating parameters (excepting veq) are taken from Muramatsu and Minton (4). Indicated uncertainty in values of best-fit parameters correspond to ±1 standard error of estimate, as determined by the distribution of χ2.
This value is within fitting uncertainty of the value of 0.73 cm3/g used to calculate Mw,min (Fig. 8, left-hand panel).
FIGURE 7.
Simulated experimental concentration dependence of light scattering of aldolase and ovalbumin solutions, calculated as described in the text. The data set for each protein is the mean of two data sets calculated using each of the alternate reaction schemes and parameter values specified in Table 1. Error bars correspond to ±2 SD.
FIGURE 8.
Simulated experimental dependence of Mw,app (•) and Mw,min (○) upon the logarithm of wtot for solutions of aldolase (left panel) and ovalbumin (right panel), calculated by application of Eqs. 18 and 23, respectively, to the data sets plotted in Fig. 6. Solid curves are calculated using the CM approximation with best-fit equilibrium models and parameter values specified in Table 1. Dashed curves indicate estimates of actual Mw calculated using the corresponding best-fit parameter values. Best fits of different association schemes are distinguished by color as follows. Aldolase: monomer-dimer (blue) and monomer-trimer (red). Ovalbumin: monomer-trimer (blue) and monomer-dimer-tetramer (red).
Equation 19, with concentration-dependent Mw calculated via Eq. 17 together with several association schemes, was fitted to each data set via nonlinear minimization of χ2. Inherent in this approximate analysis is the assumption that the various equilibrium constants are independent of concentration to within an acceptable level of precision (i.e., that  over the concentration range considered). Then solution composition may be obtained as a function of total protein concentration by simple nonrecursive solution of Eq. 15. Given the concentration-dependent value of Mw, approximate Eq. 19 is used to calculate the concentration-dependent value of Mw,app. The validity of these assumptions and the utility of the approximate analysis are demonstrated by the excellent agreement, shown in Table 1, between generating schemes and parameter values on the one hand, and the corresponding schemes and parameter values obtained via approximate analysis on the other hand.
SUMMARY AND CONCLUSION
The utility of the approximate analysis introduced here depends upon the validity of the underlying effective hard particle approximation as a description of repulsive nonideal interactions between protein molecules. Although subject to some restrictions, when experiments are carried out under appropriate conditions (19), the effective hard particle model has provided a simple, accurate, and useful description of the behavior of a variety of protein solutions at high total concentration (reviewed in (27) and (19)).
It is emphasized that to extract the maximum amount of information from the concentration dependence of light scattering, the acquisition of an equal density of data along the logarithmic concentration axis is essential, so that data obtained at both very low and very high concentrations receive equal statistical weight. Thus an experiment should be designed so that the concentration increases (or decreases) by an equal fraction rather than by an equal amount between samples. The ability to automatically prepare and deliver concentration gradients for light-scattering measurements has recently been developed and utilized to characterize reversible self-associations in dilute protein solution (29). We anticipate that in combination with the analysis presented here, this technology will prove useful in the detection and characterization of weak self-association in concentrated protein solutions as well.
Acknowledgments
The author thanks Drs. Peter McPhie (National Institutes of Health) and Daniel Some (Wyatt Technology) for helpful comments on preliminary drafts of this report.
This work was supported by the Intramural Research Program of the National Institute of Diabetes and Digestive and Kidney Diseases.
APPENDIX: CALCULATION OF ACTIVITY COEFFICIENTS AND CONCENTRATION DERIVATIVES OF ACTIVITY COEFFICIENTS IN A FLUID MIXTURE OF HARD CONVEX PARTICLES
Equivalent relations have been presented previously by Chatelier and Minton (5). They are reproduced here for convenience, notational consistency, and to correct a typographical error in Eq. A5 of the cited reference.
Consider a fluid containing multiple species of hard convex particles. Let the number density (N/cm3) of the ith species be denoted by ρi = ci NA/1000. The size and shape of the ith species of convex particles determine the values of a characteristic length ri expressed in units of centimeters, and three unitless shape descriptors hi, si, and vi (21). Boublik (22) derived the following relation for the activity coefficient of the ith species in this fluid mixture,
 |
(25) |
where Hi = hi ri, Si = si ri2, Vi = vi ri3,  and
and  The values Si and Vi denote the surface area and volume of the ith species of particle, and Hi denotes an effective radius defined by Kihara (30) to be equal to one-half of the length of the projection of the particle onto a single directional axis, averaged over all particle orientations relative to that axis. This relation may be simplified if all species are assumed to be represented by identically shaped particles, that is, for all i, hi = h, si = s, and vi = v. Then
 |
(26a) |
 |
(26b) |
 |
(26c) |
and
 |
(26d) |
Defining Q ≡ 1 − 〈V〉, we obtain the partial derivatives
 |
(27) |
If it is further assumed that all species are spherical, then h = 1, s = 4π, and v = 4π/3. The value of ri is estimated from the molar mass Mi and the specific exclusion volume veq, usually specified in units of cm3/g:
 |
(28) |
Editor: Elliot L. Elson.
References
- 1.Ferrone, F. A., and M. A. Rotter. 2004. Crowding and the polymerization of sickle hemoglobin. J. Mol. Recog. 17:497–504. [DOI] [PubMed] [Google Scholar]
- 2.Ponce, A., C. Sorensen, and L. Takemoto. 2006. Role of short-range protein interactions in lens opacifications. Mol. Vis. 12:879–884. [PubMed] [Google Scholar]
- 3.Shire, S. J., Z. Shahrokh, and J. Liu. 2004. Challenges in the development of high protein concentration formulations. J. Pharm. Sci. 93:1390–1402. [DOI] [PubMed] [Google Scholar]
- 4.Muramatsu, N., and A. P. Minton. 1989. Hidden self-association of proteins. J. Mol. Recog. 1:166–171. [DOI] [PubMed] [Google Scholar]
- 5.Chatelier, R. C., and A. P. Minton. 1987. Sedimentation equilibrium in macromolecular solutions of arbitrary concentration. I. Self-associating proteins. Biopolymers. 26:507–524. [DOI] [PubMed] [Google Scholar]
- 6.Chatelier, R. C., and A. P. Minton. 1987. Sedimentation equilibrium in macromolecular solutions of arbitrary concentration. II. Two protein components. Biopolymers. 26:1097–1113. [DOI] [PubMed] [Google Scholar]
- 7.Rivas, G., J. A. Fernandez, and A. P. Minton. 1999. Direct observation of the self-association of dilute proteins in the presence of inert macromolecules at high concentration via tracer sedimentation equilibrium: theory, experiment, and biological significance. Biochemistry. 38:9379–9388. [DOI] [PubMed] [Google Scholar]
- 8.Zorrilla, S., M. Jiménez, P. Lillo, G. Rivas, and A. P. Minton. 2004. Sedimentation equilibrium in a solution containing an arbitrary number of solute species at arbitrary concentrations: theory and application to concentrated solutions of ribonuclease. Biophys. Chem. 108:89–100. [DOI] [PubMed] [Google Scholar]
- 9.Prouty, M. S., A. N. Schechter, and V. A. Parsegian. 1985. Chemical potential measurements of deoxyhemoglobin S polymerization. Determination of the phase diagram of an assembling protein. J. Mol. Biol. 184:517–528. [DOI] [PubMed] [Google Scholar]
- 10.Magid, A. D., A. K. Kenworthy, and T. J. McIntosh. 1992. Colloid osmotic pressure of steer crystallins: implications for the origin of the refractive index gradient and transparency of the lens. Exp. Eye Res. 55:615–627. [DOI] [PubMed] [Google Scholar]
- 11.Minton, A. P., and H. Edelhoch. 1982. Light scattering of bovine serum albumin solutions: extension of the hard particle model to allow for electrostatic repulsion. Biopolymers. 21:451–458. [Google Scholar]
- 12.Xia, J., Q. Wang, S. Tatarkova, T. Aerts, and J. Clauwaert. 1996. Structural basis of eye lens transparency: light scattering by concentrated solutions of bovine α-crystallin proteins. Biophys. J. 71:2815–2822. [DOI] [PMC free article] [PubMed] [Google Scholar]
- 13.Xia, J., T. Aerts, K. Donceel, and J. Clauwaert. 1994. Light scattering by bovine α-crystallin proteins in solution: hydrodynamic structure and interparticle interaction. Biophys. J. 66:861–872. [DOI] [PMC free article] [PubMed] [Google Scholar]
- 14.Stacey, K. A. 1956. Light-Scattering in Physical Chemistry. Academic Press, New York.
- 15.Theisen, A., C. Johann, M. P. Deacon, and S. E. Harding. 2000. Refractive Increment Data-Book. Nottingham University Press, Nottingham, UK.
- 16.Stockmayer, W. H. 1950. Light scattering in multi-component systems. J. Chem. Phys. 18:58–61. [Google Scholar]
- 17.Barer, R., and S. Tkaczyk. 1954. Refractive index of concentrated protein solutions. Nature. 173:821–822. [DOI] [PubMed] [Google Scholar]
- 18.Tanford, C. 1961. Physical Chemistry of Macromolecules. Wiley & Sons, New York.
- 19.Hall, D., and A. P. Minton. 2003. Macromolecular crowding: qualitative and semiquantitative successes, quantitative challenges. Biochem. Biochim. Biophys. Acta. 1649:127–139. [DOI] [PubMed] [Google Scholar]
- 20.Minton, A. P. 1983. The effect of volume occupancy upon the thermodynamic activity of proteins: some biochemical consequences. Mol. Cell. Biochem. 55:119–140. [DOI] [PubMed] [Google Scholar]
- 21.Gibbons, R. M. 1969. The scaled particle theory for particles of arbitrary shape. Mol. Phys. 17:81–86. [Google Scholar]
- 22.Boublík, T. 1974. Statistical thermodynamics of convex molecule fluids. Mol. Phys. 27:1415–1427. [Google Scholar]
- 23.Lebowitz, J. L., E. Helfand, and E. Praestgaard. 1965. Scaled particle theory of fluid mixtures. J. Chem. Phys. 43:774–779. [Google Scholar]
- 24.Minton, A. P. 1981. Excluded volume as a determinant of macromolecular structure and reactivity. Biopolymers. 20:2093–2120. [Google Scholar]
- 25.Asthagiri, D., A. Paliwal, D. Abras, A. M. Lenhoff, and M. E. Paulaitis. 2005. A consistent experimental and modeling approach to light-scattering studies of protein-protein interactions in solution. Biophys. J. 88:3300–3309. [DOI] [PMC free article] [PubMed] [Google Scholar]
- 26.Snoussi, K., and B. Halle. 2005. Protein self-association induced by macromolecular crowding: a quantitative analysis by magnetic relaxation dispersion. Biophys. J. 88:2855–2866. [DOI] [PMC free article] [PubMed] [Google Scholar]
- 27.Zimmerman, S. B., and A. P. Minton. 1993. Macromolecular crowding: biochemical, biophysical, and physiological consequences. Annu. Rev. Biophys. Biomol. Struct. 22:27–65. [DOI] [PubMed] [Google Scholar]
- 28.Attri, A. K., and A. P. Minton. 1983. An automated method for determination of the molecular weight of macromolecules via sedimentation equilibrium in a preparative ultracentrifuge. Anal. Biochem. 133:142–152. [DOI] [PubMed] [Google Scholar]
- 29.Attri, A. K., and A. P. Minton. 2005. New methods for measuring macromolecular interactions in solution via static light scattering: basic methodology and application to nonassociating and self-associating proteins. Anal. Biochem. 337:103–110. [DOI] [PubMed] [Google Scholar]
- 30.Kihara, T. 1953. Virial coefficients and models of molecules in gases. Rev. Mod. Phys. 25:831–843. [Google Scholar]


