Abstract
Capillary array electrophoresis (CAE) microplates that can analyze 96 samples in less than 8 min have been produced by bonding 10-cm-diameter micromachined glass wafers to form a glass sandwich structure. The microplate has 96 sample wells and 48 separation channels with an injection unit that permits the serial analysis of two different samples on each capillary. An elastomer sheet with an 8 by 12 array of holes is placed on top of the glass sandwich structure to define the sample wells. Samples are addressed with an electrode array that makes up the third layer of the assembly. Detection of all lanes with high temporal resolution was achieved by using a laser-excited confocal fluorescence scanner. To demonstrate the functionality of these microplates, electrophoretic separation and fluorescence detection of a restriction fragment marker for the diagnosis of hereditary hemochromatosis were performed. CAE microplates will facilitate all types of high-throughput genetic analysis because their high assay speed provides a throughput that is 50 to 100 times greater than that of conventional slab gels.
To facilitate the completion of the Human Genome Project and to exploit the wealth of genetic information it is producing, the speed, throughput, and cost-effectiveness of DNA analysis will need to be significantly increased. For many years, slab gel systems have been used as the workhorse for gene mapping, DNA sequencing, and disease diagnosis. Recently, advances such as thin slab gels (1), capillary electrophoresis (CE) (2–5), and capillary array electrophoresis (CAE) (6–12) have significantly increased the performance of gel electrophoresis. However, to meet the growing demand for increased speed and sample throughput, more revolutionary approaches are needed.
The application of microfabrication technologies to the development of electrophoretic analysis devices has the potential to improve the throughput of DNA analysis by orders of magnitude. Microfabricated CE chips were developed in 1992 (13) and used to separate fluorescent dyes (14, 15) and fluorescently labeled amino acids (15–17). More recently, it has been shown that DNA restriction fragments (18–20), PCR products (18), short oligonucleotides (21), and even DNA sequencing fragments (22) can be rapidly and effectively separated with CE chips. Furthermore, integrated microdevices have been developed that can perform PCR amplification immediately followed by amplicon sizing (23), DNA restriction digestion and subsequent size-based separation (19), and cell sorting and membrane lysis of selected cells (24). The extension of these individual analysis devices to a high density array format would help address the needs of the Human Genome Project.
The development of a high density capillary array electrophoresis microplate presents unique and challenging issues. The design and layout must permit the analysis of many (≥96) samples on a small device, provide facile loading with no contamination, be easy to electrically address, and provide high quality separation and detection. We present here the development of a CAE microplate assembly consisting of a bonded micromachined glass sandwich, an elastomer overlayer, and an electrode array that accomplishes these goals. Detection is provided by a confocal fluorescence galvoscanner. We use the detection of variants of HFE, a gene whose variation is correlated with hereditary hemochromatosis (HHC) (25), to illustrate the utility of CAE microplates for population screening for genetic diseases. HHC is a genetic disorder ideally suited for large-scale population screening because it is identifiable with a simple PCR-based restriction assay and is treatable if detected early in the progression of the disease. This work demonstrates the utility of high-throughput CAE microplates for genotyping and further demonstrates the power of microfabrication in the production of multiplex DNA analysis devices.
EXPERIMENTAL SECTION
Microfabrication.
Borofloat glass wafers (Schott, Yonkers, NY) were pre-etched in 49% HF for 15 sec and cleaned before deposition of an amorphous silicon sacrificial layer (1500 Å) in a plasma enhanced chemical vapor deposition (PECVD) system (PEII-A, Technics West, San Jose, CA). The wafers were primed with hexamethyldisilazane, spin-coated with photoresist (Shipley 1818, Marlborough, MA) at 5,000 rpm, and then softbaked at 90°C for 30 min. The mask pattern was transferred to the substrate by exposing the photoresist to UV radiation in a Quintel contact mask aligner. The photoresist was developed in a 1:1 mixture of Microposit developer concentrate (Shipley) and H2O. The mask pattern was transferred to the amorphous silicon by a CF4 plasma etch performed in the PECVD reactor. The wafers were etched in 49% HF for 3 min at an etch rate of 7 μm/min, giving a final etch depth of 21 μm and channel width of ≈60 μm at the bonded surface. The photoresist was stripped and the remaining amorphous silicon was removed in a CF4 plasma etch. Holes were drilled into the etched plate with a 1.25-mm-diameter diamond-tipped drill bit (Crystalite, Westerville, OH). The etched and drilled plate was thermally bonded to a flat wafer of similar size in a programmable vacuum furnace (Centurion VPM, J. M. Ney, Yucaipa, CA). High quality bonds were typically achieved over the entire substrate. After bonding, the channel surfaces were coated by using a modified version of the Hjerten coating protocol (26, 27). A more detailed discussion of microfabrication methods is presented elsewhere (28).
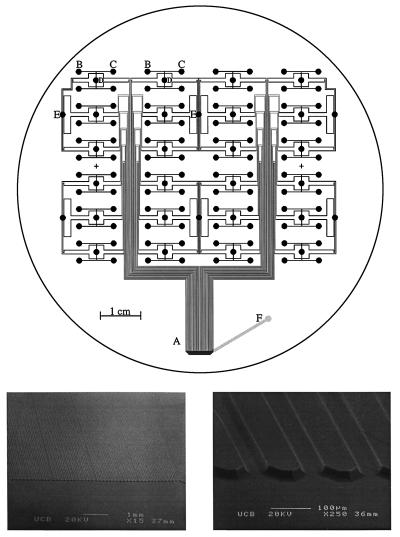
Fig. 1 Upper presents the mask design used to fabricate the CAE microplates. The lower images are scanning electron micrographs that demonstrate the etch quality over the entire array. Forty-eight individual separation channels were etched in a 150-μm periodic array in the detection region (A). The channels branch out to an 8 by 12 array of sample reservoirs that are spaced 9 mm apart to facilitate loading with an eight-tipped pipetter. The separation channels extend 10 cm from the injection region to the anode and about 1.75 cm from the injection region to the cathode. Two injection reservoirs (B and C) are coupled to each separation channel, allowing for serial injection of two samples. To reduce the number of access holes required for this design, injection waste reservoirs (D) are grouped so that only one is required for four injection reservoirs. The cathode reservoirs (E) are also connected to multiple (6 or 12) capillaries. The layout has been designed to keep the distance from anode to cathode the same for all separation channels. The anode (F) is placed off center to avoid conflict with the scanning objective. The number of reservoir holes for this pattern is  N + 7, where N is the number of samples, so 127 holes are required to run 96 samples. This hole count is close to the theoretical minimum (N + 3) obtained by grouping all the anode, cathode, and injection waste reservoirs.
Figure 1.
(Upper) Mask pattern for the 96-sample capillary array electrophoresis microplate. A is the detection region, B and C are injection reservoirs, D are waste reservoirs, E are cathode reservoirs, and F is the anode. The diameter of the circle indicates the 10-cm wafer sized substrate. (Lower) The scanning electron micrograph on the Left shows all 48 channels spaced 150 μm apart with a 200-μm spacing every 12 channels. The scanning electron micrograph on the Right presents a close-up of a portion of the array showing the 21-μm-deep etched channels.
Injection Method.
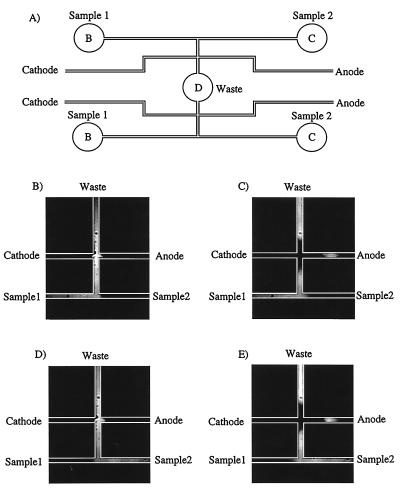
Fig. 2A presents the design of the sample injector that contains four sample reservoirs, two separation channels, and one injection waste reservoir. The injection method is demonstrated in Fig. 2 B–E by using fluorescein. In Fig. 2B, an injection voltage (300 V) is applied between sample reservoir 1 and the injection waste to draw sample into the cross-channel region. During injection, a biasing voltage (250 V) is used to reduce broadening of the injection plug because of diffusion into the cathode and anode channels. In Fig. 2C, the separation voltage (3,700 V) is applied between the cathode and anode, and the sample 1 and inject waste reservoirs are back-biased (720 V) to clear excess sample from the injection cross channel. A 100-μm-long sample plug is injected, and any residual sample is pulled away from the injection region to avoid tailing. Fig. 2 D and E presents analogous injections of sample 2. This injection method has been used successfully to inject up to four samples into a single capillary with no indications of cross-contamination (28).
Figure 2.
(A) Layout of the sample injector. The sample injector includes four sample reservoirs, two separation columns, and one common waste reservoir, labeled as in Fig. 1. (B–E) Fluorescence images illustrating the operation of the injector with fluorescein.
Sample Preparation.
Samples were prepared by using PCR amplification and digestion to assay the C282Y mutation in the HFE gene. This G → A mutation at nucleotide 845 creates a RsaI restriction site in the HFE gene (29). DNA was isolated from peripheral blood leukocytes by using standard methods (30). A segment of the HFE exon containing the variant site was amplified with the following primers: HH-E4B, 5′-GACCTCTTCAGTGACCACTC-3′; HC282R, 5′-CTCAGGCACTCCTCTCAACC-3′. The HC282R primer follows Feder et al. (25), whereas the HH-E4B primer is of our own design and contains a 5′ biotin tag. The 25-μl amplification reaction mixture contained 10 mM Tris⋅HCl (pH = 8.8), 50 mM KCl, 0.75 mM MgCl2, 0.2 mM dNTPs, 7.5 pmol of each primer, and 1.5 units of AmpliTaq DNA polymerase (Perkin–Elmer). The PCR was carried out under three consecutive conditions: 5 cycles of 95°C for 1 min, 64°C for 1 min, and 72°C for 1 min; 5 cycles of 95°C for 1 min, 60°C for 1 min, and 72°C for 1 min; and 25 cycles of 95°C for 1 min, 56°C for 1 min, and 72°C for 1 min. The restriction digestion of amplified product was carried out by adding 4 μl of each amplified sample to 6 μl of buffer containing 2 units of RsaI (Sigma) and digesting for 90 min at 37°C. Samples were dialyzed against deionized H2O on a 96-sample dialysis plate (Millipore). Sample types were initially established by separation of restriction fragments on 1% agarose/3% SeaPlaque (FMC Bioproducts) gel in 0.5× TBE (1× TBE = 9 mM Tris/64.6 mM boric acid/2.5 mM EDTA, pH 8.3). Gels were stained in 0.5 μg/ml ethidium bromide for 30 min and visualized on a UV transilluminator (Spectroline model TR-302) along with a 123-bp ladder (Life Technologies, Gaithersburg, MD) to determine fragment sizes.
Electrophoretic Methods.
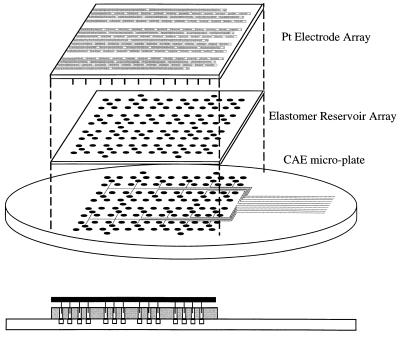
Previous experiments with CE chips (13–15, 18) and CAE chips (20) have used plastic pipette tips pushed into sample holes or tubing glued to the substrate to form reservoirs along with manual electrical contact. However, with 127 holes and reservoirs these approaches are impractical. To simplify sample handling and electrode introduction and to increase the volume of buffer in the cathode and anode reservoirs, an elastomer (Sylgard 184; Dow Corning) reservoir array and an electrode array were developed (Fig. 3). The elastomer reservoir array was placed onto the plate before filling the channels with separation medium, 0.75% (wt/vol) hydroxyethylcellulose (HEC) in 1× TBE buffer with 1 μM ethidium bromide. Ethidium bromide was used to fluorescently label the DNA because it is better suited for the available 532-nm excitation than the other stains and labels we have developed for 488-nm excitation (31). The 1-mm-thick elastomer sheet makes a water-tight seal when it is in contact with the glass and fully isolates the reservoirs from one another. The capillaries were pressure filled with sieving matrix from the anode until all channels were filled. The anode and cathode reservoirs were filled with 10× TBE buffer to reduce ion depletion during electrophoresis. Sample reservoirs were rinsed with deionized water and then samples (3.5 μl) were loaded from a microtiter plate by using an eight-tipped pipetter. The electrode array was fabricated by placing an array of platinum wires through a printed circuit board. Each wire corresponded to a reservoir on the plate, and the wires were connected with metal strips on the circuit board. The circuit board was placed on the elastomer array and used to address the individual reservoirs and reduce evaporation. The electrode array was connected to four computer-controlled power supplies (Stanford Research Systems, series PS300, Sunnyvale, CA), and a computer program written in LabVIEW (National Instruments, Austin, TX) was used to automatically time and switch the appropriate voltages.
Figure 3.
Schematic of the elastomer reservoir array and electrode array loading assembly. The elastomer loading array is placed on top of the microplate so that the holes in the elastomer are aligned with the drilled holes in the CAE microplate. The electrode array is then placed on top of the elastomer to address the reservoirs.
Instrumentation.
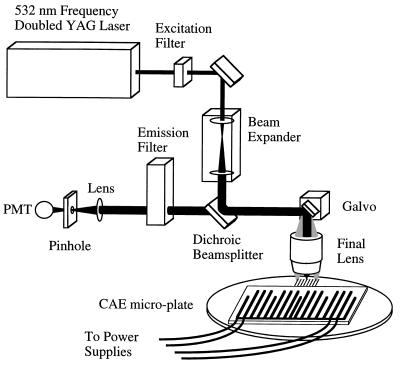
The CAE microplate was probed with a galvoscanner (Fig. 4) equipped with a doubled Nd:YAG (yttrium/aluminum garnet) laser (Uniphase, San Jose, CA). The 30-mW 532-nm beam was focused to a 5-μm spot and was scanned across the channels at 40 Hz. The beam was focused by using a 0.33 numerical aperture scan lens system designed for quantitative field analysis (32). The detection system consisted of an emission filter (545–620 nm) followed by a 400 μm pinhole, and has demonstrated a fluorescence detection limit of 1 molecule of Cy3 dye per 100 μm2. Data corresponding to spatially distinct fluorescent emission were acquired at 77 kHz with a 16-bit analog-to-digital converter (Burr–Brown, Tucson, AZ). Logarithmic data compression was used, resulting in 5 linear orders of dynamic measurement range. The data were obtained as a 16-bit TIFF image, and electropherograms were generated in IPLab (Signal Analytics, Vienna, Virginia) by summing data points across each channel.
Figure 4.
Schematic of the laser-excited galvoscanner and the CAE microplate assembly. PMT, photomultiplier tube.
RESULTS
A restriction fragment marker for HHC derived from the HFE gene was chosen to demonstrate the high-throughput analysis of biologically relevant samples with CAE microplates. HHC is a genetic disorder that causes a buildup of iron in tissues resulting over time in disease, primarily affecting the liver (33). Between 0.1% and 0.5% of the Caucasian population are homozygous for the HFE C282Y variant (34). If this condition is detected early, treatment can be initiated and long term effects avoided; thus high-throughput screening methods are needed.
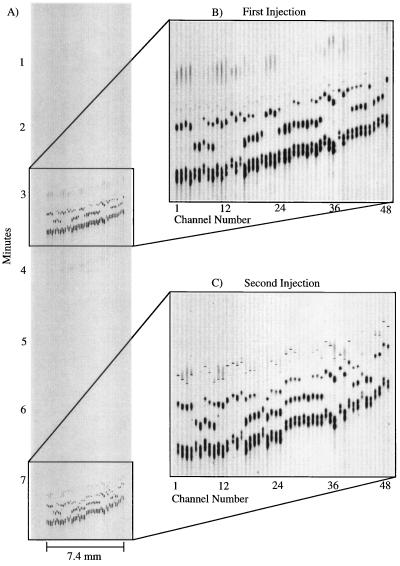
Fig. 5 presents an image of separations of 96 HFE amplicons on a CAE microplate. The 96 samples were separated in two runs of 48 samples, corresponding to the two injection reservoirs per channel. The width of the electrophoretic image shown is 7.4 mm for 48 lanes, and the complete analysis of 96 samples was performed in less than 8 min. The expanded images show that the bands are of high intensity and resolution. In this experiment, 19 different samples were dispersed among the 96 sample wells, giving a 5-fold redundancy in sample analysis. The normal allele (845G) exhibits two fragments, one at 167 bp and one at 140 bp; the variant (845A) shows three bands, at 167, 111, and 29 bp. The heterozygote types exhibit all four fragments. After accounting for the variation in migration time across the image caused by the asymmetric placement of the anode reservoir, the migration times are found to be consistent from lane to lane with a range of 199–204 sec (SD = 0.65%, 48 measurements) for the first injection and 205–215 sec (SD = 0.98%, 48 measurements) for the second injection. The migration times for the second injection are slower and less consistent because of ion depletion in the reservoirs.¶ The variation in migration times is comparable to that in other CAE chips (20) and conventional capillary arrays (6–12). The total run time for the two separations was 7.6 min, corresponding to an analysis time of less than 5 sec per sample.
Figure 5.
(A) Image of 96 RsaI-digested HFE amplicons analyzed in two sequential 48-sample separations. (B and C) Expanded views of the separation image from the first and second injection, respectively. The total time for the two separations was less than 7.6 min. Samples were separated on 0.75% (wt/vol) hydroxyethylcellulose in 1× TBE buffer with 1 μM ethidium bromide in the running buffer. The channels were 10 cm in length from the injection to the detection region. The injection was performed as described in the text and the applied fields for injection and separation were 300 V/cm.
The image in Fig. 5 shows that there is a variation in the migration times with the right lanes running ≈20 sec slower than the left. This is caused by a gradient in the electrophoresis voltages resulting from the placement of the anode to the side of the detection region. This placement of the anode was necessary to ensure adequate clearance from the objective; this distortion could easily be eliminated in a second-generation system by scanning from below or by adjusting the capillary lengths accordingly.
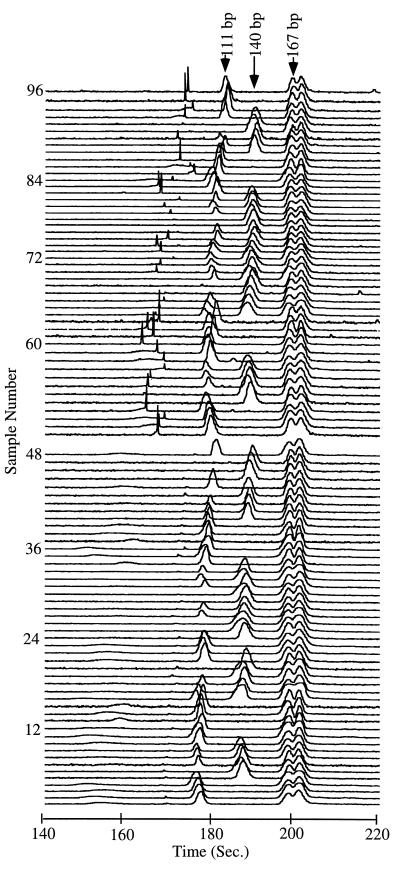
Fig. 6 presents the 96 electropherograms obtained from the image in Fig. 5. All electropherograms have been shifted to align the 167-bp doublet to compare the separations. The 167-bp fragment appears as a doublet because of the partial biotinylation of the HH-E4B primer; the biotinylated form accounts for the larger fragment in the doublet.‖ Although the biotinylated material could have been purified by using standard procedures, we found that the 167-bp doublet provides a useful reference for the alignment of the electropherograms. The average distance between the 111- and 140-bp bands is 7.3 sec, with SDs of 0.8 and 0.6 sec, respectively, for the first injection and 6.6 sec with SDs of 1.1 and 0.5 sec, respectively, for the second injection. By Student’s t test, the typings for both injections are determined to be at a >99.9% confidence level. All 96 samples were typed accurately and could easily be genotyped from either the electropherograms or the image.
Figure 6.
Electropherograms generated from the image of 96 HFE separations presented in Fig. 5. The electropherograms have been shifted by up to 10% to align the constant doublet peak at 167 bp. The three genotypes are characterized by (i) a single peak at 140 bp corresponding to the 845G type, (ii) a single peak at 111 bp corresponding to the 845A type, and (iii) the heterozygote type, which exhibits both the 140-bp and 111-bp peaks. Because the intensity of intercalation dye labeling is proportional to DNA fragment size, the 29-bp fragment is not observable in these displays.
DISCUSSION
We have designed, fabricated, and operated CAE microplates that can rapidly analyze 96 samples on a single device. This work shows that microfabrication techniques can be used to make high density arrays of capillaries over an entire 10-cm wafer without significant defects. Cathode, anode, and injection waste reservoirs are combined to reduce the number of holes to ≈ N. The array pattern places the sample reservoirs on 9-mm centers in one dimension to facilitate parallel loading of multiple samples. We have also demonstrated galvanometric scanning detection that provides sampling rates of >10 Hz with sufficient signal-to-noise ratio for high-sensitivity DNA analysis. With these CAE microplates, the analysis of 96 PCR product or double-stranded DNA fragment samples can be achieved in less than 8 min (<5 sec per sample). This is a 50- to 100-fold increase in throughput over conventional automated slab gel systems, where gel casting, loading, and running of 24–48 samples requires hours. The high throughput of these CAE microplates will facilitate rapid and inexpensive double-stranded restriction fragment screening for genetic diseases such as HHC. CAE microplates will also be valuable for single-stranded short tandem repeat analysis under denaturing conditions, following the methods recently developed by Wang and co-workers for forensic identification and cancer diagnosis (35, 36).
Several straightforward design modifications could further enhance the application of CAE microplates to genetic analysis. While the separation times are short, manual sample loading remains a time-consuming task. We are currently working on methods to automate both channel filling and sample loading. Serial injections are an effective method of increasing the sample throughput with a limited number of capillaries. Injection of four samples per channel is feasible and could be used to analyze 192 samples per plate. Alternatively, fabrication of 96 individual capillaries on a CAE microplate would increase the throughput 2-fold and ensure no sample contamination. The scanning detection system could be improved by inverting the objective and scanning from below. Placing the optics below the plate would permit facile manipulation and introduction of samples. Inverted scanning would also avoid spatial conflict with the anode reservoir, permitting central placement of the anode. With these variations it is easy to envision microplates in a wide variety of formats that can provide higher resolution separations, faster separations, or separations of more samples.
As the throughput of microdevices such as high density CAE microplates and oligonucleotide arrays (37) increases, convenient and low cost sample preparation will become a more important and significant challenge. Integrating an array of 96 PCR chambers with 96 capillaries on a chip, following the design concepts we presented previously (23), would enhance the utility of CAE microplates by eliminating sample tracking and manual transfer steps. This integration should also lead to reduced amplification sample volumes, which will reduce assay costs. Integration of electronic heaters, thermocouples, and detection systems together with an array of microfluidic capillaries in a single device would further enhance the capabilities and ease of operation of these DNA microprocessors.
Acknowledgments
We thank Bob Loder and Tom Armstrong for help with computer software and optics and Dr. David M. Baer of Kaiser Permanente Hospital in Oakland, CA, for providing patient samples for HHC testing. HFE genotyping work was supported in part by a grant from the Kaiser Foundation Research Institute to David M. Baer and G.F.S. Fabrication of CAE microplates was performed at the University of California, Berkeley, Microfabrication Laboratory. This research was supported in part by the Director, Office of Energy Research, Office of Health and Environmental Research of the U.S. Department of Energy under Contract DEFG-91ER61125 and by the National Institutes of Health under Grant HG01399 to R.A.M. Work at Molecular Dynamics was supported by National Institutes of Health Grant R01 HG01775-01 and by the National Institute of Standards and Technology under Grant 70 NANB5H1031.
ABBREVIATIONS
- CE
capillary electrophoresis
- CAE
capillary array electrophoresis
- HHC
hereditary hemochromatosis
Footnotes
The sharp peaks at the start of the second injection electropherograms are believed to be caused by false amplification products associated with the A/A and A/G genotypes. The amount of false amplification is equivalent for similar DNA types in the first and second injections. The peaks due to false amplification are sharper in the second injection because of increased stacking effects due to the electromigration of 10× TBE from the cathode to the injector.
Two peaks at ≈167 bp were also observed in polyacrylamide slab gel assays. The biotinylated form of the primer accounted for the larger fragment in the doublet. This was shown by amplification with a nonbiotinylated E4B primer, which yielded a single band corresponding to the smaller fragment of the two bands in the doublet; furthermore, adsorption of the biotinylated E4B PCR product on immobilized avidin removed the larger band (data not shown).
References
- 1.Kostichka A J, Marchbanks M L, Brumley R L, Jr, Drossman H, Smith L M. Bio/Technology. 1992;10:78–81. doi: 10.1038/nbt0192-78. [DOI] [PubMed] [Google Scholar]
- 2.Landers J P, Oda R P, Spelsberg T C, Nolan J A, Ulfelder K J. BioTechniques. 1993;14:98–111. [PubMed] [Google Scholar]
- 3.Drossman H, Luckey J A, Kostichka A J, D’Cunha J, Smith L M. Anal Chem. 1990;62:900–903. doi: 10.1021/ac00208a003. [DOI] [PubMed] [Google Scholar]
- 4.Swerdlow H, Gesteland R. Nucleic Acids Res. 1990;18:1415–1419. doi: 10.1093/nar/18.6.1415. [DOI] [PMC free article] [PubMed] [Google Scholar]
- 5.Cohen A S, Najarian D R, Karger B L. J Chromatogr. 1990;516:49–60. doi: 10.1016/s0021-9673(01)90203-1. [DOI] [PubMed] [Google Scholar]
- 6.Huang X C, Quesada M A, Mathies R A. Anal Chem. 1992;64:967–972. doi: 10.1021/ac00042a021. [DOI] [PubMed] [Google Scholar]
- 7.Huang X C, Quesada M A, Mathies R A. Anal Chem. 1992;64:2149–2154. doi: 10.1021/ac00042a021. [DOI] [PubMed] [Google Scholar]
- 8.Clark S M, Mathies R A. Anal Biochem. 1993;215:163–170. doi: 10.1006/abio.1993.1571. [DOI] [PubMed] [Google Scholar]
- 9.Takahashi S, Murakami K, Anazawa T, Kambara H. Anal Chem. 1994;66:1021–1026. [Google Scholar]
- 10.Ueno K, Yeung E S. Anal Chem. 1994;66:1424–1431. [Google Scholar]
- 11.Bashkin J, Bartosiewicz M, Roach D, Leong J, Barker D, Johnston R. J Capillary Electrophor. 1996;3:61–68. [PubMed] [Google Scholar]
- 12.Kheterpal I, Scherer J R, Clark S M, Radhakrishnan A, Ju J, Ginther C L, Sensabaugh G F, Mathies R A. Electrophoresis. 1996;17:1852–1859. doi: 10.1002/elps.1150171209. [DOI] [PubMed] [Google Scholar]
- 13.Manz A, Harrison D J, Verpoorte E M J, Fettinger J C, Paulus A, Ludi H, Widmer H M. J Chromatogr. 1992;593:253–258. [Google Scholar]
- 14.Harrison D J, Manz A, Fan Z, Ludi H, Widmer H M. Anal Chem. 1992;64:1926–1932. [Google Scholar]
- 15.Jacobson S C, Koutny L B, Hergenroeder R, Moore A W, Jr, Ramsey J M. Anal Chem. 1994;66:3472–3476. [Google Scholar]
- 16.Harrison D J, Fluri K, Seiler K, Fan Z, Effenhauser C S, Manz A. Science. 1993;261:895–897. doi: 10.1126/science.261.5123.895. [DOI] [PubMed] [Google Scholar]
- 17.Effenhauser C S, Manz A, Widmer H M. Anal Chem. 1993;65:2637–2642. [Google Scholar]
- 18.Woolley A T, Mathies R A. Proc Natl Acad Sci USA. 1994;91:11348–11352. doi: 10.1073/pnas.91.24.11348. [DOI] [PMC free article] [PubMed] [Google Scholar]
- 19.Jacobson S C, Ramsey J M. Anal Chem. 1996;68:720–723. doi: 10.1021/ac951230c. [DOI] [PubMed] [Google Scholar]
- 20.Woolley A T, Sensabaugh G F, Mathies R A. Anal Chem. 1997;69:2181–2186. doi: 10.1021/ac961237+. [DOI] [PubMed] [Google Scholar]
- 21.Effenhauser C S, Paulus A, Manz A, Widmer H M. Anal Chem. 1994;66:2949–2953. [Google Scholar]
- 22.Woolley A T, Mathies R A. Anal Chem. 1995;67:3676–3680. doi: 10.1021/ac00116a010. [DOI] [PubMed] [Google Scholar]
- 23.Woolley A T, Hadley D, Landre P, deMello A J, Mathies R A, Northrup M A. Anal Chem. 1996;68:4081–4086. doi: 10.1021/ac960718q. [DOI] [PubMed] [Google Scholar]
- 24.Li P C H, Harrison D J. Anal Chem. 1997;69:1564–1568. doi: 10.1021/ac9606564. [DOI] [PubMed] [Google Scholar]
- 25.Feder J N, Gnirke A, Thomas W, Tsuchihashi Z, Ruddy D A, Basava A, Dormishian F, Domingo R, Jr, Ellis M C, Fullan A, et al. Nature Genet. 1996;13:399–408. doi: 10.1038/ng0896-399. [DOI] [PubMed] [Google Scholar]
- 26.Hjerten S. J Chromatogr. 1985;347:191–198. [Google Scholar]
- 27.Clark S M, Mathies R A. Anal Chem. 1997;69:1355–1363. doi: 10.1021/ac960866g. [DOI] [PubMed] [Google Scholar]
- 28.Simpson, P. C., Woolley, A. T. & Mathies, R. A. (1998) Biomedical Microdevices 1, in press.
- 29.Calandro L, Thorsen T, Barcellos L, Griggs J, Baer D, Sensabaugh G F. Blood Cells Mol Dis. 1996;22:194a–194b. [Google Scholar]
- 30.Miller S A, Dykes D D, Polesky H F. Nucleic Acids Res. 1988;16:1215. doi: 10.1093/nar/16.3.1215. [DOI] [PMC free article] [PubMed] [Google Scholar]
- 31.Glazer A N, Mathies R A. Curr Opin Biotechnol. 1997;8:94–102. doi: 10.1016/s0958-1669(97)80163-2. [DOI] [PubMed] [Google Scholar]
- 32.Alexay C, Kain R, Hanzel D, Johnston R. Proc SPIE Int Soc Opt Eng. 1996;2705:63–72. [Google Scholar]
- 33.Bothwell T H, Charlton R W, Motulsky A G. In: The Metabolic and Molecular Bases of Inherited Disease. 7th Ed. Scriver C R, Beaudet A L, Sly W S, Valle D, editors. New York: McGraw-Hill; 1995. pp. 2237–2269. [Google Scholar]
- 34.Merryweather-Clarke A T, Pointon J J, Shearman J D, Robson K J H. J Med Genet. 1997;34:275–278. doi: 10.1136/jmg.34.4.275. [DOI] [PMC free article] [PubMed] [Google Scholar]
- 35.Wang Y, Wallin J M, Ju J, Sensabaugh G F, Mathies R A. Electrophoresis. 1996;17:1485–1490. doi: 10.1002/elps.1150170913. [DOI] [PubMed] [Google Scholar]
- 36.Wang Y, Hung S, Linn J F, Steiner G, Glazer A N, Sidransky D, Mathies R A. Electrophoresis. 1997;18:1742–1749. doi: 10.1002/elps.1150181007. [DOI] [PubMed] [Google Scholar]
- 37.Chee M, Yang R, Hubbell E, Berno A, Huang X, C, Stern D, Winkler J, Lockhart D J, Morris M S, Fodor S P A. Science. 1996;274:610–614. doi: 10.1126/science.274.5287.610. [DOI] [PubMed] [Google Scholar]


