

Abstract
To develop a simple, patient self-report based coronary heart disease (CHD) risk score for adults without previously diagnosed CHD (Personal HEART score) we used the Atherosclerosis Risk In Communities (ARIC) study, a prospective cohort of individuals 45–64 at baseline, to develop a measure for 10-year risk for CHD (n=14,343). The variables evaluated for inclusion included age, history of diabetes mellitus, history of hypercholesterolemia, history of hypertension, family history of CHD, smoking, physical activity and body mass index (BMI). Ten-year risk for CHD events defined as a myocardial infarction, fatal CHD or cardiac procedure. The new measure was compared to the Framingham Risk Score (FRS) and the European Systematic Coronary Risk Evaluation (SCORE). The Personal HEART score for men included age, diabetes, hypertension, hypercholesterolemia, smoking, physical activity and family history. Among men, the area under the receiver operator characteristic curve for predicting 10-year CHD for the Personal HEART score (0.65) was significantly different from the FRS (0.69) (p=.03) but not the European SCORE (0.62) (p=.12). The Personal HEART score for women included age, diabetes, hypertension, hypercholesterolemia, smoking, and BMI. The area under the curve for the Personal HEART score (0.79) for women was not significantly different from the FRS (0.81) (p=.42) and performed better than the European SCORE (0.69) (p=.01). In conclusion, the Personal HEART score identifies 10-year risk for CHD based on self-report data, is similar in predictive ability to the FRS and the European SCORE and has the potential for easy self-assessment.
Keywords: Coronary Heart Disease, heart disease risk
Many risk assessments are based on relatively simplistic strategies that have a clinician identify whether a “risk factor” is present. However, national guidelines advocate the use of scoring systems for CHD risk.1 Sophisticated methods like the Framingham Risk Score (FRS), the European Systematic Coronary Risk Evaluation (SCORE), the Sheffield risk and treatment table allow calculation of an individual’s risk as a function of the patient’s values on selected established coronary heart disease risk factors.2–7 The use of these scoring systems is limited by the need for laboratory measurements. They could potentially be improved with the addition of variables such as family history of premature CHD, physical activity and anthropometric measures of obesity.8–13 Several advantages of a scoring system based on personal self-report include the ease of data collection. Few studies have focused on creating CHD risk scoring systems based on patient self-reports.14,15 Thus, the purpose of this study is to develop a simple, patient self-report based CHD risk score for the general population without previously diagnosed CHD and compare the utility of this new measure with the FRS in a large multi-year cohort.
METHODS
For this study we used the Atherosclerosis Risk In Communities (ARIC) study public use data. The ARIC is a large scale, prospective cohort that also includes a community surveillance component and is composed of Black and Non-Black men and women, age 45–64 at entry (1987–89) with follow-up to December 31, 1998. Follow-up exams were conducted in 1990–92, 1993–95, and 1996–98.
The present analysis was limited to individuals who did not have previously diagnosed CHD or CHD identified at the baseline visit (visit 1). Although the ARIC data set has race information, the public use limited access data set is classified as Black or Non-Black. The Non-Black group is composed almost exclusively of Whites. Only 14 participants were American Indian and 34 considered themselves Asians. There were14,343 participants who met the criteria with 1108 CHD events.
Although >200 risk factors for CHD have been identified not all 200 are being considered for potential inclusion in this new risk factor scoring system.16 To be adopted into clinical practice it has been noted that in addition to being valid, a prediction tool must be intuitive and conceptually simple.17 The conceptual basis for the Personal Heart Early Assessment Risk Tool (HEART) score is to build on information that is readily obtainable from the patient by self-report and to evaluate the addition of variables that have not previously been included in widely used CHD risk scoring systems.
All of the variables were assessed during Visit 1 of the study. Thus, reports of being told by a physician that the participant had a condition like hypertension or hypercholesterolemia were based on reports of physician encounters prior to information provided in exams performed during the ARIC study. Models were created separately for men and women.
1.) Age
We examined age in 5 years increments.
2.) Family History of Myocardial Infarction/Heart Attack Before age 50
Participants reporting that they had a parent who was less than age 50 when they were told by a doctor that they had a heart attack were characterized as having a family history of premature CHD. Individuals who answered “yes” were counted as yes, while those who said “no” or “don’t know” were counted as no. This self-report classification was used for all of the variables.
3.) Previous Diagnosis of Hypertension
Both the FRS and the European SCORE require a blood pressure measurement at the time of assessment. The self-report measure of hypertension is based on whether a doctor has ever told the individual that he/she had high blood pressure or hypertension.
4.) Previous Diagnosis of Hypercholesterolemia
The FRS and the European SCORE both require laboratory assessments of lipids at the time of assessment. The self-report measure of hypercholesterolemia is based on whether a doctor had ever told them that they had high cholesterol.
5.) Previous Diagnosis of Diabetes
The self-report measure of diabetes is based on whether a doctor has ever told them that they had diabetes.
6.) Smoking Status
The self-report measure of cigarette smoking status was assessed as current, former and never. This was defined from two items in ARIC cohorts asking whether an individual has smoked enough to be considered an “ever” or “never” smoker and whether among ever smokers they are a current smoker. Current Smokers were defined as persons who are ever smokers who have smoked cigarettes during the previous year. Former Smokers were individuals who have smoked cigarettes in the past, but no longer smoke. Never Smokers were defined as persons who reported that they have never smoked.
7.) Physical Activity
We evaluated physical activity by whether subjects were asked if they exercise or play sports in their leisure time and their responses were classified as either never/seldom, sometimes, or often/very often.
8.) Obesity
Although the obesity measures are based on physical exams and not self-report we felt that they would be important to include because these types of variables (e.g., height, weight) are commonly collected based on self-reports and are easily assessed.
A) Body Mass Index (BMI)
Obesity was defined as a BMI (weight in kilograms divided by height in meters squared) ≥30.
B) Waist Circumference
Waist measurements were taken at the height of the umbilicus in ARIC. We classified men as having a large waist if it was greater than 102 cm (40 inches) and women as having a large waist if it was greater than 88cm (35 inches).18
The outcome is incident CHD in 10 years. CHD was defined as a myocardial infarction, fatal CHD or cardiac procedure. ARIC participants had follow-up interviews annually. Follow-up interviews included questions based on the Rose questionnaire for CHD.19 If the participant indicated a hospitalization, ARIC abstractors reviewed and recorded discharge diagnoses. Community surveillance involved obituary reviews as well as community death certificate surveillance for mortality. If mortality was identified, there was similar record abstraction for inhospital deaths or an interview with the family for deaths occurring out of the hospital. A special ARIC Morbidity and Mortality Classification Committee (MMCC) reviewed all hospitalizations and deaths to review and assign diagnoses for cardiovascular events and cause of death based on defined criteria.
Although the FRS for CHD has been computed in a variety of different ways since it was first presented we used the version that was presented in 1998.12 The FRS can be used for individuals without previous CHD and is computed using age, gender, measured total cholesterol, measured HDL cholesterol, systolic blood pressure, diabetes, and current smoking status. The European SCORE is computed using age, gender, whether a person lives in a low risk or high risk region, measured total cholesterol, measured HDL cholesterol, systolic blood pressure, and current smoking status.7 The European SCORE is designed to measure cardiovascular disease mortality. We estimated the US population as being in a high risk region.
All analyses except for ROC curves were conducted using SAS. The ROC analyses were computed with MedCalc. In an effort to see how well the new risk score classification works in predicting development of CHD we removed a 30% random sample from the ARIC prior to the development of the Personal HEART risk score classification. This hold-out sample was held for additional analysis to determine whether in a new sample, individuals can be correctly classified with respect to CHD based on the Personal Heart Score and the FRS and European SCORE.
We initially conducted Cox regression analyses to identify and examine the contributions of the different self-report measures for CHD as the potential basis for the Personal HEART Score. This strategy is similar to that used in the creation of the FRS12, the Charlson Comorbidity Index20, and the Functional Assessment Staging Scale (FAST).21 Categorical variables were used as dummy variables in the analysis.
Using an approach similar to that described by Charlson20 we developed scores based on the adjusted relative risks of the variables. Of the 8 originally entered variables that were selected based on theoretical significance, ones whose estimates were p>.05 were dropped from consideration. Because of the possibility of collinearity between BMI and waist circumference those variables assessing obesity were entered into separate models. A subsequent model was computed based on the reduced number of variables. Variables that were not statistically significant or had an adjusted relative risk of ≤1.2 were dropped from consideration as parts of the scoring system. Variables with an adjusted relative risk of >1.2 and <1.5 were assigned a score of 1. Variables with larger adjusted relative risks were rounded to the nearest whole number for their assigned weights.
The Personal Heart Score was validated in several ways. First, using the holdout sample we evaluated the ability of the Personal HEART scoring system to predict future CHD. We compared this new model from the holdout sample to the model yielded in the measure construction sample through the C-statistic value which assesses the goodness of fit of the model.22 Second, convergent validity was assessed through correlations between the Personal HEART Score and the FRS and European SCORE. Receiver Operating Characteristic (ROC) curves were computed for the Personal HEART score and the FRS and European SCORE individually by gender and then compared to determine if the areas under the curve were statistically significantly different.
The FRS has been suggested to be able to be divided into categories representing 10 year CHD risk groups of low, intermediate, and high.13,18 We split the Personal HEART Score into 10-year CHD risk categories of “low” (<10%), “intermediate” (10%–20%), and “high” (>20%).
RESULTS
The baseline characteristics of the men and women in the ARIC cohort are featured in Table 1. Table 2 indicates the hazard ratios from the reduced variable model among men as well as the assignment of risk score points based on the hazards ratios. Further, the Personal HEART score for men includes several variables not included in the FRS or the European SCORE, specifically family history of CHD and physical activity. In Table 3, the hazard ratios from the reduced variable model among women indicate a core set of variables similar to the men’s version but rather than having family history of CHD and physical activity in the scoring strategy, body mass index is included.
Table 1.
Characteristics of participants.
| Variable | Men (n=6239) | Women (n=8104) |
|---|---|---|
| Age (Mean±SD) | 54.4 ± 5.7 | 53.8 ± 5.7 |
| NonBlack | 77.0% | 71.1% |
| Family History Of CHD | 5.4% | 7.3% |
| History of Hypertension | 34.1% | 36.1% |
| Use of Hypertension Medications | 23.5% | 32.0% |
| Systolic Blood Pressure (mm Hg) | ||
| <120 | 49.2% | 53.8% |
| 120–129 | 22.4% | 19.5% |
| 130–139 | 13.6% | 11.9% |
| 140–159 | 11.4% | 11.2% |
| ≥160 | 3.3% | 3.7% |
| History of Hypercholesterolemia | 18.5% | 20.7% |
| Total Cholesterol (mg/dl) | ||
| <160 | 8.6% | 6.3% |
| 160–199 | 32.5% | 29.2% |
| 200–239 | 37.6% | 37.2% |
| 240–279 | 16.4% | 19.2% |
| ≥280 | 4.9% | 8.1% |
| HDL-Cholesterol (mg/dl) | ||
| <40 | 41.2% | 13.1% |
| 40–49 | 29.5% | 22.5% |
| 50–59 | 17.6% | 25.2% |
| ≥60 | 11.6% | 39.2% |
| History of Diabetes | 6.2% | 7.4% |
| Smoking Status | ||
| Never | 29.2% | 52.7% |
| Former | 43.3% | 22.4% |
| Current | 27.5% | 24.8% |
| Physical Activity | ||
| Often or Very Often | 19.1% | 14.6% |
| Sometimes | 27.6% | 25.1% |
| Seldom or Never | 53.3% | 60.2% |
| Body Mass Index (kg/m2) | ||
| <30 | 77.1% | 69.6% |
| ≥30 | 22.9% | 30.4% |
| Waist Circumference (cm) | ||
| Men <102 | 66.7% | -- |
| Men >102 | 33.3% | -- |
| Women ≤88 | -- | 37.6% |
| Women >88 | -- | 62.4% |
Table 2.
Cox’s regression predicting incident coronary heart disease among men and associated component scores for the Personal HEART Score.
| Hazard Ratio | 95% CI | Personal HEART Score | |
|---|---|---|---|
| Age (years) | |||
| 45–49 | 1.00 | --- | 0 |
| 50–54 | 1.15 | 0.87–1.52 | 0 |
| 55–59 | 1.63 | 1.26–2.12 | 2 |
| 60–64 | 1.94 | 1.50–2.51 | 2 |
| Family History Of CHD1 | 1.52 | 1.09–2.10 | 2 |
| History of Hypertension1 | 1.44 | 1.20–1.72 | 1 |
| History of Hypercholesterolemia1 | 1.54 | 1.26–1.88 | 2 |
| History of Diabetes1 | 1.86 | 1.42–2.44 | 2 |
| Smoking Status | |||
| Never | 1.00 | --- | 0 |
| Former | 1.15 | 0.92–1.44 | 0 |
| Current | 1.60 | 1.26–2.02 | 2 |
| Physical Activity | |||
| Often or Very Often | 1.00 | --- | 0 |
| Sometimes | 1.16 | 0.88–1.55 | 0 |
| Seldom or Never | 1.39 | 1.08–1.79 | 1 |
| Ten-Year CHD Risk | |||
| <10% | 0–2 | ||
| 10–20% | 3–5 | ||
| >20% | 6–12 | ||
Yes compared to reference category of no.
Table 3.
Cox’s regression predicting incident coronary heart disease among women and associated component scores for the Personal HEART Score.
| Hazard Ratio | 95% CI | Personal HEART Score | |
|---|---|---|---|
| Age (years) | |||
| 45–49 | 1.00 | --- | 0 |
| 50–54 | 1.57 | 1.07–2.30 | 2 |
| 55–59 | 2.04 | 1.40–2.96 | 2 |
| 60–64 | 2.27 | 1.55–3.32 | 2 |
| History of Hypertension1 | 2.43 | 1.86–3.16 | 2 |
| History of Hypercholesterolemia1 | 1.58 | 1.22–2.06 | 2 |
| History of Diabetes1 | 3.68 | 2.74–4.96 | 4 |
| Smoking Status | |||
| Never | 1.00 | --- | 0 |
| Former | 0.99 | 0.69–1.42 | 0 |
| Current | 3.22 | 2.47–4.22 | 3 |
| Body Mass Index (kg/m2) | |||
| <30 | 1.00 | --- | 0 |
| ≥30 | 1.47 | 1.14–1.90 | 1 |
| Ten-Year CHD Risk | |||
| <10% | 0–6 | ||
| 10–20% | 7–9 | ||
| >20% | 10–14 | ||
Yes compared to reference category of no.
Table 4 indicates the comparison of the area under the curve between the Personal HEART score and the FRS and European SCORE for both men and women. The ROC curves are presented in Figures 1 and 2. A comparison of the areas under the curve and C statistics indicate some differences between the Personal HEART score and the FRS and European SCORE. Among men the Personal HEART score is no different than the European SCORE but is not as good as the FRS. Among women the Personal HEART score is better than the European SCORE and no different than the FRS. The correlation between the Personal HEART score and the FRS among men was r=0.58 while it was r=0.70 among women. The correlation between the Personal HEART score and the European SCORE among men was r=0.55 while it was r=0.44 among women.
Table 4.
C statistic and area under the Receiver Operating Characteristic (ROC) curve using either the Personal HEART Score or the Framingham Risk Score or European SCORE to predict incident coronary heart disease in the holdout sample.
| Men
|
Women
|
|||||||
|---|---|---|---|---|---|---|---|---|
| C | ROC Area | 95% CI | P1 | C | ROC Area | 95% CI | P1 | |
| Personal HEART Score | 0.649 | 0.649 | 0.627–0.671 | 0.788 | 0.788 | 0.772–0.804 | ||
| Framingham Risk Score | 0.691 | 0.691 | 0.670–0.712 | 0.03 | 0.808 | 0.808 | 0.792–0.823 | 0.42 |
| European SCORE | 0.619 | 0.619 | 0.597–0.641 | 0.12 | 0.687 | 0.687 | 0.668–0.705 | 0.01 |
P value compared to Personal HEART Score.
Figure 1.
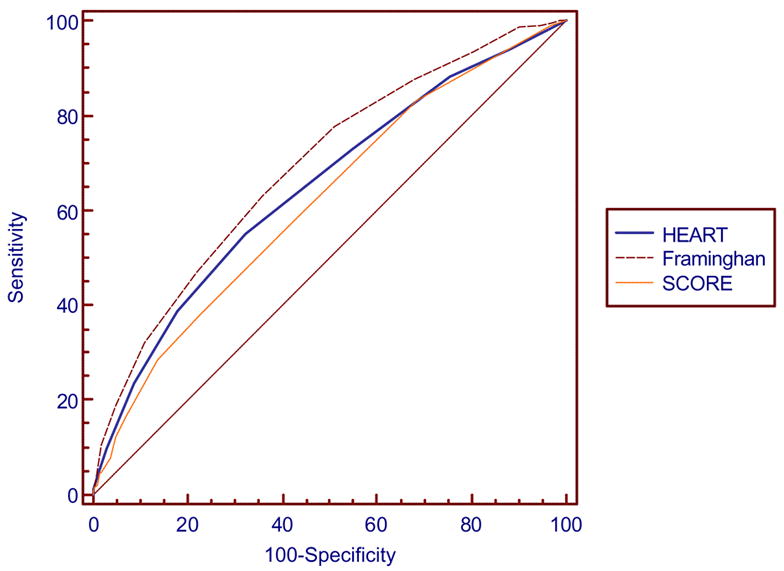
Comparison of ROC curves for the Personal HEART Score, the Framingham Risk Score and European SCORE among men in the holdout sample.
Figure 2.
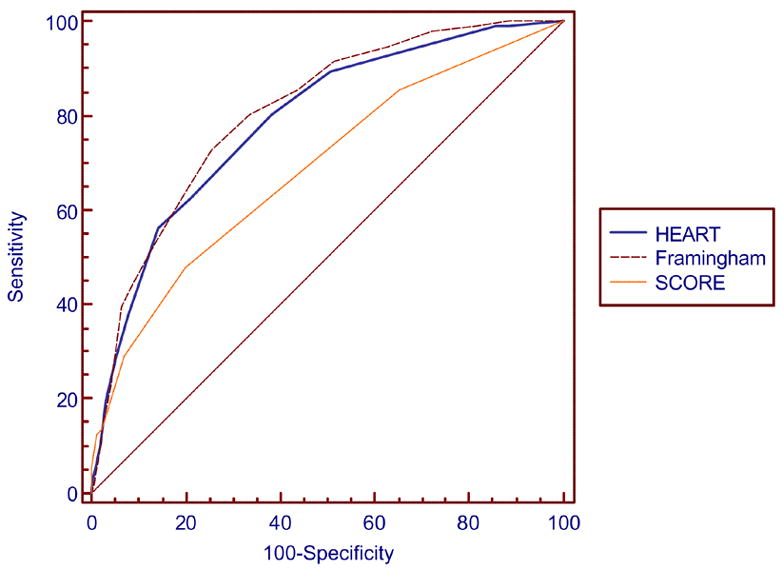
Comparison of ROC curves for the Personal HEART Score, the Framingham Risk Score and European SCORE among women in the holdout sample.
An additional Personal HEART scoring system was created following the same steps as those for men and women but combining men and women together and simply incorporating gender as a scorable characteristic. A combined male/female model included all of the investigated variables (age, gender, previous diagnosis of hypertension, previous diagnosis of hypercholesterolemia, previous diagnosis of diabetes, smoking, family history of CHD, physical activity and BMI). The area under the curve for this combined male/female Personal HEART score was 0.748 which is greater than that of the men only model and slightly less than the female only model.
For men and women, scores corresponding to risk categories of “low” (<10%), “intermediate” (10%–20%), and “high” (>20%) are shown in Table 3. Among men, 42.8% were categorized as low risk, 46.6% at intermediate risk and 10.6 % as high risk. Among women, 84.2% were categorized as low risk, 12.2% as intermediate risk and 3.6% as high risk.
DISCUSSION
Many studies have sought to improve CHD risk scoring systems by increasing the number of risk factors assessed, most often requiring clinicians to obtain more laboratory or exam data.13,23 In contrast, this study sought to develop and validate a risk score using self-report data, in order to provide a simple method of initial risk assessment to be used by clinicians immediately within one office visit and can be used by patients without requiring immediate access to a clinician to obtain laboratory or exam measurements. Self-reported measures for risk assessment have previously been used with high reliability in a variety of settings and populations.24,25 The value of such an easily computed measure may be that it allows patients to determine if they are at intermediate to high risk and prompts them to obtain further evaluation from their physician. The Personal HEART score could be implemented by clinicians as a quick and easy measure to be used as a teaching tool early in a patient encounter prior to the running of labs like lipid panels.
The Personal HEART score included several variables that are not included in commonly used CHD risk assessment tools like the FRS and the European SCORE. These additional variables include known CHD risk factors like family history of CHD, obesity and sedentary lifestyle. Moreover, the Personal HEART score has predictive utility similar to the FRS and the European SCORE. However, the Personal HEART score should be easier to compute than either of these alternative scoring systems because of its reliance on self-reports. For example, the interactive tool using the FRS featured on the National Heart, Lung and Blood Institute website cannot be completed by patients unless they have an average of at least two total cholesterol measures, at least two HDL cholesterol measures, and systolic blood pressure measured at the time of the assessment. The Personal HEART score can be computed by patients at any time.
There are several limitations to this study. The development of the Personal HEART score is based on the concept of using information that can be reliably provided by a patient and are known CHD risk factors. It is however, driven to some extent by the data available in the ARIC. This strategy of using available measures is not unique and was employed in the development of the FRS when they considered evaluating potential variables for inclusion.12 Second, the Personal HEART score did not include race/ethnicity in the computation. This was based on logistic, theoretical, and generalizability considerations. From a practical standpoint, the race information available in the public use ARIC data set was deemed too limited for use in creating a generalizable scoring system. Moreover, identifying Latinos or other ethnic groups may not be useful if there is a variety of genetic admixture and culture in the group.26 Consequently, finding variables that cut across ethnic groups seemed to be the most useful approach.
Footnotes
This project was supported in part by grant 1D14 HP 00161 from the Health Resources and Services Administration, grant 1 P30AG021677 from the National Institute on Aging, grant 5P60MD000267 (EXPORT) from the National Institutes of Health, and grant 051896 from the Robert Wood Johnson Foundation
Publisher's Disclaimer: This is a PDF file of an unedited manuscript that has been accepted for publication. As a service to our customers we are providing this early version of the manuscript. The manuscript will undergo copyediting, typesetting, and review of the resulting proof before it is published in its final citable form. Please note that during the production process errors may be discovered which could affect the content, and all legal disclaimers that apply to the journal pertain.
References
- 1.Expert Panel on Detection, Evaluation and Treatment of High Blood Cholesterol I Adults. Executive summary of the third report of the National Cholesterol Education Program (NCEP) expert panel on detection, evaluation and treatment of high blood cholesterol in adults (Adult Treatment Panel III) JAMA. 2001;285:2486–2497. doi: 10.1001/jama.285.19.2486. [DOI] [PubMed] [Google Scholar]
- 2.McMahan CA, Gidding SS, Fayad ZA, Zieske AW, Malcom GT, Tracy RE, Strong JP, McGill HC., Jr Risk scores predict atherosclerotic lesions in young people. Arch Intern Med. 2005;165:883–890. doi: 10.1001/archinte.165.8.883. [DOI] [PubMed] [Google Scholar]
- 3.Karp I, Abrahamowicz M, Bartlett G, Pilote L. Updated risk factor values and the ability of the multivariable risk score to predict coronary heart disease. Am J Epidemiol. 2004;160:707–716. doi: 10.1093/aje/kwh258. [DOI] [PubMed] [Google Scholar]
- 4.Jackson R, Barham P, Bills J, Birch T, McLennan L, MacMahon S, Maling T. Management of raised blood pressure in New Zealand: a discussion document. BMJ. 1993;307:107–110. doi: 10.1136/bmj.307.6896.107. [DOI] [PMC free article] [PubMed] [Google Scholar]
- 5.Haq IU, Jackson PR, Yeo WW, Ramsay LE. Sheffield risk and treatment table for cholesterol lowering for primary prevention of coronary heart disease. Lancet. 1995;346:1467–1471. doi: 10.1016/s0140-6736(95)92477-9. [DOI] [PubMed] [Google Scholar]
- 6.Anderson KM, Wilson PWF, Odell PM, Kannel WB. An updated coronary risk profile: a statement for health professionals. Circulation. 1991;83:356–362. doi: 10.1161/01.cir.83.1.356. [DOI] [PubMed] [Google Scholar]
- 7.Conroy RM, Pyorala K, Fitzgerald AP, Sans S, Menotti A, De Backer G, De Bacquer D, Ducimetiere P, Jousilahti P, Keil U, Njolstad I, Oganov RG, Thomsen T, Tunstall-Pedoe H, Tverdal A, Wedel H, Whincup P, Wilhelmsen L, Graham IM SCORE project group. Estimation of ten-year risk of fatal cardiovascular disease in Europe: the SCORE project. Eur Heart J. 2003;24:987–1003. doi: 10.1016/s0195-668x(03)00114-3. [DOI] [PubMed] [Google Scholar]
- 8.Ferdinand KC. Managing cardiovascular risk in minority patients. J National Med Assoc. 2005;97:459–466. [PMC free article] [PubMed] [Google Scholar]
- 9.Fletcher GF, Balady G, Blair SN, Blumenthal J, Caspersen C, Chaitman B, Epstein S, Sivarajan Froelicher ES, Froelicher VF, Pina IL, Pollack ML. Statement on exercise: benefits and recommendations for physical activity programs for all Americans: a statement for health professionals by the Committee on Exercise and Cardiac Rehabilitation of the Council on Clinical Cardiology, American Heart Association. Circulation. 1996;94:857–862. doi: 10.1161/01.cir.94.4.857. [DOI] [PubMed] [Google Scholar]
- 10.Manolio TA, Burke GL, Psaty BM, Newman AB, Haan M, Powe N, Tracy RP, O’Leary DH. Black-white differences in subclinical cardiovascular disease among older adults: the Cardiovascular Health Study. CHS Collaborative Research Group. J Clin Epidemiol. 1995;48:1141–52. doi: 10.1016/0895-4356(94)00240-q. [DOI] [PubMed] [Google Scholar]
- 11.Chambless LE, Folsom AR, Sharrett AR, Sorlie P, Couper D, Szklo M, Nieto FJ. Coronary heart disease risk prediction in the Atherosclerosis Risk in Communities (ARIC) study. J Clin Epidemiol. 2003;56:880–890. doi: 10.1016/s0895-4356(03)00055-6. [DOI] [PubMed] [Google Scholar]
- 12.Wilson PWF, D’Agostino RB, Levy D, Belanger AM, Silbershatz H, Kannel WB. Prediction of coronary heart disease using risk factor categories. Circulation. 1998;97:1837–1847. doi: 10.1161/01.cir.97.18.1837. [DOI] [PubMed] [Google Scholar]
- 13.Greenland P, Smith SC, Jr, Grundy SM. Improving coronary heart disease risk assessment in asymptomatic people: role of traditional risk factors and noninvasive cardiovascular tests. Circulation. 2001;104:1863–1867. doi: 10.1161/hc4201.097189. [DOI] [PubMed] [Google Scholar]
- 14.Hutchison B, Birch S, Evans CE, Goldsmith LJ, Markham BA, Frank J, Paterson M. Screening for hypercholesterolaemia in primary care: randomized controlled trial of postal questionnaire appraising risk of coronary heart disease. BMJ. 1998;316:1208–1213. doi: 10.1136/bmj.316.7139.1208. [DOI] [PMC free article] [PubMed] [Google Scholar]
- 15.Miller TD, Roger VL, Hodge DO, Gibbons RJ. A simple clinical score accurately predicts outcome in a community-based population undergoing stress testing. Am J Med. 2005;118:866–872. doi: 10.1016/j.amjmed.2005.03.013. [DOI] [PubMed] [Google Scholar]
- 16.Castelli WP. Lipids, risk factors and ischemic heart disease. Atherosclerosis. 1996;124(Suppl):S1–9. doi: 10.1016/0021-9150(96)05851-0. [DOI] [PubMed] [Google Scholar]
- 17.Liao L, Mark DB. Clinical prediction models: are we building better mousetraps? J Am College of Cardiol. 2003;42:851–853. doi: 10.1016/s0735-1097(03)00836-2. [DOI] [PubMed] [Google Scholar]
- 18.National Institutes of Health. NIH Publication 01–3670. Bethesda, MD: National Institutes of Health; 2001. Third Report of the National Cholesterol Education Program Expert Panel on Detection, Evaluation, and Treatment of High Blood Cholesterol in Adults (Adult Treatment Panel III) [Google Scholar]
- 19.Rose GA, Blackburn H, Gillum RF, Prineas RJ. Cardiovascular survey methods. 2. Geneva Switzerland: World Health Organization; 1982. [Google Scholar]
- 20.Charlson ME, Pompei P, Ales KL, MacKenzie CR. A new method of classifying rognostic comorbidity in longitudinal studies: development and validation. J Chron Dis. 1987;40:373–383. doi: 10.1016/0021-9681(87)90171-8. [DOI] [PubMed] [Google Scholar]
- 21.Mitchell SL, Kiely DK, Hamel MB, Park PS, Morris JN, Fries BE. Estimating prognosis for nursing home residents with advanced dementia. JAMA. 2004;291:2734–2740. doi: 10.1001/jama.291.22.2734. [DOI] [PubMed] [Google Scholar]
- 22.Pencina MJ, D’Agostino RB. Overall C as a measure of discrimination in survival analysis: model specific populations value and confidence interval estimation. Stat Med. 2004;23:2109–2123. doi: 10.1002/sim.1802. [DOI] [PubMed] [Google Scholar]
- 23.Ridker PM. Evaluating novel cardiovascular risk factors: can we better predict heart attacks? Ann Intern Med. 1999;130:933–937. doi: 10.7326/0003-4819-130-11-199906010-00018. [DOI] [PubMed] [Google Scholar]
- 24.Niccolai LM, Kershaw TS, Lewis JB, Cicchetti DV, Ethier KA, Ickovics JR. Data collection for sexually transmitted disease diagnoses: a comparison of self-report, medical record reviews, and state health department reports. Ann Epidemiol. 2005;15:236–42. doi: 10.1016/j.annepidem.2004.07.093. [DOI] [PubMed] [Google Scholar]
- 25.Daniels C, Huang GD, Feuerstein M, Lopez M. Self-report measure of low back-related biomechanical exposures: clinical validation. J Occupational Rehabilitation. 2005;15:113–28. doi: 10.1007/s10926-005-1214-z. [DOI] [PubMed] [Google Scholar]
- 26.Gonzalez Burchard E, Borrell LN, Choudhry S, Nagvi M, Tsai HJ, Rodriguez-Santana JR, Chapela R, Rogers SD, Mei R, Rodriguez-Clintron W, Arena JF, Kittles R, Perez-Stable EJ, Ziv E, Risch N. Latino populations: a unique opportunity for the study of race, genetics, and social environment in epidemiological research. Am J Public Health. 2005;95:2161–8. doi: 10.2105/AJPH.2005.068668. [DOI] [PMC free article] [PubMed] [Google Scholar]