

Abstract
• BACKGROUND
Pulse oximetry is commonly used to monitor oxygenation in neonates, but cannot detect variations in hemoglobin. Venous and arterial oxygen saturations are rarely monitored. Few data are available to validate measurements of oxygen saturation in neonates (venous, arterial, or pulse oximetric).
• PURPOSE
To validate oxygen saturation displayed on clinical monitors against analyses (with correction for fetal hemoglobin) of blood samples from neonates and to present the oxyhemoglobin dissociation curve for neonates.
• METHOD
Seventy-eight neonates, 25 to 38 weeks’ gestational age, had 660 arterial and 111 venous blood samples collected for analysis.
• RESULTS
The mean difference between oxygen saturation and oxyhemoglobin level was 3% (SD 1.0) in arterial blood and 3% (SD 1.1) in venous blood. The mean difference between arterial oxygen saturation displayed on the monitor and oxyhemoglobin in arterial blood samples was 2% (SD 2.0); between venous oxygen saturation displayed on the monitor and oxyhemoglobin in venous blood samples it was 3% (SD 2.1) and between oxygen saturation as determined by pulse oximetry and oxyhemoglobin in arterial blood samples it was 2.5% (SD 3.1). At a Pao2 of 50 to 75 mm Hg on the oxyhemoglobin dissociation curve, oxyhemoglobin in arterial blood samples was from 92% to 95%; oxygen saturation was from 95% to 98% in arterial blood samples, from 94% to 97% on the monitor, and from 95% to 97% according to pulse oximetry.
• CONCLUSIONS
The safety limits for pulse oximeters are higher and narrower in neonates (95%-97%) than in adults, and clinical guidelines for neonates may require modification.
Analysis of blood samples yields both functional measurements and fractional oxyhemoglobin measurements of oxygen saturation, whereas clinical monitors can indicate only functional oxygen saturations.1 (The relationship between functional and fractional measurements of oxygen saturation is as follows1:
For blood samples, oxygen saturation = oxyhemoglobin/[oxyhemoglobin + reduced hemoglobin], where [oxyhemoglobin+reduced hemoglobin] < 1.
For clinical monitor measurements, oxygen saturation = 1 – reduced hemoglobin, where [oxyhemoglobin+reduced hemoglobin]=1.)
Neonates have predominantly fetal hemoglobin in their blood, which has a high affinity for oxygen and thus releases less oxygen to the body tissues, following the principle of the oxyhemoglobin dissociation curve.2-4 To date, few data have been collected to support the appropriate safety ranges of oxygen saturation measured by clinical monitors in neonates. Pulse oximetry is commonly used in neonates to assess oxygenation (Spo2), but it does not detect changes in hemoglobin levels. Although the importance of monitoring venous and arterial oxygen saturation (Svo2 and Sao2) during nursing care is well established in adults,5-8 such monitoring is rarely used in neonates.9,10
Oximetry should be used with caution in neonates because it cannot account for all hemoglobin variations.
Therefore, the purposes of this study were (1) to validate the monitor measurements of Sao2, Svo2, and Spo2 against oxyhemoglobin measurements with correction for fetal hemoglobin, and (2) to present the oxyhemoglobin dissociation curves that show the association of oxyhemoglobin and oxygen saturation measurements with oxygen tension (Po2) values in neonates.
Background and Significance
The accurate measurement of oxygen saturation in neonates is dependent on the level of oxyhemoglobin after serum levels of carbon monoxide hemoglobin and methemoglobin and the effects of fetal hemoglobin have been accounted for.1,11,12 In healthy adults, levels of carbon monoxide hemoglobin and methemoglobin together are less than 2% for blood samples.1 In addition to carbon monoxide hemoglobin and methemoglobin, neonates have fetal hemoglobin, a variation of hemoglobin that has high affinity for oxygen2-4; therefore, the measurements from clinical oximeters should be used with caution because they cannot account for variations in type of hemoglobin.2-4,13-21
Only one published study22 provided complete information on the validation of Sao2 and Svo2 measurements in neonates; however, in that study the proportion of fetal hemoglobin was not determined, and its effects were not adjusted for when oxygen saturation measurements were calculated. When fetal hemoglobin effects are not adjusted for on hemoximeter tests, measurements of carbon monoxide hemoglobin are artificially increased, which then widens the differences between oxygen saturation and oxyhemoglobin readings and leads to inaccurate oxygen saturation values.3,4,11,12
Newer models of hemoximeter (after 1993) adjust oxygen saturation or oxyhemoglobin readings for fetal hemoglobin levels.19 However, a pulse oximeter can overestimate oxygen saturation by as much as 6% when fetal hemoglobin level is not calculated,3,4,23-25 leading clinicians to miss significant desaturation events. This problem also occurs in adults with abnormal hemoglobin; for example, in cases of congenital anemia,2 sickle cell or hemoglobin mutations,26,27 malignant blood-related cancers,2 diabetes,28 ketosis,29 pregnancy,30,31 or smoke inhalation.2,32
Transfusion of adult blood to neonates may decrease the fetal hemoglobin content and increase the adult hemoglobin content, thereby increasing tissue oxygenation33; however, such transfusion also can add a burden to neonates’ cardiac function.2,34 To prevent oxygen poisoning following blood transfusions in neonates, oxygenation status should be monitored closely, as right-shifting oxyhemoglobin curves result in more oxygen being released to the tissues.33,35
When Sao2 and Svo2 are monitored together they can offer insights into oxygen demand7 and provide complete information on systemic oxygenation balance.7,8 During nursing care and interventions, decreases in Svo2 occur sooner and in more obvious increments than do decreases in Sao2 6,10; the 2 measurements together provide a more complete assessment of oxygenation status than either alone.7,8 However, Svo2 is rarely monitored or measured in neonates.
Previous studies36,37 in neonates have indicated that the mean difference between Sao2 displayed on the clinical monitor (monitor Sao2) and Spo2 is 2% without consideration of fetal hemoglobin. In adults, the difference between monitor Sao2and blood oxyhemoglobin is 3%.38 The mean differences between monitor Sao2 and Spo2 in neonates can be from 5% to 6% when desaturation occurs during mechanical ventilation.25 Widely spread Spo2 readings have been reported with Pao2 values, without provision of a reasonably precise oxyhemoglobin dissociation curve.39,40
A pulse oximeter can overestimate SO2 by as much as 6%.
The accuracy of pulse oximetry is limited when the readings decrease below 80%,14,41-43 particularly in neonates with fetal hemoglobin.25,44 The normal clinical range for Pao2 is defined as 50 to 75 mm Hg for infants.45 In adults, an Spo2 of 85% to 94% is associated with a Pao2of 50 to 75 mm Hg.46,47 Comparable ranges of oxygen saturation measurements that account for fetal hemoglobin must be established for neonates. A previous article48 focused on use of paired arterial and venous blood samples to obtain accurate measurements of oxygen saturation. In this article we extend those findings by including additional blood and monitor measurements to validate clinical safety limits for use in neonates.
Methods
Setting
This study is part of a larger clinical study involving around-the-clock data collection for neonates in 4 neonatal intensive care units. The appropriate institutional review boards for human subjects approved the study protocols. Informed consent was obtained from the parents and guardians of all neonate subjects either before or immediately after the births. As part of care for ventilatory support in neonatal intensive care units, umbilical artery catheters or umbilical venous catheters were inserted to assess blood oxygen levels and to provide nutrients. Umbilical artery catheters were inserted at the level of thoracic vertebrae 6 to 9 because lower placements (at the level of lumbar vertebrae 4-6) were more likely to cause vascular spasm in the lower extremities.49 Umbilical vein catheters were inserted 1 cm (<2 cm) above the liver in the inferior vena cava.
The accuracy of pulse oximetry values below 80% in neonates is limited.
Sample
Neonates with a diagnosis of respiratory distress syndrome who required ventilatory support immediately after birth were included in the study. Gestational ages of the neonates were from 25 to 38 weeks, and birth weights were from 655 to 3800 g. Smaller neonates with lower birth weights could not be included because of restrictions in the safety protocol for blood volume and because the 4F size of the monitoring catheters could not be accommodated. Neonates with major congenital defects (heart, brain and neurological, or gastrointestinal defects) diagnosed at birth were excluded because of potential errors in measurement of Sao2 and Svo2. However, neonates with heart defects associated with persistent fetal circulations (such as patent ductus arteriosus or foramen ovale) were included in the study. Neonates with life-threatening persistent pulmonary hypertension who needed nitric oxide treatments or extracorporeal membrane oxygenation were excluded because of the amount of equipment required at the bedside.
The sample included 78 neonates who provided 771 blood samples. Sixty-nine neonates provided 660 arterial samples (range 1-23 samples each), 25 neonates provided 111 venous samples (range 1-12 samples each), and 16 neonates provided both arterial and venous samples. A priori power analysis indicated that 78 neonates with a mean of 9 repeated samples per neonate were needed for validation of oxygen saturation measurements with fetal hemoglobin determination.
Instruments
Fetal hemoglobin and all oxygen saturation parameters were measured by using a hemoximeter (cooximeter) model OSM3 (Radiometer Corp, Cleveland, Ohio) that uses 6-wavelength fiberoptic reflectance oximetry (535, 560, 577, 622, 636, and 670 nm). This co-oximeter, as reported by the manufacturer, has a test-retest variability of less than 0.1% for normal hemoglobin level and of -0.2% to +0.4% for extreme anemia and polycythemia (hemoglobin measurement ranges: 32 to 280 g/L).
The instrument allowed in vitro measurements of oxygen saturation, oxyhemoglobin level, total hemoglobin levels, and fetal hemoglobin concentrations through determination of P50 on the oxyhemoglobin dissociation curve. Validity was ensured by zero-point calibration with the manufacturer’s rinse solution before and after each test. Quality control procedures included use of the reference method every 8 hours, weekly cleansing of the tubing with an appropriate solution, and quarterly changing of the maintenance tubing, as well as calibration of the total hemoglobin level to ensure the accuracy of the test.
As recommended in the guidelines from a consensus meeting for oxygen saturation measurements,50 the cap for the restrictions of 100% maximum for oxygen saturation and oxyhemoglobin measurements was removed so the test results exceeding 100% could be shown as measured by the equipment.
Sao2 and Svo2 measurements were made in blood samples obtained through 4F Opticath umbilical catheters by using Oximetric 3 monitors of 3-wavelength technology (Abbott Critical Care Systems, North Chicago, Ill). This system has been validated in adults to be almost 100% accurate for up to 5 days for Svo2 measurements,5 with correlations ranging from 0.9 to 0.99,51-53 and it is accurate for hematocrit ranges of 0.15 to 0.40.54 Validity was enhanced by calibration of the system before insertion of the catheter and by the in vivo reference method after insertion of the catheter. Reliability was enhanced during monitoring by a light-intensity display and calibration on the monitor. Interrater agreement for on-site data coding was double-checked between monitor recording and computer recording to ensure that no difference was apparent between the 2 raters.
All monitor readings (ie, pulse oximeter readings, respiratory rate and heart rate readings, and incubator temperature and skin temperature readings) were recorded during the first second that the blood sample was being obtained. Spo2 readings were recorded by using a pulse oximeter (Nellcor NPB 290, Pleasanton, Calif). This instrument was capable of measuring Spo2 detected transcutaneously by a probe positioned around the neonate’s foot on either side of a pulsating arterial bed. The transmittance sensor was configured so that the light-emitting diodes transmitted infrared and red light through the pulsating vascular bed to a photodetector positioned on the opposite site.47,48 Measurements of Spo2 are highly correlated (r = 0.98 to 0.99) with Sao2 without adjustment for percentage of fetal hemoglobin in neonates,55-57 but the correlation decreases dramatically (r = 0.5, 0.88) with adjustment for fetal hemoglobin.25,58 Interrater agreement on data coding was double-checked to reach 100% to ensure that no difference was present between the 2 raters.
Procedures
Blood samples were obtained through the umbilical arterial or venous catheter from the first to the fifth day of life. The sampling was done every 6 to 8 hours while the neonates were sleeping quietly and at the same time as blood samples were being collected for routine blood gas analysis. It was hoped that obtaining samples in this manner would yield stable measurements. The monitor readings were recorded within the first second of obtaining the blood sample. All clinical monitor readings of vital functions were observed and recorded to ensure that the measurements remained in relatively normal ranges during the sampling. To conserve blood volume in these critically ill neonates, less than 4 mL of blood per kilogram body weight was withdrawn for study purposes during the entire duration of the study. Medical records were prospectively reviewed to obtain subjects’ demographic data, medical history, results of routine laboratory tests, and monitoring parameters.
As part of the study protocol, blood samples were divided into 2 syringes, one for the fetal hemoglobin test (the sample in the first syringe had to be fully oxygenated before testing) and the second for the oxygen saturation tests. Determination of fetal hemoglobin level included oxygenating blood samples with 100% oxygen and rolling the syringe containing the sample between the hands for 90 seconds to yield fully oxygenated samples. First the oxygenation status was confirmed by oxygen saturation readings, then the fetal hemoglobin was measured by using the hemoximeter. The fetal hemoglobin value was then used to determine oxygen saturation and levels of oxyhemoglobin, carbon monoxide hemoglobin, methemoglobin, and reduced hemoglobin (deoxyhemoglobin) in blood samples when routine blood gas analyses were performed.
Data Analysis
Data were analyzed by using the Statistical Packages for Social Sciences (SPSS Version 13.0, Chicago, Ill). The original technique of Bland and Altman59,60 provided useful information including bias, precision, and limits of agreement. The bias was defined as the mean difference, and the precision was defined as the SE of the mean difference. The limits of agreement as defined by Bland and Altman are a proportional function of distribution for differences between the 2 measurements. The differences between the measurements in oxygen saturation and oxyhemoglobin level, between Spo2 and oxygen saturation, and between Spo2 and oxyhemoglobin level were calculated and examined by using paired-sample t tests.
A multivariate linear mixed model61,62 was used to examine the differences between the oxygen saturation measurements, for mixed effects including fetal hemoglobin effects (fixed effects), and for repeated measurements of multiple data points from the same subjects (random effects). A maximum likelihood method and an autoregressive model (for repeated-measures data from the same subjects) were used for model estimation.61,62
Oxygen saturation measurements along the oxyhemoglobin dissociation curves were examined for purposes of clinical assessment. Oxyhemoglobin dissociations were examined by using multiple regression curve-fitting analysis on a sigmoid curve for Po2 values and all oxygen saturation measurements (oxyhemoglobin, oxygen saturation, and Spo2). These curves are particularly helpful when examining the relative values of the measurements (oxygen saturation, oxy-hemoglobin, and Spo2) against clinical diagnostic Po2 values for the detection of hypoxemia (< 50 mm Hg) and hyperoxemia (>75 mm Hg).46,47
Results
Table 1 presents the demographic statistics of the 78 subjects including age, birth weight, sex, race/ethnicity, and primary diagnosis. Mean heart rate was 143/min (SD 15/min) and mean respiratory rate was 42/min (SD 20/min). The mean incubator temperature was 36.4°C (SD 0.68°C) and the mean skin temperature was 36.4°C (SD 0.58°C).
Table 1.
Demographic characteristics (N = 78)
| Demographic variables | No. (%) of subjects | Mean | SD | Range |
|---|---|---|---|---|
| Gestational age, weeks | 78 (100) | 31 | 3.2 | 25-38 |
| Birth weight, g | 78 (100) | 1542 | 579 | 665-3800 |
| 1-minute Apgar score | 78 (100) | 6.1 | 2.13 | 1-9 |
| 5-minute Apgar score | 78 (100) | 7.9 | 1.22 | 5-9 |
| Race/ethnicity | ||||
| White | 28 (36) | |||
| Black | 21 (27) | |||
| Hispanic | 26 (33) | |||
| Asian | 3 (4) | |||
| Male | 36 (46) | |||
| Resuscitation at birth | 43 (55) | |||
| Heart defects* | 15 (19) | |||
| Respiratory distress | 78 (100) |
Congenital heart defects caused signs and symptoms with central shunting.
Bias of Blood Oxygen Saturation Against Oxyhemoglobin and Related Measurements
Table 2 presents the validation of oxygen saturation measurements obtained from blood samples against oxyhemoglobin. The bias for oxygen saturation against oxyhemoglobin for arterial samples, venous samples, and total arterial and venous samples was consistently 3% (all P < .001). The correlations between oxygen saturation and oxyhemoglobin level were close to 1.0 for all samples (all P <.001). The precisions (SE) ranged from 0.04 to 0.10 with venous samples yielding less precision. For the limits of agreement with ±2 SD, the disagreements between oxygen saturation and oxyhemoglobin were 3.8% for arterial samples, 9% for venous samples, and 4.6% for the total samples.
Table 2.
Summary statistics for oxygen saturation against oxyhemoglobin for arterial, venous, and total blood samples
| Parameter | Arterial (n = 660) | Venous (n = 111) | Total (N = 771) |
|---|---|---|---|
| Correlation | 0.95* | 0.99* | 0.98* |
| Mean difference (SD) | 2.90 (0.99)* | 2.64 (1.10)* | 2.86 (1.0)* |
| SE | 0.04 | 0.10 | 0.04 |
P < .001.
Effects of fetal hemoglobin on the differences between the oxygen saturation and oxyhemoglobin measurements were examined by using the multivariate, linear mixed model approach62 (Table 3) and controlling for the effect of blood transfusion, which alters fetal hemoglobin levels. Each 1% increase in fetal hemoglobin was associated with a 0.027% decrease (P=.04) in the mean difference between oxygen saturation and oxyhemoglobin (with an intercept of 5.26, P < .001), with blood transfusion factor contributing to a 0.45% increase in the mean difference (P < .001). This result indicated that the greater the percentage of fetal hemoglobin, the smaller the difference between the blood oxygen saturation and blood oxyhemoglobin measurements.
Table 3.
The multivariate, linear mixed model regression analyses for differences between oxyhemoglobin and oxygen saturation measurements*
| Parameter | Estimates | SE | t | P |
|---|---|---|---|---|
| Intercept | 5.26 | 0.5645 | 9.32 | <.001 |
| Transfusion (yes vs no) | 0.448 | 0.0593 | 7.54 | <.001 |
| Fetal hemoglobin, % | -0.027 | 0.0012 | -21.97 | .04 |
Mean differences, 2.67%; N = 771.
Of the 771 blood samples, 188 samples were obtained after the neonates had received blood transfusions (Table 4). Blood transfusions occurred with neonates who were slightly younger (mean gestational age 29.9 [SD 3.4] weeks vs 30.4 [SD 2.8] weeks; P = .04) and who had more blood samples withdrawn (total number of samplings 13 [SD 8.4] vs 6 [SD 5.1]; P < .001). Blood transfusions decreased both arterial and venous levels of fetal hemoglobin (P < .001), changed both arterial and venous levels of methemoglobin (P < .001), and decreased arterial oxyhemoglobin levels (P = .01). In addition, for the venous samples, pH levels decreased, reflecting increased acidity following transfusion (P = .04), and bicarbonate and base excess levels decreased (P<.001). For the arterial samples, pH decreased (P < .001) and Pco2 increased (P=.004) following the transfusions.
Table 4.
Descriptive statistics and differences following blood transfusions for arterial and venous blood samples*
| Venous sample | Arterial sample | |||
|---|---|---|---|---|
| Measurement | No transfusion (n = 96) | Transfusion (n = 15) | No transfusion (n = 487) | Transfusion (n = 173) |
| Fetal hemoglobin, % | 100 (26.4) | 64 (17.0)† | 105 (26.1) | 77 (18.3)† |
| Carbon monoxide hemoglobin, % | 1.8 (1.12) | 1.8 (0.56) | 1.7 (0.87) | 2.3 (0.58) |
| Methemoglobin, % | 0.87 (0.23) | 0.67 (0.12)† | 0.99 (0.32) | 1.13 (0.26)† |
| Oxyhemoglobin, % | 88.2 (7.25) | 86.7 (5.86) | 94.4 (3.20) | 93.8 (2.36)‡ |
| Oxygen saturation, % | ||||
| Of blood samples | 90.9 (7.65) | 89.1 (5.86) | 97.1 (3.25) | 97.3 (2.43) |
| On monitor | 92.0 (6.12)§ | 89.1 (8.11)∥ | 96.7 (3.29)¶ | 96.9 (2.24)# |
| By pulse oximetry | 96.6 (3.25) | 95.6 (2.64) | 96.9 (3.18) | 96.5 (2.74) |
| pH | 7.34 (0.07) | 7.31 (0.04)‡ | 7.36 (0.07) | 7.33 (0.07)† |
| Po2, mm Hg | 55.0 (22.2) | 49.4 (8.54) | 83.1 (43.8) | 80.5 (29.3) |
| Pco2, mm Hg | 41.5 (51.6) | 36.7 (3.64) | 39.7 (9.0) | 42.0 (9.2)** |
| Bicarbonate, mmol/L | 21.8 (2.97) | 18.0 (1.56)† | 21.4 (2.43) | 21.5 (2.30) |
| Base excess | -3.5 (3.07) | -6.9 (2.17)† | -3.4 (2.53) | -3.6 (2.61) |
| Heart rate, beats per minute | 140 (11.8) | 145 (17.0) | 143 (15.1) | 144 (13.6) |
All values are means followed by SD in parentheses.
P < .001.
P < .05.
Fifty-two of 96 monitor validation data points recalibrated.
Eight of 15 monitor data points recalibrated.
One hundred twenty-four of 487 monitor data points recalibrated.
Twenty-seven of 173 monitor data points recalibrated.
P < .01.
Biases of Oxygen Saturation Monitoring Against Blood Oxyhemoglobin and Related Measurements
For oxygen saturation measurements displayed on the clinical monitor, 170 data points (22.0%) had to be recalibrated against the blood oxygen saturation measurements (ie, differences between the monitor and the blood measurements were >4%).5 For Sao2 monitor measurements 125 (18.9% of 660) data points had to be recalibrated, and for Svo2 monitor measurements 45 (40.5% of 111, greatest proportion of data points) had to be recalibrated. These recalibrations occurred more often with newer research staff (33% with the newer staff vs 19.5% with seasoned staff; P < .001). Newer staff members were less experienced at handling neonates in such a way as to minimize stimulation and used less accurate oxygenation techniques for the fetal hemoglobin measurements.
After the data points from the time when recalibrations were performed were excluded, the bias for the monitor Sao2 against the arterial oxyhemoglobin was 2.3%; for the monitor Sao2 against the blood Sao2 it was -0.5% (P < .001). The bias for the monitor Svo2 against the venous oxyhemoglobin was 3.1% (P <.001) and for the monitor Svo2 against the blood Svo2 it was 0.5% (P = .10; Table 5). The correlation for the monitor Svo2 against the venous oxyhemoglobin was 0.76 and the correlation for the monitor Svo2 against the blood Svo2 was 0.8 (both P < .001). The correlation between the monitor Svo2 and the venous oxyhemoglobin was 0.95 and the correlation between the monitor Svo2 and the blood Svo2 was 0.94 (P < .001).
Table 5.
Summary statistics for monitor arterial oxygen saturation (Sao2m) and monitor venous oxygen saturation (Svo2m) against blood oxyhemoglobin, Sao2, and Svo2
| Arterial (n = 535)* | Venous (n = 66)† | |||
|---|---|---|---|---|
| Parameter | Sao2m vs oxyhemoglobin | Sao2m vs Sao2 | Svo2m vs oxyhemoglobin | Svo2m vs Svo2 |
| Correlation | 0.76‡ | 0.80‡ | 0.95‡ | 0.94‡ |
| Mean difference (SD) | 2.33 (2.0)‡ | -0.54 (1.84)‡ | 3.1 (2.09)‡ | 0.52 (2.22) |
| SE | 0.09 | 0.08 | 0.29 | 0.31 |
Abbreviations: Sao2, arterial oxygen saturation; Svo2, venous oxygen saturation.
One hundred twenty-five of 535 arterial monitoring validation data points were recalibrated.
Forty-five of 66 venous monitoring validation data points were recalibrated.
P < .001.
When the precisions (SE) of these paired comparisons were used for venous monitor readings, they yielded less precision. For the limits of agreement with ±2 SD, the disagreements between monitor Sao2 and arterial oxyhemoglobin were 3.8%, between monitor Sao2 and blood Sao2 they were 2.2%, between monitor Svo2 and venous oxyhemoglobin they were 2.9%, and between monitor Svo2 and blood Svo2 they were 0%.
For Spo2 and related measurements (Table 6), the biases for Spo2 against the arterial oxyhemoglobin, blood Sao2, and monitor Sao2 were more variable than the paired comparisons for the previous blood sample analyses. The correlations were lower than those of the blood samples (all P < .001). The precisions of these paired comparisons were also lower (higher SE means less precise) than those for the blood samples; the disagreements between Spo2 and arterial oxyhemoglobin were 2.3%, between Spo2 and blood Sao2 were 5.9%, and between Spo2 and monitor Sao2 were 5.1%.
Table 6.
Summary statistics for Spo2 against blood oxyhemoglobin and Sao2, and monitor Sao2 (Sao2m) (n = 660)
| Parameter | Spo2 vs oxyhemoglobin | Spo2 vs Sao2 | Spo2 vs Sao2m* |
|---|---|---|---|
| Correlation | 0.45† | 0.44† | 0.36† |
| Mean difference (SD) | 2.50 (3.09)† | -0.39 (3.14)‡ | 0.40 (3.08)‡ |
| SE | 0.13 | 0.13 | 0.15 |
Abbreviations: Spo2, oxygen saturation by pulse oximetry; Sao2, arterial oxygen saturation.
One hundred twenty-five of 660 arterial monitoring validation data points were recalibrated.
P < .001.
P < .01.
Oxyhemoglobin Dissociation Curves and Relative Values
Figure 1 presents the significant oxyhemoglobin dissociation sigmoid fitted curves for the arterial blood samples. For ease of visual examination, the ranges of arterial Po2 (Pao2) were focused at 100 mm Hg or less. Significant sigmoid curves were established for arterial oxyhemoglobin, blood Sao2, monitor Sao2, and Spo2, each in relation to the Pao2. on these sigmoid curves, in relation to the Pao2 ranges of 50 to 75 mm Hg, the arterial oxyhemoglobin was from 92% to 95% (R = 0.458, P < .001); blood Sao2, from 95% to 98% (R =0.416, P < .001); monitor Sao2, from 94% to 97% (R=0.312, P<.001); and Spo2, from 95% to 97% (R =0.211, P<.001).
Figure 1.
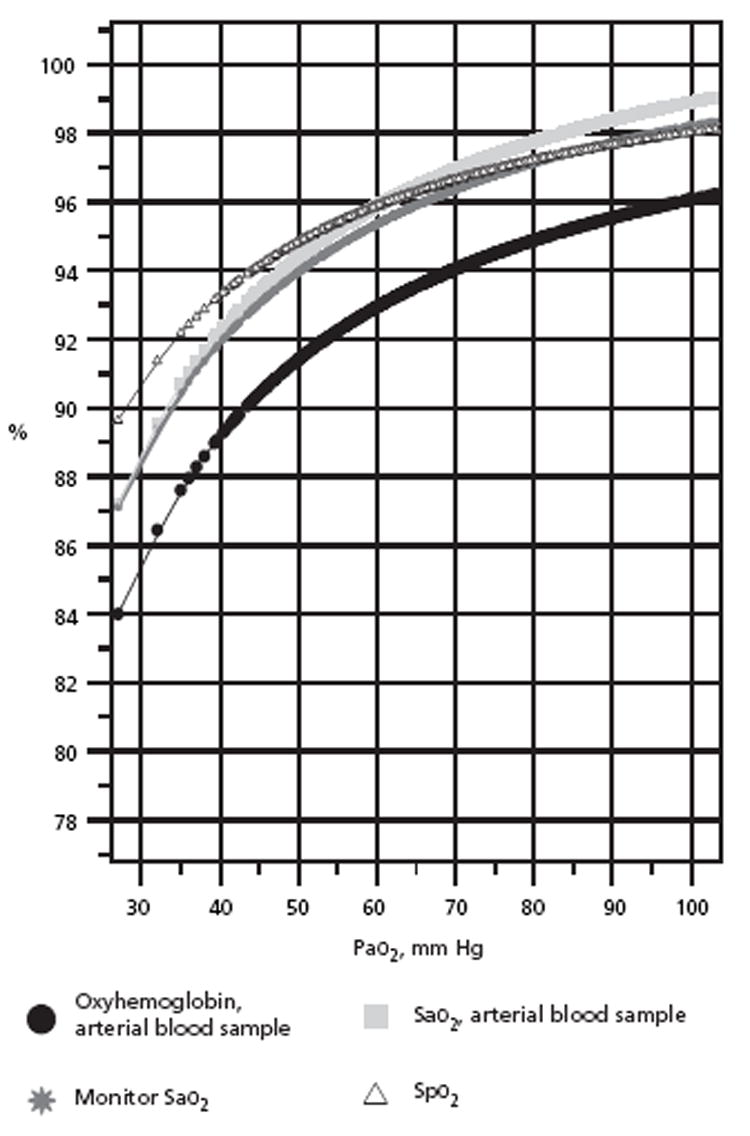
Arterial oxyhemoglobin sigmoid curves with Pao2, for arterial oxyhemoglobin, Sao2, monitor Sao2, and Spo2.
Abbreviations: Sao2, arterial oxygen saturation; Spo2, pulse oximetry oxygen saturation.
Figure 2 presents the significant sigmoid curves for the venous samples. Figure 3 presents the significant sigmoid curves for the total samples. For venous samples, in relation to the venous Po2 (Pvo2) ranges of 50 to 75 mm Hg, the venous oxyhemoglobin was from 88% to 95% (R = 0.604, P < .001); blood Svo2, from 91% to 97% (R = 0.577, P < .001); monitor Svo2, from 92% to 98% (R = 0.581, P < .001); and Spo2, from 96% to 97% (R = 0.003, P = .65). In Figure 3, for the total blood samples, in relation to Po2 ranges of 50 to 75 mm Hg, oxyhemoglobin was from 90.5% to 95% (R = 0.568, P < .001); blood oxygen saturation, from 93% to 97% (R = 0.537, P < .001); monitor oxygen saturation, from 93% to 97% (R=0.442, P <.001); and Spo2, from 96% to 97.5% (R = 0.131, P < .001).
Figure 2.
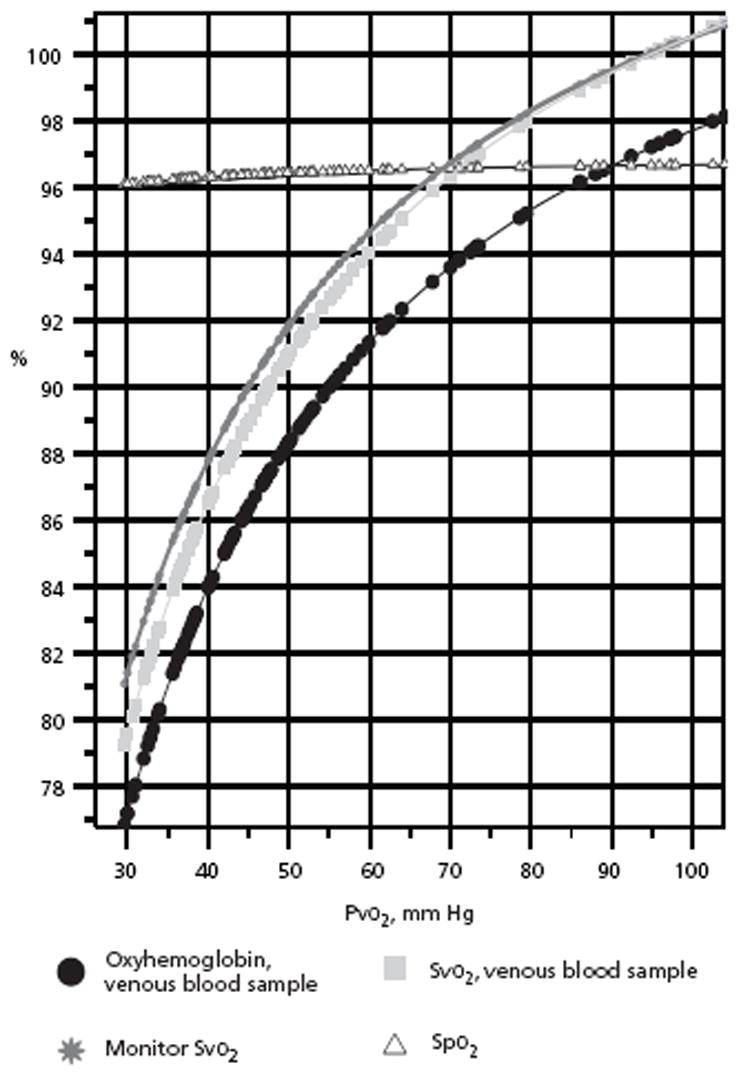
Venous oxyhemoglobin sigmoid curves with Pvo2, for venous oxyhemoglobin, Svo2, monitor Svo2, and Spo2.
Abbreviations: Pvo2, venous oxygen tension; Spo2, pulse oximetry oxygen saturation; Svo2, venous oxygen saturation.
Figure 3.
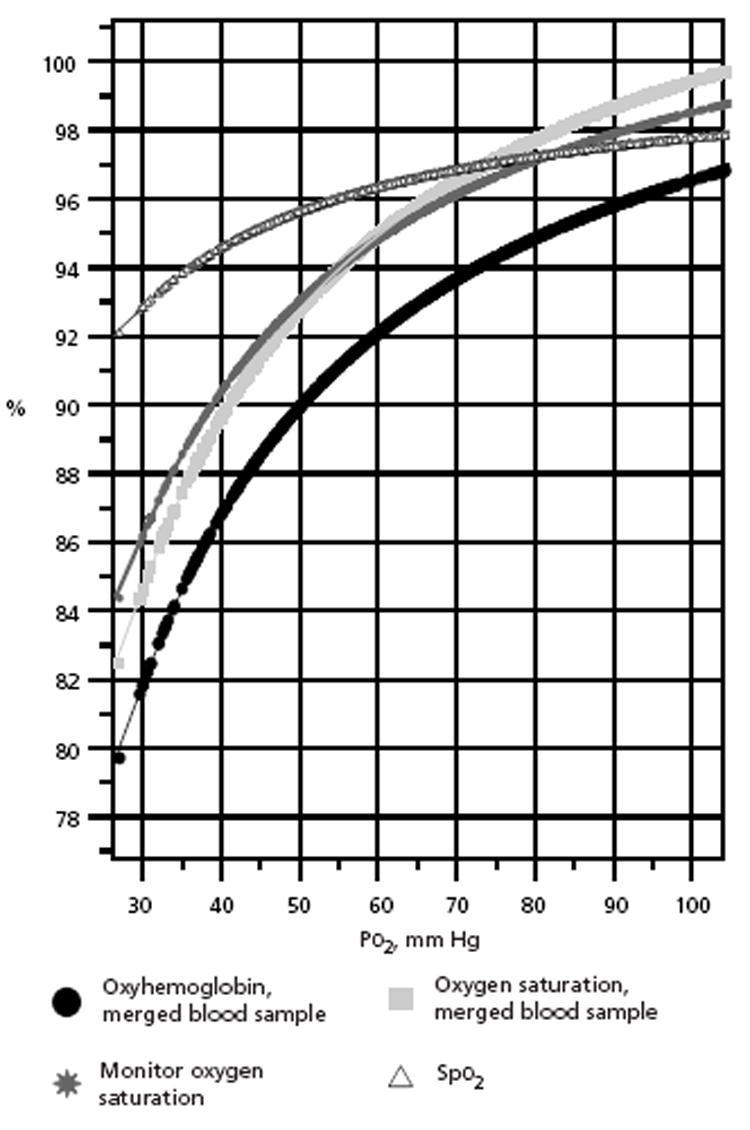
Oxyhemoglobin sigmoid curves for total merged arterial and venous blood samples with Po2, for oxyhemoglobin, oxygen saturation, monitor oxygen saturation, and Spo2.
Abbreviation: Spo2, pulse oximetry oxygen saturation.
Discussion
A larger data set than previously reported was used for these validation tests to establish safety limits for neonates. O’Connor and Hall22 examined arteriovenous oxyhemoglobin measurements in neonates; however, they did not account for the fetal hemoglobin factor. Therefore, until now, no researchers have reported data to validate Sao2 and Svo2 measurements displayed on the clinical monitor in neonates that had been adjusted for fetal hemoglobin levels.
Using an established multivariate linear mixed model,61,62 we determined the effects of fetal hemoglobin on the differences between oxygen saturation and oxyhemoglobin measurements for neonates in this study in an effort to provide safety ranges for clinical oximeter readings. In summary, although monitor readings from central catheters had to be recalibrated more frequently for the neonates, with fetal hemoglobin determination the bias between monitor oxygen saturation and oxyhemoglobin was less than 3%, similar to the ranges reported for adults.38 However, the effects of fetal hemoglobin on the differences between oxygen saturation and oxyhemoglobin measurements changed along the oxyhemoglobin dissociation curves, with greater differences when fetal hemoglobin levels were higher.
In addition, the ranges for the safety limits of oxygen saturation measurements in neonates were narrower and much higher than those reported for adults, as presented on the oxyhemoglobin dissociation curves. on the sigmoid curves, the ranges of oxygen saturation readings in relation to Pao2 were much narrower and higher for the neonates (95%-98%) than the 84% to 95% reported for Spo2 in adults. 46,47 In relation to the Pao2 ranges from 50 to 75 mm Hg, the ranges were 95% to 97% for Spo2, 94% to 97% for monitor Sao2, 95% to 98% for blood Sao2, and 92% to 95% for arterial oxyhemoglobin. These narrower ranges of oxygen saturation measurements in neonates require clinicians to pay close attention to any changes in oxygenation status in neonates because it reflects changing clinical status.
In this study, 22% of the oxygen saturation measurements obtained with the monitor had to be recalibrated when validated against blood measurements. This percentage of measurements requiring recalibration is high compared with almost no measurements needing recalibration for adults.5 The validation tests for neonates are more complicated than those for adults, because measurements of oxygen saturation are not accurate unless fetal hemoglobin is determined by staff and because of safety concerns for blood volumes in these vulnerable neonates.
The SO2 safety limits for neonates are much narrower and higher than for adults.
The overall precision limits for all blood samples yielded results better than the 0.1% limit recommended by the manufacturer’s standards, indicating successful training of staff personnel. The precision (SE) of measurements of oxygen saturation displayed on the clinical monitor was 0.08 when compared with blood Sao2 and 0.09 when compared with oxyhemoglobin, at least 2 times less precise than the blood analyses (SE 0.04). Furthermore, the Svo2 measurements displayed on the clinical monitor were about 3 times less precise (0.29 compared with oxyhemoglobin and 0.31 compared with blood Svo2 vs 0.1 for blood samples). Values for Spo2 also were at least 3 times less precise (SE 0.13) than the blood analyses (SE 0.04). Therefore, these findings confirmed that clinical monitors were less precise than bench-top blood analyses for neonates.
The ranges of arterial oxygen saturation and oxyhemoglobin measurements remained in a horizontal area above 92% (Figure 1), whereas the ranges of venous oxygen saturation and oxyhemoglobin (Figures 2 and 3) spread over an interval at least 3 times as great. The greater intervals for Svo2 measurements contributed to greater sensitivity of the measurements (compared with Sao2 measurements) in response to nursing care and to changes in oxygen demand among adults.5-7
Measuring Svo2 during nursing care is a relatively new concept for neonatal care. Nevertheless, these findings indicate the potential importance of measuring Svo2 and other indicators of oxygen consumption in neonates to improve assessment of oxygenation status. In future studies of neonates, researchers might compare values of oxygen saturation obtained via a monitor with more frequent blood sampling (every 4 to 6 hours), particularly for Svo2 monitoring, to enhance accurate monitoring for larger neonates when safety of blood volume is of less concern.
Fetal hemoglobin levels changed with blood transfusions. Without blood transfusions, the mean fetal hemoglobin reading was greater than 100% (the cap for the maximum readings of 100% had been lifted according to the suggestions from the consensus meeting).50 These fetal hemoglobin levels exceeding 100% presented inaccurate measurements of fetal hemoglobin using the OSM3 hemoximeter. Future studies can use instruments such as high-performance liquid chromatography, globin chain analysis, flow cytometry, and genotyping analyses to measure fetal hemoglobin levels and any new variations in hemoglobin levels more accurately.63,64
Blood transfusion was associated with slightly increased acidity in arterial and venous blood and decreased oxyhemoglobin measurements; blood transfusion therefore could increase cardiac load in neonates.34 Increased acidity and transfusion of adult hemoglobin would prompt a shift in the oxyhemoglobin curve to the right, releasing more oxygen to the tissue.2 The altered oxygen release could be associated with oxygen poisoning,33,35 thus oxygenation status should be monitored closely after blood transfusions.
To prevent desaturation events in neonates, pulse oximetry values should be maintained at greater than 95%.
Conclusion
The safety ranges of oxygen saturation measurements are narrower for neonates than for adults, and using such measurements demands more focused attention by the nurses who provide clinical care. Along the oxyhemoglobin dissociation curve in relation to 50 mm Hg of Pao2 measurement, the critical ranges of 94% to 95% values were identified for Sao2 and Spo2 measurements in neonates. In summary, it is preferable to maintain Spo2 at greater than 95% in neonates to prevent desaturation events.25,65
In the event that a neonate’s condition deteriorates, clinical oximeters cannot detect carbon monoxide hemoglobin, methemoglobin, fetal hemoglobin, or other variations in hemoglobin, and blood tests are needed for accurate assessment of the neonate’s oxygenation status.1,38,50 Future research is needed to solidify these validation tests in neonates. Moreover, additional variants of fetal hemoglobin should be examined for their effects on these validation tests with measurements related to oxyhemoglobin dissociation curves and P50.
Acknowledgments
The authors thank the nurses, physicians, and respiratory therapists who participated in this study and who helped with the collection of blood samples.
Footnotes
FINANCIAL DISCLOSURES
This study was supported in part by 3 different awards: KCI-AACN Critical Care Research Award from the American Association of Critical-Care Nurses, a research award from the National Association of Neonatal Nurses, and a grant from the National Institutes of Health, R01-NR04447.
To purchase reprints, contact The InnoVision Group, 101 Columbia, Aliso Viejo, CA 92656. Phone, (800) 809-2273 or (949) 362-2050 (ext 532); fax, (949) 362-2049; e-mail, reprints@aacn.org.
References
- 1.Shiao SYPK. Functional versus fractional oxygen saturation readings: bias and agreement using simulated solutions and adult blood. Biol Res Nurs. 2002;3:210–221. doi: 10.1177/10900402003004006. [DOI] [PubMed] [Google Scholar]
- 2.Bunn HF, Forget BG. Hemoglobin: Molecular, Genetic and Clinical Aspects. Philagdelphia, Pa: WB Saunders Co; 1986. Hemoglobin A2, F, and other human hemoglobin components; pp. 61–90. [Google Scholar]
- 3.Wimberly PD. Oxygen monitoring in the newborn. Scand J Clin Lab Invest Suppl. 1993;214:127–130. [PubMed] [Google Scholar]
- 4.Wimberly PD, Siggaard-Anderson O, Fogh-Anderson N. Accurate measurement of hemoglobin oxygen saturation, and fraction of carboxyhemoglobin and methemoglobin in fetal blood using Radiometer OSM3: corrections for fetal hemoglobin fraction and pH. Scand J Clin Lab Invest Suppl. 1990;203:235–239. doi: 10.3109/00365519009087516. [DOI] [PubMed] [Google Scholar]
- 5.Chulay M, Palmer J, Neblett J, Nancherla AR, Tripodi D, Caden D. Clinical comparison of two- and three-wavelength systems for continuous measurement of venous oxygen saturation. Am J Crit Care. 1992;1:69–75. [PubMed] [Google Scholar]
- 6.Nakanishi N, Yoshioka T, Okano Y, Nishimura T. Continuous Fick cardiac output measurement during exercise by monitoring of mixed venous oxygen saturation and oxygen uptake. Chest. 1993;104:419–426. doi: 10.1378/chest.104.2.419. [DOI] [PubMed] [Google Scholar]
- 7.White KM. Completing the hemodynamic picture: Svo2. Heart Lung. 1985;14:272–280. [PubMed] [Google Scholar]
- 8.Siggaard-Andersen O, Gothgen IH. Oxygen and acid-base parameters of arterial and mixed venous blood, relevant versus redundant. Acta Anaesthesiol Scand Suppl. 1995;107:21–27. doi: 10.1111/j.1399-6576.1995.tb04325.x. [DOI] [PubMed] [Google Scholar]
- 9.Whyte RK. Mixed venous oxygen saturation in the newborn: can we and should we measure it? Scand J Clin Lab Invest Suppl. 1990;203:203–211. doi: 10.3109/00365519009087511. [DOI] [PubMed] [Google Scholar]
- 10.Hirschl RB, Palmer P, Heiss KF, Hultquist K, Fazzalari F, Barlett RH. Evaluation of right arterial venous oxygen saturation as a physiologic monitor in a neonatal model. J Pediatr Surg. 1993;28:901–905. doi: 10.1016/0022-3468(93)90692-e. [DOI] [PubMed] [Google Scholar]
- 11.Harris AP, Sendak MJ, Donham RT, Thomas M, Duncan D. Absorption characteristics of human fetal hemoglobin at wavelengths used in pulse oximetry. J Clin Monitor. 1988;4:175–177. doi: 10.1007/BF01621812. [DOI] [PubMed] [Google Scholar]
- 12.Moyle JT. Uses and abuses of pulse oximetry. Arch Dis Child. 1996;74:77–80. doi: 10.1136/adc.74.1.77. [DOI] [PMC free article] [PubMed] [Google Scholar]
- 13.Barker SJ, Tremper KK, Hyatt J. Effects of methemoglobinemia on pulse oximetry and mixed venous oximetry. Anesthesiology. 1989;70:112–117. doi: 10.1097/00000542-198901000-00021. [DOI] [PubMed] [Google Scholar]
- 14.Blaisdell CJ, Goodman S, Clark K, Casella JF, Loughlin GM. Pulse oximetry is a poor predictor of hypoxemia in stable children with sickle cell disease. Arch Pediatr Adolesc Med. 2000;154:900–903. doi: 10.1001/archpedi.154.9.900. [DOI] [PubMed] [Google Scholar]
- 15.Comber JT, Lopez BL. Evaluation of pulse oximetry in sickle cell anemia patients presenting to the emergency department in acute vasoocclusive crisis. Am J Emerg Med. 1996;14:16–18. doi: 10.1016/S0735-6757(96)90005-4. [DOI] [PubMed] [Google Scholar]
- 16.Carter BG, Carlin JB, Tibballs J, Mead H, Hochmann M, Osborne A. Accuracy of two pulse oximeters at low arterial hemoglobin-oxygen saturation. Crit Care Med. 1998;26:1128–1133. doi: 10.1097/00003246-199806000-00040. [DOI] [PubMed] [Google Scholar]
- 17.Hampson NB. Pulse oximetry in severe carbon monoxide poisoning. Chest. 1998;114:1036–1041. doi: 10.1378/chest.114.4.1036. [DOI] [PubMed] [Google Scholar]
- 18.Haney M, Tait AR, Tremper KK. Effect of carboxyhemoglobin on the accuracy of mixed venous oximetry monitors in dogs. Crit Care Med. 1994;22:1181–1185. doi: 10.1097/00003246-199407000-00022. [DOI] [PubMed] [Google Scholar]
- 19.Krzeminski A. How Is Fetal Hemoglobin Determined and Corrected for in the OSM3, the ABL510, and the ABL 520? Copenhagen, Denmark: Radiometer; May, 1992. pp. 1–4. Info No. 1992-4. [Google Scholar]
- 20.Pianosi P, Charge TD, Esseltine DW, Coates AL. Pulse oximetry in sickle cell disease. Arch Dis Child. 1993;68:735–738. doi: 10.1136/adc.68.6.735. [DOI] [PMC free article] [PubMed] [Google Scholar]
- 21.Rausch-Madison S, Mohsenifar Z. Methodologic problems encountered with cooximetry in methemoglobinemia. Am J Med Sci. 1997;314:203–206. doi: 10.1097/00000441-199709000-00010. [DOI] [PubMed] [Google Scholar]
- 22.O’Connor TA, Hall RT. Mixed venous oxygenation in critically ill neonates. Crit Care Med. 1994;22:343–346. doi: 10.1097/00003246-199402000-00028. [DOI] [PubMed] [Google Scholar]
- 23.Rajadurai VS, Walker AM, Yu VY, Oates A. Effect of fetal haemoglobin on the accuracy of pulse oximetry in preterm infants. J Paediatr Child Health. 1992;28:43–46. doi: 10.1111/j.1440-1754.1992.tb02615.x. [DOI] [PubMed] [Google Scholar]
- 24.Whyte RK, Jangaard KA, Dooley KC. From oxygen content to pulse oximetry: completing the picture in the newborn. Acta Anaesth Scand Suppl. 1995;107:95–100. doi: 10.1111/j.1399-6576.1995.tb04341.x. [DOI] [PubMed] [Google Scholar]
- 25.Shiao S-YPK. Desaturation events in neonates during mechanical ventilation. Crit Care Nurs Q February. 2002;24:14–29. doi: 10.1097/00002727-200202000-00004. [DOI] [PubMed] [Google Scholar]
- 26.Rochette J, Craig JE, Thein SL. Fetal hemoglobin levels in adults. Blood Rev. 1994;8:213–224. doi: 10.1016/0268-960x(94)90109-0. [DOI] [PubMed] [Google Scholar]
- 27.Vadolas J, Wardan H, Orford M, Williamson R, Ioannou PA. Cellular genomic reporter assays for screening and evaluation of inducers of fetal hemoglobin. Hum Mol Genet. 2004;13:223–233. doi: 10.1093/hmg/ddh023. [DOI] [PubMed] [Google Scholar]
- 28.Koskinen LK, Lahtela JT, Koivula TA. Fetal hemoglobin in diabetic patients. Diabetes Care. 1994;17:828–831. doi: 10.2337/diacare.17.8.828. [DOI] [PubMed] [Google Scholar]
- 29.Peters A, Rohloff D, Kohlmann T, et al. Fetal hemoglobin in starvation ketosis of young women. Blood. 1998;91:691–694. [PubMed] [Google Scholar]
- 30.Moore JM, Nahlen B, Ofulla AV, et al. A simple perfusion technique for isolation of maternal intervillous blood monomuclear cells from human placentae. J Immunol Methods. 1997;209:93–104. doi: 10.1016/s0022-1759(97)00162-2. [DOI] [PubMed] [Google Scholar]
- 31.Samura O, Peril B, Sohda S, et al. Female fetal cells in maternal blood: use of DNA polymorphism to prove origin. Hum Genet. 2000;107:28–32. doi: 10.1007/s004390000327. [DOI] [PubMed] [Google Scholar]
- 32.Imai K, Tientadakul P, Opartkiattikul N, et al. Detection of haemoglobin variants and inference of their functional properties using complete oxygen dissociation curve measurements. Br J Haematol. 2001;112:483–487. doi: 10.1046/j.1365-2141.2001.02598.x. [DOI] [PubMed] [Google Scholar]
- 33.James L, Greenough A, Naik S. The effect of blood transfusion on oxygenation in premature ventilated neonates. Eur J Pediatr. 1997;156:139–1141. doi: 10.1007/s004310050572. [DOI] [PubMed] [Google Scholar]
- 34.Nemeto S, Aoki M, Dehua C, Imai Y. Free hemoglobin impairs cardiac function in neonatal rabbit heart. Ann Thorac Surg. 2000;69:1484–1489. doi: 10.1016/s0003-4975(00)01176-0. [DOI] [PubMed] [Google Scholar]
- 35.DeHalleux V, Truttmann A, Gagnon C, Bard H. The effect of blood trans-fusion on the hemoglobin oxygen dissociation curve of very early preterm infants during the first week of life. Semin Perinatol. 2002;26:411–415. doi: 10.1053/sper.2002.37313. [DOI] [PubMed] [Google Scholar]
- 36.Poets CF. Assessing oxygenation in healthy infants. J Pediatr. 1999;135:541–543. doi: 10.1016/s0022-3476(99)70049-1. [DOI] [PubMed] [Google Scholar]
- 37.Poets CF, Southall DP. Noninvasive monitoring of oxygenation in infants and children: practical considerations and areas of concern. Pediatrics. 1994;93:737–746. [PubMed] [Google Scholar]
- 38.Smatlak P, Knebel AR. Clinical evaluation of noninvasive monitoring of oxygen saturation in critically ill patients. Am J Crit Care. 1998;7:370–373. [PubMed] [Google Scholar]
- 39.Bucher H-U, Fanconi S, Beeckert P, Duc G. Hyperoxemia in newborn infants: detection by pulse oximetry. Pediatrics. 1989;84:226–230. [PubMed] [Google Scholar]
- 40.Poets CF, Wilken M, Seidenberg J, Southall DP, van der Hardt H. Reliability of a pulse oximeter in the detection of hyperoxemia. J Pediatr. 1993;122:87–90. doi: 10.1016/s0022-3476(05)83494-8. [DOI] [PubMed] [Google Scholar]
- 41.Severinghaus JW, Naifeh KH, Koh SO. Errors in 14 pulse oximeters during profound hypoxia. J Clin Monitor. 1989;5:72–81. doi: 10.1007/BF01617877. [DOI] [PubMed] [Google Scholar]
- 42.Trivedi NS, Ghouri AF, Lai E, Shah NK, Barker SJ. Pulse oximeter performance during desaturation and resaturation: a comparison of seven models. J Clin Anesth. 1997;9:184–188. doi: 10.1016/s0952-8180(97)00037-8. [DOI] [PubMed] [Google Scholar]
- 43.Trivedi NS, Ghouri AF, Shah NK, Lai E, Barker SJ. Effects of motion, ambient light, and hypoperfusion on pulse oximeter function. J Clin Anesth. 1997;9:179–183. doi: 10.1016/s0952-8180(97)00039-1. [DOI] [PubMed] [Google Scholar]
- 44.Hohl RJ, Sherburne AR, Feeley JE, Huisman TH, Burns CP. Low pulse oximeter-measured hemoglobin oxygen saturation with hemoglobin Cheverly. Am J Hematol. 1998;59:181–184. doi: 10.1002/(sici)1096-8652(199811)59:3<181::aid-ajh1>3.0.co;2-i. [DOI] [PubMed] [Google Scholar]
- 45.Askin DF. Interpretation of neonatal blood gases, part II: disorders of acidbase balance. Neonatal Netw June. 1997;16:23–29. [PubMed] [Google Scholar]
- 46.Grossbach I. Case studies in pulse oximetry monitoring. Crit Care Nurse August. 1993;13:63–65. [PubMed] [Google Scholar]
- 47.Yelderman M, New W. Evaluation of pulse oximetry. Anesthesiology. 1985;59:349–352. doi: 10.1097/00000542-198310000-00015. [DOI] [PubMed] [Google Scholar]
- 48.Shiao SYPK. Accurate measurements of oxygen saturation in neonates: paired arterial and venous blood analyses. Newborn Infant Nurs Rev. 2005;5(4):170–178. [Google Scholar]
- 49.Barrington KJ. Umbilical artery catheters in the newborn: effects of position of the catheter tip. Cochrane Database Syst Rev. 2000;2:CD000505. doi: 10.1002/14651858.CD000505. [DOI] [PMC free article] [PubMed] [Google Scholar]
- 50.Ehrmeyer S, Burnett RW, Chatburn RL, et al. Fractional Oxyhemoglobin, Oxygen Content and Saturation, and Related Quantities in Blood: Terminology, Measurement, and Reporting Approved Guidelines. Villanova, Pa: National Committee for Clinical Laboratory Standards; Jan, 1997. NCCLS Document C25-A17(3) [Google Scholar]
- 51.Gettinger A, Brochu C, Mroz I, Wager P. Clinical accuracy of a new modular mixed-venous saturation oximeter [abstract] Anesthesiology. 1990;73:A238. [Google Scholar]
- 52.Leighton T, Liu SY, Lee TS, Klein S, Bongard F. Simultaneous in-vivo comparison of 2- versus 3-wavelength mixed venous oximetry catheters [abstract] Anesthesiology. 1991;75:A408. doi: 10.1007/BF01616992. [DOI] [PubMed] [Google Scholar]
- 53.Mault JR, Santoro-Nease A, Leonard R, Ungerleider RM. Continuous fiberoptic venous oximetry during neonatal ECMO: analysis of accuracy and longevity [abstract] Crit Care Med. 1992;20:S11. [Google Scholar]
- 54.Lee S, Tremper KK, Barker SJ. Effects of anemia on pulse oximetry and continuous mixed venous hemoglobin saturation monitoring in dogs. Anesthesiology. 1991;75:118–122. doi: 10.1097/00000542-199107000-00019. [DOI] [PubMed] [Google Scholar]
- 55.Decker MJ, Dickensheets D, Arnold JL, Cheung PW, Strohl KP. A comparison of a new reflectance oximeter with the Hewlett-Packard ear oximeter. Biomed Instrum Technol. 1990;24:122–126. [PubMed] [Google Scholar]
- 56.Barrington KJ, Finer NN, Ryan CA. Evaluation of pulse oximetry as a continuous monitoring technique in the neonatal intensive care unit. Crit Care Med. 1988;16:1147–1153. doi: 10.1097/00003246-198811000-00013. [DOI] [PubMed] [Google Scholar]
- 57.Hay WW, Jr, Brockway JM, Eyzaguirre M. Neonatal pulse oximetry: accuracy and reliability. Pediatrics. 1989;83:717–722. [PubMed] [Google Scholar]
- 58.Rajadural VS, Walker AM, Yu VY, Oates A. Effect of fetal hemoglobin on the accuracy of pulse oximetry in preterm infants. J Paediatr Child Health. 1992;28:43–46. doi: 10.1111/j.1440-1754.1992.tb02615.x. [DOI] [PubMed] [Google Scholar]
- 59.Bland JM, Altman DG. Statistical methods for assessing agreement between two methods of clinical measurement. Lancet. 1986;1:307–310. [PubMed] [Google Scholar]
- 60.Bland JM, Altman DG. Measuring agreement in method comparison studies. Stat Methods Med Res. 1999;8:161–179. doi: 10.1177/096228029900800204. [DOI] [PubMed] [Google Scholar]
- 61.Lai D, Shiao S-YPK. Comparing two clinical measurements: a linear mixed model approach. J Appl Stat. 2005;32:857–862. [Google Scholar]
- 62.McCulloch CE, Searle SR. Generalized, Linear, and Mixed Models. New York, NY: John Wiley and Sons; 2001. Generalized linear mixed models; pp. 220–246. [Google Scholar]
- 63.Ou CN, Rognerud CL. Diagnosis of hemoglobinopathies: electrophoresis vs HPLC. Clin Chim Acta. 2001;313:187–194. doi: 10.1016/s0009-8981(01)00672-6. [DOI] [PubMed] [Google Scholar]
- 64.Roberts WL, Frank EL, Moulton L, Papadea C, Noffsinger JK, Ou CN. Effects of nine hemoglobins variants on five glycohemoglobin methods. Clin Chem. 2000;46:560–576. [PubMed] [Google Scholar]
- 65.Shiao SYPK, Brooker J, DiFiore T. Desaturation events during oral feedings with and without an NG tube in VLBW infants. Heart Lung. 1996;25:236–245. doi: 10.1016/s0147-9563(96)80034-3. [DOI] [PubMed] [Google Scholar]