

Abstract
Human N-acetyltransferase 2 (NAT2) genetic polymorphism is associated with drug toxicity and/or carcinogenesis in various tissues. Knowledge of NAT2 gene structure and expression are critical for understanding these associations. Previous findings suggest that human NAT2 expression is highest in liver and gut, but expressed at functional levels in other tissues. A sensitive and specific TaqMan reverse transcriptase polymerase chain reaction (RT-PCR) assay with intron-spanning primers was developed and used, together with a second TaqMan RT-PCR assay based on amplification of a NAT2 open reading frame (ORF) exon segment, to measure NAT2 mRNA in 29 different human tissues. Cap-dependent amplification of mRNA 5′ termini and review of public database information was done to more precisely define the NAT2 promoter(s) and to validate the quantitative RT-PCR assay design. The great majority (40/41) of NAT2 liver cDNAs had 5′ termini between 8682 and 8752 nucleotides upstream of the NAT2 ORF exon, and 34/40 5′-termini were at the -8711 and -8716 adenines. All of 59 NAT2 cDNAs with 5′ termini in this vicinity, including 40 of the liver isolates and 19 cDNAs in public databases from liver and other sources, showed direct splicing to the ORF exon, with no other non-coding exon detected. NAT2 mRNA was highest in liver, small intestine and colon and readily detected in most other tissues albeit at much lower levels. NAT2 expression in diverse human tissues provides further mechanistic support underlying associations between NAT2 genetic polymorphism, drug toxicity and/or chemical carcinogenesis.
INTRODUCTION
Genetic polymorphism of the N-acetyltransferase 2 gene (NAT2) is strongly implicated in differential susceptibility to adverse drug reactions (Weber and Hein, 1985; Butcher et al., 2002) and to various diseases (Boukouvala and Fakis, 2005) especially cancers of the urinary bladder (Garcia-Closas et al., 2005; Carreon et al., 2006; Hein, 2006) and colon (Lilla et al., 2006; Moslehi et al., 2006) upon exposure to carbo- and heterocyclic-aromatic amine carcinogens. A large number of studies have also examined the possible involvement of NAT2 in the etiology of cancers of various other organs (reviewed in Hein et al., 2000a,b). A critical question is whether vulnerability to neoplastic transformation is related to specific expression of NAT2 in the target organ (Williams, 2001) and studies have investigated NAT2 expression in various human (reviewed in Boukouvala and Fakis, 2005) and recently in Syrian hamster (Hein et al., 2006) and mouse (Loehle et al., 2006) tissues. We hypothesized that human NAT2 expression is highest in liver and gut, but is also present in other human tissues. To test this hypothesis, sensitive, specific and well-characterized quantitative mRNA assays were used to quantitate relative expression of NAT2 in 29 different human tissue types.
Accurate quantitative measurements of NAT2 mRNA and protein pose a particular technical challenge because of the presence of the paralogous gene, NAT1, which is ubiquitously expressed in human tissues and shares 87% nucleic acid homology within the protein coding region and 80% amino acid identity to NAT2 (Blum et al., 1990; Ohsako and Deguchi, 1990). The high degree of nucleic acid homology between NAT1 and NAT2 is a potential confounder of general microarray-based analyses of mRNA in normal human tissues. Thus, the reliability of NAT2 and NAT1 expression data in public databases such as GEO Profiles (http://www.ncbi.nlm.nih.gov/) or from genome-wide scans (Shyamsundar et al., 2005) is dependent on factors which may not always be consistent, including the homology of the chosen probe to both NAT1 and NAT2 mRNAs and the experimental hybridization stringency. Although the NAT1 and NAT2 enzymes are distinguishable by differences in substrate selectivity and affinity, the utility of activity measurements for quantitative evaluation of multiple human tissues is constrained by assay sensitivity as well as the requirement for fresh tissue specimens with functionally intact enzyme from individuals with the same polymorphic genotype. The use of mRNA detection methods with validated specificity thus offers the most practical and reliable means for sensitive quantitation of the relative expression levels of NAT2 in diverse human tissues.
Recent reports have shown that NAT1 gene transcription involves at least two different promoters and more than 10 different 5′ non-coding exons (Husain et al., 2004; Boukouvala and Sim, 2005; Butcher et al., 2005; Barker et al., 2006). Two previous studies indicated that NAT2 mRNA synthesis is less complex, involving transcription from a single promoter located more than 8.7 kb upstream of the ORF-exon and removal of a single 8.7 kb intron during splicing (Ebisawa and Deguchi, 1991; Deguchi, 1992), but tentative evidence for an additional promoter site was recently described (Boukouvala and Sim, 2005). To critically test the major single-promoter model of NAT2, we have now conducted an extensive 5′-RLM-RACE analysis of liver RNA and compared the results of quantitative reverse transcriptase PCR (q-RT-PCR) assays based on intron-spanning versus intra-exon primer sets in diverse tissues.
MATERIALS AND METHODS
5′-RLM-RACE analysis of NAT2 mRNA
5′-RLM-RACE analysis was performed starting with 10 μg total RNA, using the First-Choice RLM-RACE kit (Ambion) according to the manufacturer’s instructions. The final reverse transcription (RT) was performed with random decamer primers in a 20 μl reaction. The primers used for nested PCR were the adapter primers supplied by Ambion and the NAT2-specific outer, 5′-TTCCTCTCTCTTCTGTCAAGCAGAAAATG-3′, and inner, 5′-AACCATGCCAGTGCTGTATTTGTTAA-3′, primers. The NAT2 primers were designed to be specific for NAT2 (not NAT1) and to avoid the positions of known polymorphic sites. To obtain clones representing independently initiated transcripts, multiple independent nested PCRs were carried out using as template 0.5 or 1 μl of product from the RT reaction stage of the 5′-RLM-RACE procedure with liver RNA. The outer reactions were each 25 μl. Two μl of the resulting products were templates for subsequent 30 μl inner reactions. All PCRs were started in a preheated 94°C block followed by 94°C for 3 min, and 35 cycles of 94°C for 30 s, 60°C for 30 s, 72°C for 90 s with a final extension at 72°C for 7 min. PCR products for sequencing were resolved on a 1% agarose gel, purified with Qiaex II (Qiagen) and cloned with the TOPO TA Cloning Kit into the pcDNA 3.1/V5-His-TOPO vector (Invitrogen). Sequence reactions prepared with ABI Big Dye Terminators were analyzed on the ABI 310 Genetic Analyzer, as recommended by the manufacturer (Applied Biosystems). Transcription start sites were inferred from sequence adjoining that of the 5′-RLM-RACE adapter and mRNA splice locations were identified by alignment of cDNA sequences with NAT2 genomic sequences using the BLAT tool (Kent, 2002) at the UCSC Gateway (http://genome.ucsc.edu/cgi-bin/hgGateway).
Database analyses
NAT2-specific cDNA and spliced EST sequences were identified by searches at the NCBI Unigene (http://www.ncbi.nlm.nih.gov/UniGene), DBTSS (http://dbtss.hgc.jp) and UCSC Gateway databases (Kent et al., 2002; Suzuki et al., 2002; Wheeler et al., 2006; Yamashita et al., 2006). Selected non-redundant cDNA sequences were aligned with genomic DNA using the BLAT tool (Kent, 2002) at the UCSC Gateway.
Human RNA samples
Purified total RNAs from human tissues were obtained from two independent commercial sources, Ambion (Ambion Inc., Austin, TX) and BD (BD Biosciences Clontech, Palo Alto, CA). The human tissue expression panel from Ambion included adipose, bladder, brain, cervix, colon, esophagus, heart, kidney, liver, lung, ovary, placenta, prostate, skeletal muscle, small intestine, spleen, testis, thymus, thyroid and trachea. Each of the Ambion panel RNAs was a pool derived from three individuals. A sample of breast RNA, also obtained from Ambion, was derived from one female. The expression panel obtained from BD included RNAs from brain, cerebellum, colon, fetal brain, fetal liver, heart, kidney, lung, placenta, prostate, salivary gland, skeletal muscle, small intestine, spinal cord, spleen, stomach, testis, thymus, trachea and uterus. The BD panel RNAs generally were pooled from a variable number of individuals, ranging from 3 to 63, however the brain, heart, placenta, and stomach RNAs were all derived from single individuals. RNAs representing adrenal gland, bladder and liver were also obtained from BD. For the 5′-RLM-RACE analysis, the liver RNA sample from BD and a second liver RNA sample from Ambion, representing different individual males were used. MCF-7 cells were grown as described previously (Husain et al. 2004). HepG2 human hepatocellular carcinoma cells were obtained from the ATCC(# HB-8065) and cultured in DMEM/F12 (1:1) (Gibco) supplemented with 10% fetal bovine serum (Hyclone), penicillin (100 U/ml) and streptomycin (100 ug/ml) (BioWhittaker). Cells were propagated in a 37°C humidified chamber containing 5% CO2. Cell culture medium was routinely changed every 2–3 days. Frozen samples of human colon tumor cell lines Caco-2 (J.C. States), SW480 (W.S. Zundel) and HT-29 (D.M. Miller), human lung adenocarcinoma cell line A549 (C.M. Klinge), and human embryonic kidney-derived cell line HEK293 (C.M. Klinge) were provided by the laboratories of the indicated University of Louisville investigators. RNAs were extracted as previously described (Barker et al., 2006).
Quantitative real-time RT-PCR
For quantitative real-time RT-PCR, TaqMan analysis was performed using the 7700 sequence detection system from ABI (Applied Biosystems, Foster City, CA). The 20 μl PCR reactions were 1X TaqMan Universal Master Mix, with NAT2 forward and reverse primers at 300 nM and 100 nM probe. The primers, 5′-TTGGAAGCAAGAGGATTGCAT-3′ and, 5′-GATCTGGTGCTCAAGAATGTCAGT-3′ span the position of the 8.7 kb intron (Ebisawa and Deguchi, 1991; Deguchi, 1992; Boukouvala and Sim, 2005) and were used with the probe 6FAM 5′-TCCTGGTTGCTGGCC-3′MGBNFQ. A second NAT2 primer pair and probe set has been described (Zang et al., 2004) and is located entirely within the 3′ portion of the single exon that contains the entire NAT2 ORF. For PCR, initial incubations at 50°C for 2 min and 94°C for 10 min were followed by 40 cycles of 95°C for 15 s and 60°C for 1 min. Quantitation of the endogenous control 18S rRNA was performed using TaqMan Ribosomal RNA Control Reagents for 18S rRNA (Applied Biosystems). Four μl of diluted cDNA, equivalent to 40 ng of the initial RNA template, was used in each PCR. Two independent RT reactions were prepared for each RNA, and for each cDNA product, real-time PCRs were carried out in duplicate, for a total of four readings. Each assay plate included reaction mix controls with water in place of template. As an additional negative control, TaqMan quantitation of reactions prepared in parallel without addition of RT were also run at least once for each set of replicate RT reactions. Baselines and threshold levels were selected as recommended by ABI and values of Ct, the cycle number at which the measured fluorescence reached the set threshold value, were recorded. For each real-time run, a ΔCt (NAT2 Ct –18S rRNA Ct) was calculated for each sample and a ΔΔCt value was then derived by subtracting the smallest ΔCt from all ΔCt values. The formula 2 (−ΔΔCt) was used to calculate an initial relative concentration value for all samples, except that samples with a NAT2 Ct of 40 were assigned as zero. For each RT set, the measures obtained from the two real-time runs were averaged and normalized with respect to the average of all samples in the same RT group.
RESULTS
Molecular analysis of the 5′ structure of NAT2 mRNA
Two human male liver RNA samples, obtained from independent commercial sources, were each submitted to 5′-RLM-RACE for identification of NAT2 transcription start sites (TSSs) and determination of 5′ mRNA splicing patterns. Clones of 41 independent 5′-RLM-RACE products were sequenced. The location of 40 of the TSSs was between 8,682 and 8753 bp upstream of the NAT2 ORF exon (Figure 1A), with 9 TSSs at the -8711 adenine and 25 TSSs at the -8716 adenine. These two adenines were located at positions -59 and -64 with respect to the splice donor sequence utilized in all of the corresponding mRNAs. The only atypical 5′-RLM-RACE clone originated from a start site located a further 4.6 kb upstream from the −8.7 kb promoter and the spliced structure did not include any sequences from the −8.7 kb promoter region (data not shown).
FIG 1.
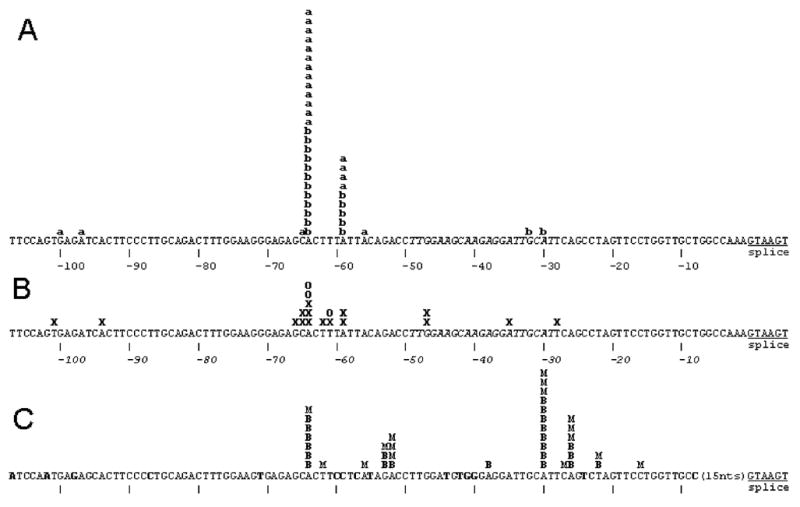
Summary of 5′ termini of NAT2 cDNAs from 5′-RLM-RACE analysis of liver RNA samples and from public databases with comparison to NAT1. A) 5′ termini determined by 5′-RLM-RACE of liver samples from Ambion and BD respectively indicated by “a” and “b”. The positions of the most frequent TSS locations at -59 and -64 are located 8711 and 8716 nucleotides upstream of the NAT2 ORF. B) The 5′ termini of NCBI database clones from liver (D90042, BG569293, AV658623, AV658656, BG533459, BG563731, BG568400, BG618195, BG569272, BC015878, CB161982, CB161860, D90040); colon adenocarcinoma (BX095770, AI792606) and hepatocellular carcinoma (AV684197) are shown as X and the 5′ termini of the small intestine oligo-capped clones HSI05750, HSI08034 and HSI15615 from DBTSS are shown as O. C) NAT1 mRNA termini previously determined by 5′-RLM-RACE with RNA samples from breast and the MCF-7 cell line (Husain et al., 2004) are indicated by B and M respectively. The sequence corresponding to the intron-spanning forward q-RT-PCR primer is shown in italics. In the NAT1 DNA sequence, nucleotides not identical to the NAT2 sequence are shown in bold.
Figure 1B summarizes the positions of the 5′ nucleotides present in 19 different NAT2 cDNA clone sequences retrieved from the public databases described in Materials and Methods. Although the cloning of most of these cDNAs was not specifically intended to detect TSSs, every observed 5′ terminus lies within the same ~70 bp region as the TSSs identified by 5′-RLM-RACE, and a similar pattern of clustering of 5′ ends in or near the -59 to -64 segment is apparent. The three clones from DBTSS, HSI05750, HSI08034 and HSI15615, were isolated from small intestine RNA with an “oligo-capping” method (Suzuki et al., 2002) which, like 5′-RLM-RACE, defines the position of capped 5′ nucleotides. The 5′ termini of two of the small intestine DBTSS clones are at -64, which is also the most common TSS in liver, and the third is at -61.
The region containing the NAT2 TSSs has 85% sequence identity to the major transcription start site region of the paralogous NAT1 gene (Figure 1C). Although there was more diversity in the locations of NAT1 TSSs identified in breast tissue and a breast tumor cell line (Husain et al., 2004), one of the frequent NAT1 TSSs occurred at an adenine which corresponds to the primary NAT2 TSS adenine at the -64 position (Figure 1).
For all 40 of the liver 5′-RLM-RACE cDNAs with 5′ termini in the −8.7 kb promoter region, the mRNA splicing pattern conformed to that shown in Figure 2, utilizing the consensus splice donor sequence located 8,658 nucleotides upstream of the NAT2 ORF exon (Figure 1). All 19 of the NAT2 public database cDNAs also utilize this splice donor sequence, and 18/19 are spliced to the typical NAT2 ORF exon acceptor site. One cDNA, BG569272, exhibits splicing which eliminates 339 nucleotides of the NAT2 ORF exon and may represent an aberrant transcript form or cloning artifact.
FIG. 2.

Structure of the typical NAT2 mRNA in relation to the NAT2 gene and the relative locations of primers and probes used for the intron-spanning and ORF TaqMan q-RT-PCRs. The sequence of the primer marked IS-for is shown in italics in the NAT2 sequence shown in Figure 1.
Quantitative RT-PCR analysis of NAT2 mRNA in diverse human tissues
Two different TaqMan primer and probe sets were utilized for quantitative analysis of NAT2 mRNA (Figure 2). In genomic DNA, the primers of the intron spanning assay set, IS-for and IS-rev (Figure 2), are separated by the 8.7 kb intron, eliminating any measurement error due to possible DNA impurities in RNA samples. The IS-for primer sequence is entirely 3′ to 38/40 of the NAT2 TSS locations identified in liver RNA (Figure 1A) and all 3 of the authentic TSSs from small intestine (Figure 1B). TaqMan intron-spanning assay results, on a logarithmic scale, are shown in Figures 3A and 4A for two sets of human RNA samples representing 29 different tissue types, including 15 tissues represented in both panels. In each set, the highest NAT2 mRNA level was found in liver, with similar or slightly less expression found in small intestine and about 5–10 fold lower expression in colon. For several tissues, including kidney, lung, spleen and testis, which are represented in both the Ambion (Figure 3A) and the BD series (Figure 4A), NAT2 expression levels were consistently about 1% of that detected in liver. Lower or more variable levels of expression occurred in several other tissues, and consistently low levels of NAT2 expression were found in both of the samples representing heart, skeletal muscle, thymus and trachea (Figures 3A and 4A).
FIG. 3.
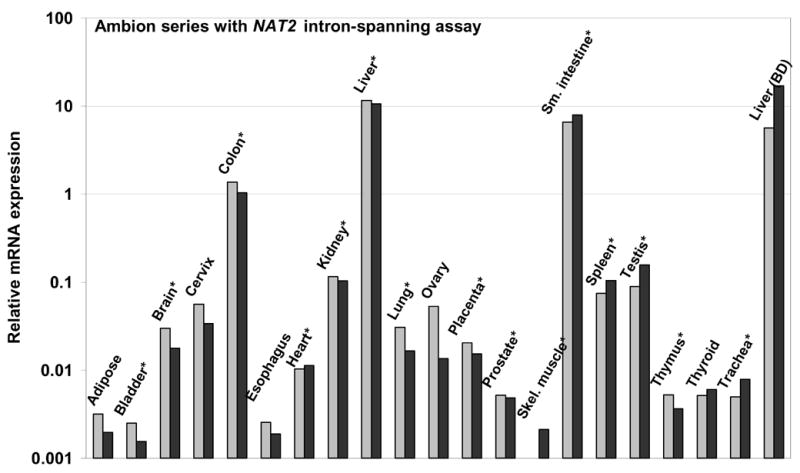

TaqMan q-RT-PCR analyses of NAT2 in human tissue RNAs from Ambion. Duplicate measurements are indicated by light and dark gray bars. A) Relative NAT2 mRNA expression determined by TaqMan with the intron-spanning assay. B) Relative NAT2 mRNA expression determined by TaqMan with the NAT2 ORF assay. An * marks tissues present in both tested panels.
FIG. 4.
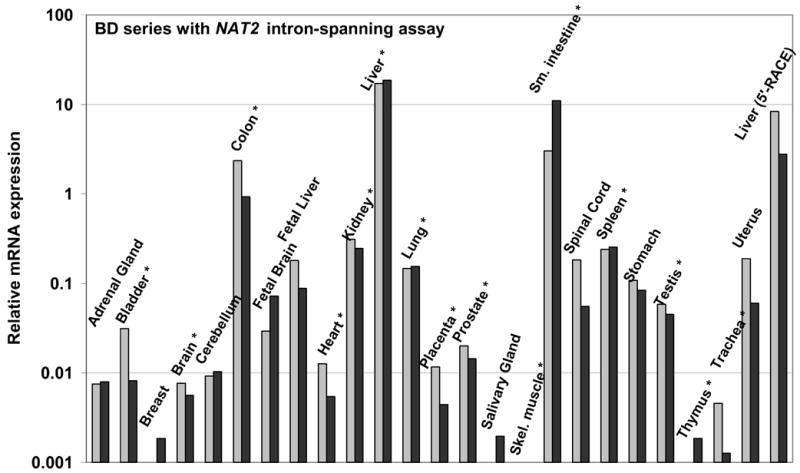

TaqMan q-RT-PCR analyses of NAT2 in human tissue RNAs from BD, a breast RNA sample from Ambion and the liver sample from Ambion included in the 5′-RACE analysis. Duplicate measurements are indicated by light and dark gray bars. A) Relative NAT2 mRNA expression determined by TaqMan with the intron-spanning assay. B) Relative NAT2 mRNA expression determined by TaqMan with the ORF assay. In panel B, measurements of heart, kidney, salivary gland, testis and thymus are omitted because reactions without addition of reverse transcriptase indicated the presence of DNA contamination sufficient to interfere with the ORF assay. An * marks tissues present in both tested panels.
Figures 3B and 4B show results of a second NAT2-specific TaqMan q-RT-PCR assay, which utilizes primers and a probe all located within the single NAT2 ORF exon (Figure 2), for the same tissue RNA samples assayed with the intron-spanning set. The NAT2 ORF assay results showed a somewhat poorer signal-to-noise ratio, as indicated by a general tendency to higher Ct values, and the presence of genomic DNA contamination interfered with measurements of a few samples (Figure 4B). The detected hierarchy of tissue-specific NAT2 mRNA expression was very similar for the intron-spanning and the ORF TaqMan assays in the tissue RNA panels from Ambion (Figures 3A and 3B) and BD (Figures 4A and 4B). Thus, there was no evidence for any alternative NAT2 promoter(s) expressing NAT2 mRNA with a different tissue-specific profile nor was their evidence of sufficient quantity to substantially alter the relative level of NAT2 mRNA established by transcription at the −8.7 kb promoter locus.
Quantitative RT-PCR analysis of NAT2 mRNA in human cell lines
Figure 5 shows NAT2 TaqMan measurements for five tumor cell lines from breast (MCF-7), colon (Caco-2, SW480, and HT-29), liver (HepG2) and lung (A549) and a virally transformed embryonic kidney cell line (HEK293). None of the lines, including those derived from liver or colon, showed a level of NAT2 expression that corresponded to that of the high-expressing normal tissues. The two cell lines with the highest NAT2 expression, HepG2 and Caco-2, exhibited only about 1% and 5–10% respectively, of the NAT2 expression in the corresponding tissue.
FIG. 5.
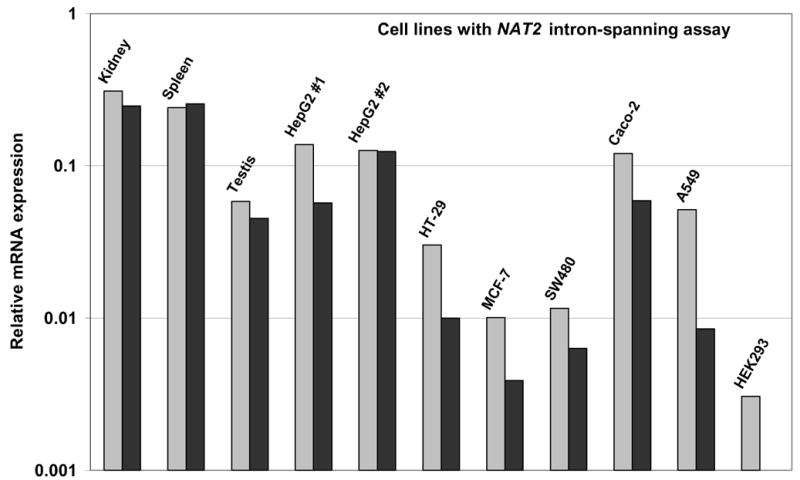
TaqMan q-RT-PCR analysis of NAT2, with the intron-spanning assay, in RNA extracted from human cell lines derived from liver (HepG2), colon (HT-29, SW480, Caco-2), lung (A549), and breast (MCF-7) tumors and embryonic kidney (HEK293). Duplicate measurements are indicated by light and dark gray bars. Relative NAT2 mRNA expression is shown on the same scale as Figure 4A, with comparison to kidney, spleen and testis measurements also shown in Figure 4A.
DISCUSSION
Accurate measurement of NAT2 expression in different human tissues is an important aspect of assessing its role in drug toxicity or carcinogenesis at various organ sites. In this study, a NAT2-specific q-RT-PCR TaqMan assay with intron-spanning primers was designed based on the structure of NAT2 cDNAs in public databases and the design was validated by an extensive 5′-RLM-RACE analysis of NAT2 mRNA in liver. The accuracy of the assay for assessing relative mRNA levels in diverse tissues was verified by comparison to an alternative q-RT-PCR assay based on primers within the NAT2 open reading frame.
A recent study suggested that NAT2 transcripts also may be initiated immediately 5′ to the ORF-containing exon based on detection of RT-PCR products corresponding to such transcripts, most prominently in liver (Boukouvala and Sim, 2005). We have detected similar products by RT-PCR of liver and placental RNA, but RT-dependent PCR products of equal or greater prominence were also found using primer pairs from entirely within the 8.7 kb intron or from segments including the NAT2 promoter exon and immediately adjacent intronic sequences (data not shown). These results suggested that unspliced or incomplete primary NAT2 transcripts from the −8.7 kb promoter are present in RNA from liver and other tissues and that functional activity of an ORF-adjacent promoter cannot be directly inferred from demonstration of RT-PCR products derived from that region. The location of any NAT2 promoter immediately 5′ to the NAT2 ORF also is inconsistent with the 5′ structure of cDNAs in the public databases and our finding that 0/41 of the NAT2 cDNAs characterized by 5′-RLM-RACE of liver mRNAs had a 5′ terminus at that position. Together, the findings that NAT2 transcripts in liver originate predominantly at the −8.7 kb promoter and that both the intron-spanning (Figures 3A and 4A) and ORF-only (Figures 3B and 4B) TaqMan assays show similar relative levels of NAT2 mRNA in liver and other tissues suggest that any other possible alternative promoter in the non-hepatic tissues must be relatively very weak. These results also suggest that the pattern of NAT2 transcription start sites at the −8.7 kb promoter in tissues other than liver is not substantially shifted to a location 3′ to the forward primer used for the q-RT-PCR assay, since such a pattern of transcription initiation would also be detected as a discrepancy between the reported intron-spanning and ORF-only measurements. Thus, in the absence of evidence for any alternative NAT2 transcription start site or splicing pattern, the intron-spanning TaqMan assay design shown in Figure 2 appears to be superior for comparing NAT2 mRNA levels in different human tissue samples because of its high sensitivity and the elimination of measurement errors caused by contaminating genomic DNA.
The reliability of the NAT2 measurements is also dependent on specificity of the assay which is important to verify empirically because of the high homology of the NAT2 and NAT1 sequences in the regions that include the TaqMan assay primers. The MCF-7 cell line is known to express a high level of NAT1 mRNA (Husain et al., 2004), but only minimal levels of NAT2 mRNA were detected in MCF-7 with the intron-spanning assay (Figure 5) or the ORF assay (data not shown), demonstrating that each assay is highly specific for NAT2.
None of the cell lines studied here, including ones derived from liver and colon, was found to have the high level of NAT2 mRNA expression characteristic of those tissues. This finding is consistent with previous reports of very low or undetectable NAT2 enzyme activity in liver-derived cell lines (Coroneos and Sim, 1993). The observed differences between human tissues and cultured immortalized cell lines are not unexpected, since gene expression patterns in transformed and cancer cell lines do not always reflect the tissue from which they are derived and can vary with culture conditions.
For the 45 human tissue RNA samples representing 29 different organ types, NAT2 mRNA levels (Figures 3A and 4A) were highest in liver, with slightly lower amounts in small intestine and colon. The expression of NAT2 in liver has long been recognized as the primary determinant of the human acetylator phenotype (Grant et al., 1990; Bendriss et al., 1998) and NAT2 enzyme is most readily detected in liver, colon and intestine (Turesky et al., 1991; Sim et al., 2000). NAT2 mRNA was also readily detected in both tested samples of kidney, lung, spleen and testis and single samples from fetal liver, spinal cord, stomach and uterus at a level about 1% compared to liver. NAT2 mRNA was also detected in heart, skeletal muscle, thymus and trachea, albeit at 10-fold lower levels. Wide-spread expression of NAT2 in human tissues has been previously reported (Windmill et al., 2000). The low level of NAT2 mRNA in fetal liver compared to adult liver suggests that NAT2 expression in humans may follow a similar developmental pattern as in mice (McQueen and Chau, 2003).
NAT2 mRNA expression in bladder is of particular interest, because very strong epidemiological associations have been established between the NAT2 slow acetylation phenotype and increased risk of cancer of the urinary bladder caused by arylamines (Garcia-Closas et al., 2005; Carreon et al., 2006; Hein, 2006). The NAT2 rapid acetylation phenotype has also often been associated with increased risk of colorectal cancer (Lilla et al., 2006; Moslehi et al., 2006). Although NAT2 mRNA was relatively high in colon, the NAT2 mRNA level in bladder was very low compared to other tested tissues, about 0.1% of the liver level. This result suggests caution in assuming that a gene modifying cancer susceptibility is more likely to be highly expressed in the affected tissue. The association of urinary bladder cancer with NAT2 genetic polymorphism could be due to impaired detoxification of carcinogens in the liver, where NAT2 mRNA expression is high. Alternatively, factors such as the concentrations of pro-carcinogens, the presence of competing or cooperating enzyme activities or other cell or organ-specific features could magnify the effects of NAT2 enzyme activity in the bladder. A third possibility is that mRNA levels and enzyme activities measured with extracts from whole organs do not reflect the activity of the specific population of cells in which the carcinogenic mutations arise.
The identification of the precise location of NAT2 transcription start sites by 5′-RLM-RACE permits a detailed comparison of the corresponding NAT1 P1 (Husain et al., 2004) and NAT2 promoter sequences. In the immediate vicinity of the NAT2 TSSs, there is 85% nucleotide identity with the NAT1 P1 promoter (Figure 1), similar to the 87% identity found in the coding region of these paralogous genes. Within this region, the spectrum of NAT2 TSSs in liver is relatively limited, with 34/40 of the 5′-termini located at one of two closely spaced adenine residues. In contrast, the spectrum of NAT1 TSSs, previously determined in RNA from breast and the MCF-7 cell line (Husain et al., 2004) is more diffuse, with only a partial overlap with the location of the NAT2 TSSs (Figure 1). It is notable that the NAT1 P1 promoter is actively transcribed in essentially all human tissues (Barker et al., 2006) whereas high level NAT2 expression is limited to very few tissues. The more limited spectrum of NAT2 transcription initiation sites may thus reflect a transcription initiation complex that has a greater degree of structural definition due to the required binding of tissue-specific transcription factors. Another distinction of the NAT2 promoter that likely contributes to its different expression profile is the absence of the consensus Sp1 site that occurs in the NAT1 P1 promoter immediately upstream of the sequence shown in Figure 1.
In conclusion, NAT2-specific transcription start sites were identified. A sensitive and specific TaqMan RT-PCR assay with intron-spanning primers was developed and used, together with a second TaqMan RT-PCR assay based on amplification of a NAT2 ORF exon segment, to measure NAT2 mRNA in 29 different human tissues. NAT2 mRNA was highest in liver, small intestine and colon and readily detected in most other tissues albeit at levels 1% or less than in liver. Expression of NAT2 in various human tissues may be relevant to associations between NAT2 genetic polymorphism and drug toxicity or arylamine-induced cancers at these sites.
ABBREVIATIONS
- NAT2
N-acetyltransferase 2
- NAT1
N-acetyltransferase 1
- RT
reverse transcriptase
- PCR
polymerase chain reaction
- q-RT-PCR
quantitative reverse transcriptase polymerase chain reaction
- ORF
open reading frame
- 5′-RLM-RACE
5′-RNA ligase-mediated rapid amplification of cDNA ends
- TSS
transcription start sites
- BD
Biosciences Clontech
Footnotes
This work was partially supported by National Institutes of Health grants CA34627 and ES12557. Portions of this work constituted partial fulfillment for the PhD in pharmacology and toxicology awarded to Anwar Husain from the University of Louisville.
References
- Barker DF, Husain A, Neale JR, Martini BD, Zhang X, Doll MA, States JC, Hein DW. Functional properties of an alternative, tissue-specific promoter for human arylamine N-acetyltransferase 1. Pharmacogenet Genomics. 2006;16:515–525. doi: 10.1097/01.fpc.0000215066.29342.26. [DOI] [PMC free article] [PubMed] [Google Scholar]
- Bendriss EK, Bechtel YC, Paintaud G, Brientini MP, Mantion G, Miguet JP, Bennani A, Bechtel PR. Acetylation polymorphism expression in patients before and after liver transplantation: influence of host/graft genotypes. Pharmacogenetics. 1998;8:201–209. doi: 10.1097/00008571-199806000-00003. [DOI] [PubMed] [Google Scholar]
- Blum M, Grant DM, McBride W, Heim M, Meyer UA. Human arylamine N-acetyltransferase genes: isolation, chromosomal localization, and functional expression. DNA Cell Biol. 1990;9:193–203. doi: 10.1089/dna.1990.9.193. [DOI] [PubMed] [Google Scholar]
- Boukouvala S, Fakis G. Arylamine N-acetyltransferases: what we learn from genes and genomes. Drug Metab Rev. 2005;37:511–564. doi: 10.1080/03602530500251204. [DOI] [PubMed] [Google Scholar]
- Boukouvala S, Sim E. Structural analysis of the genes for human arylamine N-acetyltransferases and characterisation of alternative transcripts. Basic Clin Pharmacol Toxicol. 2005;96:343–351. doi: 10.1111/j.1742-7843.2005.pto_02.x. [DOI] [PubMed] [Google Scholar]
- Butcher NJ, Arulpragasam A, Goh HL, Davey T, Minchin RF. Genomic organization of human arylamine N-acetyltransferase Type I reveals alternative promoters that generate different 5′-UTR splice variants with altered translational activities. Biochem J. 2005;387:119–127. doi: 10.1042/BJ20040903. [DOI] [PMC free article] [PubMed] [Google Scholar]
- Butcher NJ, Boukouvala S, Sim E, Minchin RF. Pharmacogenetics of the arylamine N-acetyltransferases. Pharmacogenomics J. 2002;2:30–42. doi: 10.1038/sj.tpj.6500053. [DOI] [PubMed] [Google Scholar]
- Carreon T, Ruder AM, Schulte PA, Hayes RB, Rothman N, Waters M, Grant DJ, Boissy R, Bell DA, Kadlubar FF, Hemstreet GP, III, Yin S, LeMasters GK. NAT2 slow acetylation and bladder cancer in workers exposed to benzidine. Int J Cancer. 2006;118:161–168. doi: 10.1002/ijc.21308. [DOI] [PubMed] [Google Scholar]
- Coroneos E, Sim E. Arylamine N-acetyltransferase activity in human cultured cell lines. Biochem J. 1993;294 ( Pt 2):481–486. doi: 10.1042/bj2940481. [DOI] [PMC free article] [PubMed] [Google Scholar]
- Deguchi T. Sequences and expression of alleles of polymorphic arylamine N-acetyltransferase of human liver. J Biol Chem. 1992;267:18140–18147. [PubMed] [Google Scholar]
- Ebisawa T, Deguchi T. Structure and restriction fragment length polymorphism of genes for human liver arylamine N-acetyltransferases. Biochem Biophys Res Commun. 1991;177:1252–1257. doi: 10.1016/0006-291x(91)90676-x. [DOI] [PubMed] [Google Scholar]
- Garcia-Closas M, Malats N, Silverman D, Dosemeci M, Kogevinas M, Hein DW, Tardon A, Serra C, Carrato A, Garcia-Closas R, Lloreta J, Castano-Vinyals G, Yeager M, Welch R, Chanock S, Chatterjee N, Wacholder S, Samanic C, Tora M, Fernandez F, Real FX, Rothman N. NAT2 slow acetylation, GSTM1 null genotype, and risk of bladder cancer: results from the Spanish Bladder Cancer Study and meta-analyses. Lancet. 2005;366:649–659. doi: 10.1016/S0140-6736(05)67137-1. [DOI] [PMC free article] [PubMed] [Google Scholar]
- Grant DM, Morike K, Eichelbaum M, Meyer UA. Acetylation pharmacogenetics. The slow acetylator phenotype is caused by decreased or absent arylamine N-acetyltransferase in human liver. J Clin Inves. 1990;85:968–972. doi: 10.1172/JCI114527. [DOI] [PMC free article] [PubMed] [Google Scholar]
- Hein DW. N-acetyltransferase 2 genetic polymorphism: effects of carcinogen and haplotype on urinary bladder cancer risk. Oncogene. 2006;25:1649–1658. doi: 10.1038/sj.onc.1209374. [DOI] [PMC free article] [PubMed] [Google Scholar]
- Hein DW, Doll MA, Fretland AJ, Leff MA, Webb SJ, Xiao GH, Devanaboyina US, Nangju NA, Feng Y. Molecular genetics and epidemiology of the NAT1 and NAT2 acetylation polymorphisms. Cancer Epidemiol, Biomark Prev. 2000b;9:29–42. [PubMed] [Google Scholar]
- Hein DW, Doll MA, Nerland DE, Fretland AJ. Tissue distribution of N-acetyltransferase 1 and 2 catalyzing the N-acetylation of 4-aminobiphenyl and O-acetylation of N-hydroxy-4-aminobiphenyl in the congenic rapid and slow acetylator Syrian hamster. Mol Carcinog. 2006;45:230–238. doi: 10.1002/mc.20164. [DOI] [PubMed] [Google Scholar]
- Hein DW, McQueen CA, Grant DM, Goodfellow GH, Kadlubar FF, Weber WW. Pharmacogenetics of the arylamine N-acetyltransferases: a symposium in honor of Wendell W. Weber. Drug Metab Dispos. 2000a;28:1425–1432. [PubMed] [Google Scholar]
- Husain A, Barker DF, States JC, Doll MA, Hein DW. Identification of the major promoter and non-coding exons of the human arylamine N-acetyltransferase 1 gene (NAT1) Pharmacogenetics. 2004;14:397–406. doi: 10.1097/01.fpc.0000114755.08559.6e. [DOI] [PubMed] [Google Scholar]
- Kent WJ. BLAT--the BLAST-like alignment tool. Genome Res. 2002;12:656–664. doi: 10.1101/gr.229202. [DOI] [PMC free article] [PubMed] [Google Scholar]
- Kent WJ, Sugnet CW, Furey TS, Roskin KM, Pringle TH, Zahler AM, Haussler D. The human genome browser at UCSC. Genome Res. 2002;12:996–1006. doi: 10.1101/gr.229102. [DOI] [PMC free article] [PubMed] [Google Scholar]
- Lilla C, Verla-Tebit E, Risch A, Jager B, Hoffmeister M, Brenner H, Chang-Claude J. Effect of NAT1 and NAT2 genetic polymorphisms on colorectal cancer risk associated with exposure to tobacco smoke and meat consumption. Cancer Epidemiol Biomark Prev. 2006;15:99–107. doi: 10.1158/1055-9965.EPI-05-0618. [DOI] [PubMed] [Google Scholar]
- Loehle JA, Cornish V, Wakefield L, Doll MA, Neale JR, Zang Y, Sim E, Hein DW. N-acetyltransferase (Nat) 1 and 2 expression in Nat2 knockout mice. J Pharmacol Exp Ther. 2006;319:724–728. doi: 10.1124/jpet.106.108662. [DOI] [PubMed] [Google Scholar]
- McQueen CA, Chau B. Neonatal ontogeny of murine arylamine N-acetyltransferases: implications for arylamine genotoxicity. Toxicol Sci. 2003;73:279–286. doi: 10.1093/toxsci/kfg086. [DOI] [PubMed] [Google Scholar]
- Moslehi R, Chatterjee N, Church TR, Chen J, Yeager M, Weissfeld J, Hein DW, Hayes RB. Cigarette smoking, N-acetyltransferase genes and the risk of advanced colorectal adenoma. Pharmacogenomics. 2006;7:819–829. doi: 10.2217/14622416.7.6.819. [DOI] [PubMed] [Google Scholar]
- Ohsako S, Deguchi T. Cloning and expression of cDNAs for polymorphic and monomorphic arylamine N-acetyltransferases from human liver. J Biol Chem. 1990;265:4630–4634. [PubMed] [Google Scholar]
- Shyamsundar R, Kim YH, Higgins JP, Montgomery K, Jorden M, Sethuraman A, van de Rijn M, Botstein D, Brown PO, Pollack JR. A DNA microarray survey of gene expression in normal human tissues. Genome Biol. 2005;6:R22. doi: 10.1186/gb-2005-6-3-r22. [DOI] [PMC free article] [PubMed] [Google Scholar]
- Sim E, Payton M, Noble M, Minchin R. An update on genetic, structural and functional studies of arylamine N-acetyltransferases in eucaryotes and procaryotes. Hum Mol Genet. 2000;9:2435–2441. doi: 10.1093/hmg/9.16.2435. [DOI] [PubMed] [Google Scholar]
- Suzuki Y, Yamashita R, Nakai K, Sugano S. DBTSS: DataBase of human Transcriptional Start Sites and full-length cDNAs. Nucleic Acids Res. 2002;30:328–331. doi: 10.1093/nar/30.1.328. [DOI] [PMC free article] [PubMed] [Google Scholar]
- Turesky RJ, Lang NP, Butler MA, Teitel CH, Kadlubar FF. Metabolic activation of carcinogenic heterocyclic aromatic amines by human liver and colon. Carcinogenesis. 1991;12:1839–1845. doi: 10.1093/carcin/12.10.1839. [DOI] [PubMed] [Google Scholar]
- Weber WW, Hein DW. N-acetylation pharmacogenetics. Pharmacol Rev. 1985;37:25–79. [PubMed] [Google Scholar]
- Wheeler DL, Barrett T, Benson DA, Bryant SH, Canese K, Chetvernin V, Church DM, DiCuccio M, Edgar R, Federhen S, Geer LY, Helmberg W, Kapustin Y, Kenton DL, Khovayko O, Lipman DJ, Madden TL, Maglott DR, Ostell J, Pruitt KD, Schuler GD, Schriml LM, Sequeira E, Sherry ST, Sirotkin K, Souvorov A, Starchenko G, Suzek TO, Tatusov R, Tatusova TA, Wagner L, Yaschenko E. Database resources of the National Center for Biotechnology Information. Nucleic Acids Res. 2006;34:D173–180. doi: 10.1093/nar/gkj158. [DOI] [PMC free article] [PubMed] [Google Scholar]
- Williams JA. Single nucleotide polymorphisms, metabolic activation and environmental carcinogenesis: why molecular epidemiologists should think about enzyme expression. Carcinogenesis. 2001;22:209–214. doi: 10.1093/carcin/22.2.209. [DOI] [PubMed] [Google Scholar]
- Windmill KF, Gaedigk A, Hall PM, Samaratunga H, Grant DM, McManus ME. Localization of N-acetyltransferases NAT1 and NAT2 in human tissues. Toxicol Sci. 2000;54:19–29. doi: 10.1093/toxsci/54.1.19. [DOI] [PubMed] [Google Scholar]
- Yamashita R, Suzuki Y, Wakaguri H, Tsuritani K, Nakai K, Sugano S. DBTSS: DataBase of Human Transcription Start Sites, progress report 2006. Nucleic Acids Res. 2006;34:D86–89. doi: 10.1093/nar/gkj129. [DOI] [PMC free article] [PubMed] [Google Scholar]
- Zang Y, Zhao S, Doll MA, States JC, Hein DW. The T341C (Ile114Thr) polymorphism of N-acetyltransferase 2 yields slow acetylator phenotype by enhanced protein degradation. Pharmacogenetics. 2004;14:717–723. doi: 10.1097/00008571-200411000-00002. [DOI] [PubMed] [Google Scholar]