Abstract
Although a contracting muscle regulates its energy output depending on the load imposed on it (“Fenn effect”), the mechanism underlying the load-dependent energy output remains obscure. To explore the possibility that the mechanical efficiency, with which chemical energy derived from ATP hydrolysis is converted into mechanical work, of individual myosin heads changes in a load-dependent manner, we examined the auxotonic shortening of glycerinated rabbit psoas muscle fibers, containing ATP molecules almost equal in number to the myosin heads, after laser-flash photolysis of caged calcium. Immediately before laser-flash activation, almost all of the myosin heads in the fiber are in the state M⋅ADP⋅Pi, and can undergo only one ATP hydrolysis cycle after activation. When the fibers were activated to shorten under various auxotonic loads, the length, force, and power output changes were found to be scaled according to the auxotonic load. Both the power and energy outputs were maximal under a moderate auxotonic load. The amount of M⋅ADP⋅Pi utilized at a time after activation was estimated from the amount of isometric force developed after interruption of fiber shortening. This amount was minimal in the isometric condition and increased nearly in proportion to the distance of fiber shortening. These results are taken as evidence that the efficiency of chemomechanical energy conversion in individual myosin heads changes in a load-dependent manner.
Keywords: muscle contraction, chemomechanical energy conversion, auxotonic shortening
In 1923, Fenn found that the total energy (heat + work) liberated from a contracting muscle was greater when it lifted a load to do mechanical work than when it was held isometric (1). This phenomenon, called the Fenn effect, indicates that a muscle regulates its energy output depending on the load imposed on it. Although it has been well established that muscle contraction results from relative sliding between the thick and thin filaments, which in turn is caused by alternate formation and breaking of cross-links between the myosin heads on the thick filaments and the sites on the thin filaments, the mechanism underlying the Fenn effect remains obscure. It is also well established that ATP hydrolysis is the immediate source of energy for the myofilament sliding, and that the efficiency with which a muscle converts free energy derived from ATP hydrolysis into mechanical work changes depending on the load (2). The mechanical efficiency versus load relation is bell-shaped, because the efficiency is maximal at a moderate load and tends to zero when the load is greatly reduced or greatly increased. In the light of the above energetics studies, the Fenn effect is associated with load-dependent mechanical efficiency in contracting muscle fibers.
In the contraction model of A. F. Huxley (3) and also in that of Podolsky and Nolan (4), the number of myosin heads involved in muscle mechanical response changes in a load- (or velocity-) dependent manner. In these models, load-dependent efficiency is somehow coupled with changes in the number of the myosin heads, each operating in a similar manner in producing myofilament sliding. Based on the measurement of work done by in vitro ATP-induced actin-myosin sliding, however, Oiwa et al. (5) have suggested the possibility that the load-dependent mechanical efficiency of muscle contraction results from load-dependent changes in the mechanical efficiency of individual myosin heads; in other words, that the Fenn effect originates in each myosin head, causing myofilament sliding.
The present work was undertaken to inquire into the load-dependent efficiency of individual myosin heads in muscle fibers. For this purpose, we chose an experimental condition, in which each myosin head in the fiber could hydrolyze ATP only once during a single mechanical response. This condition was achieved by soaking the fibers in a solution containing ATP at a concentration almost equal to the total myosin head concentration in the fiber, exposing them in air, and then rapidly activating them to contract by using laser-flash photolysis of caged calcium. Immediately before activation, the number of ATP molecules in the fiber is almost equal to the number of myosin heads, so that all the myosin heads are in the state M⋅ADP⋅Pi, in which ATP is already hydrolyzed by the myosin head (M), but the products (ADP and Pi) are still bound to M (6). To measure the power and energy outputs of the fibers under different loads, we used “auxotonic” shortening of the fiber against a linear spring; afterloaded isotonic shortening was not used to avoid complications arising from variation in the time required for the fibers to develop an isometric force equal to the load, so as to cause subsequent isotonic shortening. After activation under an auxotonic load, the fibers shortened exponentially with time, and the force generated increased exponentially. Over a wide range of auxotonic loads, the length and the force records were scaled in proportion to the distance shortened and to the force attained, respectively. Close inspection of changes in the velocity of fiber shortening indicated that the shortening velocity first rose abruptly to a peak <0.1 s after activation, and then decreased exponentially with time as expected from the exponential fiber shortening. The breakdown of M⋅ADP⋅Pi during auxotonic shortening was estimated from the amount of isometric force developed after interrupting shortening at any time after its onset. The amount of M⋅ADP⋅Pi breakdown was minimal at zero auxotonic compliance (the isometric condition), and increased nearly in proportion to the distance of fiber shortening, which increased with increasing auxotonic compliance. These results are taken as evidence for load-dependent mechanical efficiency in individual myosin heads.
MATERIALS AND METHODS
Muscle Fiber Preparation and Experimental Setup.
Strips of rabbit psoas muscle (diameter, 2 mm) were dissected, skinned in the relaxing solution containing 1% Triton X-100 for 15 min on ice, washed in the relaxing solution, and stored in a 50% (vol/vol) mixture of the relaxing solution and glycerol for up to one month in a freezer (−20°C). Single muscle fibers (diameter, 40–60 μm; length, ≤3 mm) or small bundles consisting of two to three muscle fibers were dissected from the glycerinated muscle strips. The preparation was mounted horizontally in an experimental apparatus consisting of five solution cells (volume, 100–300 μl) made of anodized aluminum blocks with glass walls at both sides. The preparation was connected to a force transducer and a servo-motor with aluminum T-clips at both ends. The force transducer (AE801, SensoNor, Holten, Norway) had a resonant frequency of 3.5 kHz in solution and an elastic modulus of 2 N/mm. The servo-motor (G100PD, General Scanning, Watertown, MA) was operated by a driving amplifier (JCCX101, General Scanning), and the position of the motor arm (≈1 cm) was sensed by a displacement transducer (differential transformer) incorporated in the servo-motor. The servo-motor system operated either in the force-control mode or in the length-control mode, the two modes interchangeable, one to the other (7). Fiber shortening in the auxotonic condition was achieved by feeding the force signal to the servo-motor system to increase the resistance of the motor arm against fiber shortening in proportion to the amount of force developed, so that the fibers shortened against a linear spring, i.e., an auxotonic load (7). The sarcomere length was measured by light diffraction of a He-Ne laser beam. The solution cells containing the preparation were exchanged by stepping motors, keeping the preparation stationary. The temperature of the solutions was kept at ≈1°C with a thermoelectric device.
Solutions.
The solutions used in the present work are listed in Table 1. Reagent grade K-propionate, MgCl2, and EGTA were obtained from Wako Pure Chemical (Osaka), and ATP and glutathione (GSH, reduced form) were obtained from Sigma. DM-nitrophen (caged calcium), a photolabile chelator for divalent cations, whose affinity for Ca2+ on laser-flash photolysis changes by five orders of magnitude in 180 μs (8, 9), was obtained from Calbiochem. The steady pCa of the photolysis solution before and after flash irradiation (assuming 50% of the DM-nitrophen was photolyzed) was calculated to be 6.75 and 6.35, respectively (10), although pCa is believed to be ≤4 for the first few seconds after flash photolysis.
Table 1.
Composition of solutions
| Solution | K-propionate | Imidazole | EGTA | ATP | MgCl2 | CaCl2 | Glutathione | DM-nitrophen |
|---|---|---|---|---|---|---|---|---|
| Relaxing | 80 | 20 | 10 | 4 | 5 | — | — | — |
| Contracting* | 80 | 20 | 10 | 4 | 5 | 10.1 | — | — |
| Prephotolysis | 80 | 20 | 0.1 | 0.3 | 1.3 | — | — | — |
| Photolysis | 87 | 22 | — | 0.22 | 4.3 | 0.2 | 11 | 2.6 |
All concentrations in millimoles per liter. Overall ionic strength of the solutions was 170 mM, and their pH was adjusted to 7.2 by KOH. DM-nitrophen, 1-(2-nitro-4,5-dimethoxyphenyl)-N,N,N′,N′-tetrakis [(oxycarbonyl)methyl]-1,2-ethanediamine.
pCA 4.5.
Laser Flash Photolysis of Caged Calcium.
Photolysis of DM-nitrophen was accomplished by a light flash (duration, 8 ns; wavelength, 350 nm; intensity, 20 mJ) from a Nd:YAG laser system (DCR3, Spectra-Physics). The light beam was compressed in both vertical and horizontal directions with a pair of cylindrical lenses to obtain a beam with a nearly rectangular cross-section (0.5 × 3 mm). The light beam, which fully covered the whole preparation, was projected onto the preparation via a prism and a pair of frosted quartz plates, which were effective in making a uniform intensity distribution within the beam. The uniform intensity distribution of the beam on the preparation was checked by placing a piece of Polaroid film at the position of the preparation and examining the “burn pattern” on the film produced by a light flash (11, 12).
The full activation of the fibers by the photoreleased Ca2+ was ensured by the result that the maximum isometric force per unit fiber cross-sectional area, obtained by measuring fiber cross-section by the method of Blinks (13), did not differ significantly whether the fibers were activated by laser flash irradiation (62 ± 14 kN·m−2, mean ± SD, n = 11) or by contracting solution (pCa 4) (57 ± 13 kN·m−2, n = 11) at 4°C.
Experimental Procedures and Data Analysis.
The fiber was first placed in the cell containing relaxing solution for 5–10 min, and its sarcomere length was adjusted to 2.4 μm. In rabbit skeletal muscle, the thick and thin filaments fully overlap at sarcomere lengths below 2.4 μm (14). Because the extent of fiber shortening did not exceed 15% of the initial fiber length L0, the number of the myosin heads that could interact with the thin filaments was always maximal during the course of the experiments. The preparation was then transferred to prephotolysis solution and, after 2 min, further transferred to photolysis solution containing DM-nitrophen and kept in it for 40 s to allow DM-nitrophen to diffuse uniformly into the myofilament lattice in the fiber. Immediately before the laser flash irradiation, the preparation was placed in silicon oil or exposed to air to prevent diffusion of ATP from the external solution. The latter method was mainly used because the results thereby obtained were more reproducible. The length and force changes of the preparation during the flash-induced fiber shortening were monitored with a storage oscilloscope (5113, Tektronix), stored in a digital memory (12-bit resolution), and sent to a personal computer (5530W, IBM Japan, Tokyo) for further analysis. Shortening velocities during the course of auxotonic fiber shortening were measured by averaging the first time derivatives of fiber length recorded for each consecutive time segment of 80 ms duration. Power output values were obtained by multiplying the shortening velocity by the force developed in each time segment. The use of shorter time segments made the traces too noisy for analysis. After the flash-induced shortening was over, the fibers were made to relax in relaxing solution. The flash-activation of the fibers could be repeated several times at intervals of 5–10 min.
During the time (≈2 s) between the moment of exposure of the preparation to air and that of flash irradiation, ATPase activity of the myosin heads goes on in the relaxed fiber. The ATP concentration in the fiber therefore should be a little higher than that of myosin heads to prevent local formation of the rigor linkages, which is known to increase affinity of troponin to Ca2+ in the vicinity of the rigor linkage and to result in force generation (15). Preliminary experiments showed that, when the ATP concentration in the photolysis solution was 220 μM, force development in the preparation at the moment of flash irradiation was <1% of the maximum isometric force P0. The ATP concentration in the photolysis solution therefore was made to be 220 μM; because the reaction, M (myosin head) + ATP → M⋅ADP⋅Pi, occurs rapidly whereas M⋅ADP⋅Pi breaks very slowly (6), almost all the myosin heads in the fiber are expected to be the M⋅ADP⋅Pi form at the moment of flash activation.
The preparation exposed in air was surrounded by cooled (1°C) aluminum plates. The temperature of the space where the fibers are activated to shorten was estimated as follows. First, the preparation was maximally activated isometrically in contracting solution (pCa 4.5) at varying temperatures, and the force-velocity curve for each temperature was obtained by applying a ramp decrease in force from P0 to zero (16). Then, the force-velocity curve was also obtained from the preparation that was exposed in air after development of full isometric force P0, and the curve was compared with those obtained at various temperatures. The temperature of the space thus was estimated to be 4°C.
Electron Microscopy.
Uniformity of sarcomere length in the fiber was examined electron microscopically by fixing the fibers in a 2.5% glutaraldehyde solution containing 0.2% tannic acid and then in a 1% OsO4 solution either before or after laser flash-induced shortening. Conventional longitudinal sections of the fibers were observed with a transmission electron microscope (JEM 100CX, JEOL).
RESULTS
Characteristics of Auxotonic Fiber Shortening.
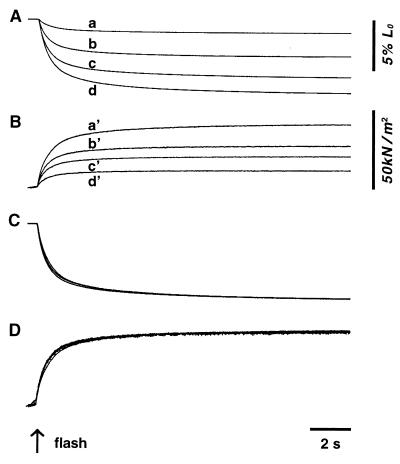
Typical records of changes in fiber length and force during the laser flash-induced fiber shortening at various compliances of auxotonic load, Cauxo, are shown in Fig. 1 A and B. When the preparation was fully activated by photoreleased Ca2+, it shortened for a distance and eventually stopped shortening as the fiber went into rigor state on complete exhaustion of ATP within the fiber. Unexpectedly, both the fiber shortening and the force changes were found to be scaled in proportion to the maximum values attained; in other words, they were found to be identical in time course if normalized relative to the maximum values attained, as shown in Fig. 1 C and D.
Figure 1.
Typical fiber length (A) and force (B) changes during laser-flash-induced fiber shortening against four different compliances of auxotonic load Cauxo. Length records a, b, c, and d correspond to force records a′, b′, c′, and d′, respectively. The value of Cauxo was 1.6 (records a–a′), 7.3 (records b–b′), 14.6 (records c–c′), and 33.3% L0/P0 (records d–d′), respectively. Normalized length and force changes relative to the maximum values attained are shown in C and D, respectively.
Changes in Shortening Velocity and Power Output During Auxotonic Fiber Shortening.
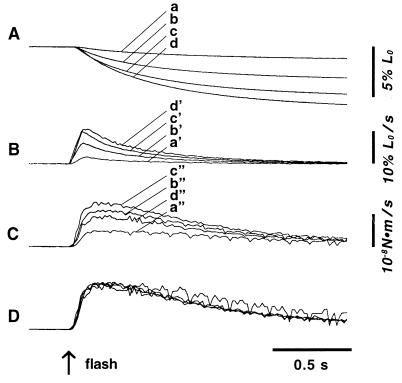
In Fig. 2 A–C are shown the early phases of changes in fiber length, velocity of fiber shortening, and power output (shortening velocity times force) on a fast time base. On laser-flash irradiation, the velocity of fiber shortening increased rapidly to a maximum in ≤80 ms (in the first time segment) after the onset of fiber shortening, irrespective of the value of Cauxo, and then decreased exponentially with time. The power output reached a maximum in ≤160 ms (at or before the end of the second time segment) after laser-flash activation, irrespective of the value of Cauxo. Reflecting the result that the length and force changes are scaled in proportion to the maximum values attained (Fig. 1), the power output changes were also scaled in proportion to the peak values attained, as shown in Fig. 2D.
Figure 2.
Typical fiber length (A), shortening velocity (B), and power output (C) changes in the early phase of fiber shortening against four different values of Cauxo. Length records a, b, c, and d correspond to velocity records a′, b′, c′, and d′ and to power output records a", b", c", and d", respectively. Normalized power output records relative to the peak values attained are shown in D. The records are the same as those shown in Fig. 1.
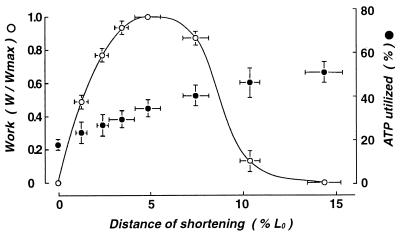
As can be seen in Fig. 2C, the amount of external work produced, W (the area under the power output record), was maximum at a moderate value of Cauxo. Because W is zero when Cauxo is zero (isometric condition) or very large (practically unloaded condition), the relation between W and Cauxo (or the distance of fiber shortening for a given time) is bell-shaped (see Fig. 5).
Figure 5.
Dependence of the amount of ATP utilized for mechanical response (Pu/P0, solid circles) and the amount of work produced (W/Wmax, open circles) on the distance of fiber shortening x at 1 s after laser-flash activation. The data points were obtained from 13 different data sets. Vertical and horizontal bars for each data points indicate SEM.
Dependence of the Velocity of Fiber Shortening on the Distance of Auxotonic Shortening.
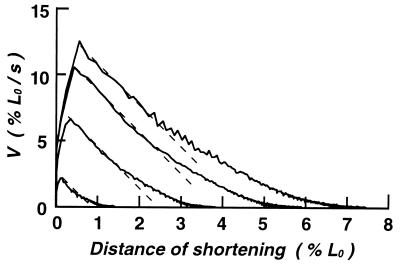
Fig. 3 shows the relation between the velocity of fiber shortening V and the distance of fiber shortening x. The changes in V with x can be divided into three phases: (i) the first phase, in which V rises abruptly from zero to the maximum value; (ii) the second phase, in which V decreases in proportion to x; and (iii) the third phase, in which V further decreases with x to zero. Though the value of x in phase i increased with increasing compliance of auxotonic load, it did not exceed 10 nm/half sarcomere even when the compliance was increased to >50% L0/P0 (practically unloaded condition). A remarkable feature of phase ii was that the rate of decrease of V with x was almost the same irrespective of the maximum velocity attained at the end of phase i.
Figure 3.
Relation between velocity V and the distance of fiber shortening x at four different values of Cauxo. The records used are the same as those shown in Figs. 1 and 2. Broken lines indicate that, after reaching a peak, V decreases linearly with x with the same slope irrespective of the value of Cauxo.
In the present study, each myosin head was in the state M⋅ADP⋅Pi at the beginning of fiber shortening and could not hydrolyze another ATP molecule after releasing Pi and ADP from itself. If the myosin heads form rigor links with actin immediately after the product release, such rigor links would sharply reduce V with x because of a rapid increase in the internal resistance against fiber shortening, especially under large Cauxo. As shown in Fig. 3, however, V was found to decrease linearly with x in phase ii with almost the same slope, irrespective of the values of Cauxo. This strongly suggests that, when myofilament sliding is going on, the myosin heads do not readily form rigor links with actin.
Estimation of the Amount of M⋅ADP⋅Pi Remaining in the Fiber.
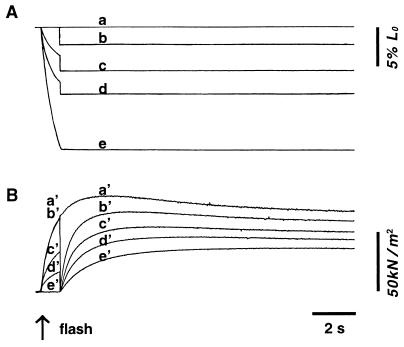
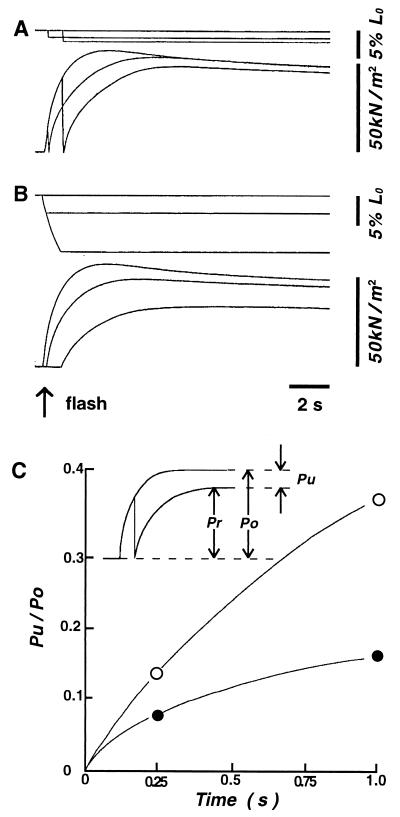
To estimate the amount of M⋅ADP⋅Pi utilized for mechanical response at a given time after laser flash activation, the preparation was subjected to a quick decrease in fiber length (complete in 1–2 ms) to reduce the force to zero, and then the fiber length was clamped to permit development of isometric force. A typical result of experiments, in which the preparation was first made to contract isometrically, or to shorten auxotonically, at various Cauxo for 1 s, and was then released to zero force level, whereon the fiber length was clamped at the new length and allowed to develop isometric force, is presented in Fig. 4. In the case of auxotonic shortening at a very large Cauxo (>40% L0/P0, almost similar to the unloaded condition), the fiber shortening was simply interrupted by clamping the fiber length without a preceding release. The amount of isometric force developed Pr (relative to the maximum isometric force developed in the isometric condition P0) serves as a measure of the amount of M⋅ADP⋅Pi remaining in the fiber at the time when auxotonic fiber shortening is interrupted (see Inset in Fig. 6C). Similar experiments on nine different preparations always showed that, at 1 s after laser flash activation, the amount of M⋅ADP⋅Pi remaining in the fiber was maximum in the isometric condition and decreased with increasing Cauxo and x.
Figure 4.
Typical fiber length (A) and force (B) changes when the preparation was first made to contract isometrically or to shorten against various Cauxo for 1 s, and then subjected to quick decreases in fiber length to reduce the force to zero to contract isometrically at the decreased fiber length. Length records a, b, c, d, and e correspond to force records a′, b′, c′, d′, and e′, respectively. The value of Cauxo was zero (= isometric condition, records b–b′), 6.5 (records c–c′), 14.6 (records d–d′) and 43.0% L0/P0 (= practically unloaded condition, e–e′), respectively. Records a–a′, were obtained in the isometric condition).
Figure 6.
Fiber length (upper traces) and force (lower traces) changes when the amount of ATP utilized for mechanical response Pu was estimated at 0.25 s and 1 s after flash activation in the isometric condition (A) and in the practically unloaded condition (Cauxo = 48L0/P0) (B). In C, the values of Pu/P0 in the isometric (solid circles) and the practically unloaded (open circles) conditions are plotted against time after flash activation. The records were obtained from the same preparation. Note that the difference in Pu between the two extreme conditions is much smaller at 0.25 s than at 1 s after flash activation.
Dependence of the Amount of ATP Utilized in the Mechanical Response and the Amount of Work Done on the Distance of Fiber Shortening.
In the experiments shown in Fig. 4, the amount of ATP (or more exactly, the amount of M⋅ADP⋅Pi) utilized for mechanical response Pu can also be obtained as Pu = (P0 − Pr) (see Inset in Fig. 6C), whereas the amount of external work produced, W, is obtained from the area under the power output record. Fig. 5 shows the dependence of Pu (expressed relative to P0) and W (expressed relative to the maximum value Wmax obtained at a moderate Cauxo) on x at 1 s after laser-flash activation. The data points were obtained from 13 different data sets. The value of Pu at a given time after laser flash activation was minimal in the isometric condition and increased with x. The amount of Pu under the practically unloaded condition was ≈2–3.5 times larger than that in the isometric condition at 1 s after flash activation. On the other hand, the value of W was maximal (0.4–1.2 × 10⁻⁸ N⋅m) at a moderate value of x, attained under a moderate Cauxo, and was zero when Cauxo = 0 (isometric condition) or >40% L0/P0 (practically unloaded conditions).
As shown in Fig. 6 A and B, the difference in Pu between the isometric and the practically unloaded conditions decreased markedly as the time of estimation of Pu after laser-flash activation was decreased. Similar results were obtained with four other preparations studied, indicating that, at the time when the power output reaches a maximum at <160 ms after laser-flash activation (Fig. 2 C and D), the values of Pu is almost the same irrespective of the values of Cauxo, as all the Pu versus time relations during auxotonic shortening against various Cauxo are bracketed Pu versus time relation in the isometric condition and that in the practically unloaded condition (Fig. 6C).
Uniformity of Sarcomere Lengths Before and After Fiber Shortening.
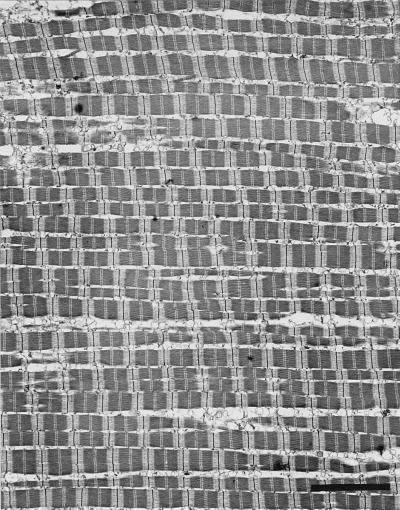
Fig. 7 shows an electron micrograph of a longitudinal section of a muscle fiber fixed after laser-flash-induced shortening (≈6%). The sarcomere length was uniform (≈2.25 μm) everywhere within the microscopic field. The sarcomere length agreed well with the distance of fiber shortening from the initial sarcomere length of 2.4 μm. Similar results were obtained on five different fibers, indicating that laser-flash-induced fiber shortening occurs uniformly in every sarcomere within the fiber.
Figure 7.
Electron micrographs showing longitudinal sections of a muscle fiber fixed after laser-flash-induced auxotonic shortening (by ≈6% L0). Scale bar, 5 μm. Note the uniformity of sarcomere length in the microscopic field.
DISCUSSION
The present experiments were aimed at determining whether the efficiency to convert chemical energy derived from ATP hydrolysis into mechanical work in individual myosin heads changes depending on external load. For this purpose, the fibers were rapidly and maximally activated by laser-flash photolysis of caged calcium in the condition that, immediately before activation, the number of ATP molecules in the fiber was almost equal to the number of myosin heads, so that each myosin head is in the state M⋅ADP⋅Pi on activation. Each myosin head sequentially released Pi and ADP, thus contributing to the mechanical response of the fiber, but after product release, no myosin head could hydrolyze more ATP molecules any longer to eventually form rigor links with actin. The above experimental conditions may be comparable with those of quenched flow experiments under nonsteady conditions in which enzyme concentration is equal to substrate concentration, so that only a single turnover occurs.
Despite the eventual development of the rigor state in the fiber, the results obtained proved to be unexpectedly simple; the length and the force changes of fiber shortening against various compliances, Cauxo, scaled in proportion to the maximum values attained (Fig. 1). As a result, the power output changes also scaled in proportion to their peak values reached in the early phase of fiber shortening (Fig. 2). The scaling of length, force, and power records originates from the exponential time course of early length and force changes (except for the initial part corresponding to phase i) (Fig. 1), leading to the exponential time course of changes in V (first time derivative of length changes) (Fig. 2) and to the constant slope of the V versus x relations in phase ii over a wide range of Cauxo (Fig. 3). At the beginning of auxotonic shortening, the amount of load on the actin-myosin linkages is zero irrespective of the value of Cauxo, and consequently, the number of myosin heads that start their powerstroke on laser flash activation is likely to be nearly the same irrespective of Cauxo. This may constitute the main reason for the scaling of the mechanical records. Another reason for the scaling of the mechanical records may be that formation of actin-myosin rigor linkages does not readily take place until myofilament sliding almost stops. This implies that, during the period when the power output reaches a maximum, the amount of internal work against rigor links is not appreciable compared with the amount of external work, i.e., the area under the power-output record; otherwise, V should decrease with x more rapidly at higher values of Cauxo, producing higher rates of ATP utilization (Fig. 5).
To study the mechanical efficiency of the shortening fibers, the amount of ATP utilized for mechanical response Pu was estimated by measuring the isometric force development at a given time after laser-flash activation (Fig. 4). At 1 s after laser flash activation, Pu was minimal in the isometric condition (Cauxo = 0, x = 0) and maximal in the practically unloaded condition. Because the value of Pu/P0 is ≈0.18 in the isometric condition and ≈0.49 in the practically unloaded condition at 1 s after flash activation (Fig. 5), the average rates of utilization of M⋅ADP⋅Pi as the result of interaction of the myosin heads with the thin filaments are simply estimated to be ≈0.18 s−1 per head and ≈0.49 s−1 per head in the two extreme conditions, respectively. As the difference in the amount of Pu between the two extremes decreased with decreasing time after flash activation (Fig. 6), it seems again likely that, in the early phase of laser-flash-induced mechanical response, almost the same number of the myosin heads in the state M⋅ADP⋅Pi start interacting with the thin filament more or less synchronously to build up the early phase of auxotonic shortening (corresponding to phases i and ii in Fig. 3).
The bell-shaped W versus Cauxo and x relation (Fig. 5) also holds in the early phase of auxotonic shortening, as obviously indicated by the scaling of the power output records with respect to the peak values (Fig. 2). This means that, in the early phase of auxotonic shortening, where almost the same number of the myosin heads interact with the thin filaments synchronously, the mechanical efficiency of individual myosin heads changes depending on the value of Cauxo, i.e., the mechanical conditions, being maximum at a moderate value of Cauxo. However, the results shown in Fig. 5 are not qualitatively like Fenn’s result (1), namely, that the energy output (amount of ATP utilized) is maximum when the work done is maximum.
When the myosin heads start their interaction with the thin filaments upon flash activation, they may be unaware that they do not have another ATP molecule to hydrolyze. The scaling of the power output records against various Cauxo (Fig. 2D), however, gives us the impression that, in the early phase of auxotonic shortening, the fibers somehow sense the value of Cauxo against which they have to shorten and determine the subsequent time course of power output or work production. In this connection, it is of interest to speculate that the myosin heads may sense Cauxo in phase i of fiber shortening, in which the velocity of fiber shortening rises abruptly to a peak (Fig. 3). Further discussions on the load sensing mechanism are impractical until much more experimental work is done on this topic. Direct measurement of ATP hydrolysis by using [γ-32P]ATP coupled with measurement of mechanical work in muscle fibers would be effective. It should be pointed out, however, that load-dependent changes in mechanical efficiency have been observed in ATP-induced sliding between actin filaments and a glass microneedle coated with randomly oriented myosin molecules (5, 17, 18).
In conclusion, the foregoing results are taken as evidence that the efficiency of chemomechanical energy conversion in individual myosin heads in muscle fibers changes according to the external loads against which the fibers shorten on activation.
Footnotes
This paper was submitted directly (Track II) to the Proceedings Office.
References
- 1.Fenn W O. J Physiol. 1923;58:175–203. doi: 10.1113/jphysiol.1923.sp002115. [DOI] [PMC free article] [PubMed] [Google Scholar]
- 2.Woledge R C, Curtin N A, Homsher E. Energetic Aspects of Muscle Contraction. New York: Academic; 1985. [PubMed] [Google Scholar]
- 3.Huxley A F. Prog Biophys Biophys Chem. 1957;7:255–318. [PubMed] [Google Scholar]
- 4.Podolsky R J, Nolan A C. Cold Spring Harbor Symp Quant Biol. 1973;37:661–668. [Google Scholar]
- 5.Oiwa K, Chaen S, Sugi H. J Physiol. 1991;437:751–763. doi: 10.1113/jphysiol.1991.sp018623. [DOI] [PMC free article] [PubMed] [Google Scholar]
- 6.Bagshaw C R. Muscle Contraction. London: Chapman & Hall; 1994. [Google Scholar]
- 7.Iwamoto H, Sugaya R, Sugi H. J Physiol. 1990;422:185–202. doi: 10.1113/jphysiol.1990.sp017979. [DOI] [PMC free article] [PubMed] [Google Scholar]
- 8.Kaplan J H, Ellis-Davies G C R. Proc Natl Acad Sci USA. 1988;85:6571–6575. doi: 10.1073/pnas.85.17.6571. [DOI] [PMC free article] [PubMed] [Google Scholar]
- 9.McCray J A, Fidler-Lim N, Ellis-Davies G C R, Kaplan J H. Biochemistry. 1992;31:8856–8861. doi: 10.1021/bi00152a023. [DOI] [PubMed] [Google Scholar]
- 10.Goldstein D A. Biophys J. 1979;26:235–242. doi: 10.1016/S0006-3495(79)85247-9. [DOI] [PMC free article] [PubMed] [Google Scholar]
- 11.Goldman Y E, Hibberd M G, Trentham D R. J Physiol. 1984;354:577–604. doi: 10.1113/jphysiol.1984.sp015394. [DOI] [PMC free article] [PubMed] [Google Scholar]
- 12.Yamada T, Abe O, Kobayashi T, Sugi H. J Physiol. 1993;466:229–243. [PMC free article] [PubMed] [Google Scholar]
- 13.Blinks J R. J Physiol. 1965;177:42–57. doi: 10.1113/jphysiol.1965.sp007574. [DOI] [PMC free article] [PubMed] [Google Scholar]
- 14.Page S G, Huxley H E. J Cell Biol. 1963;19:369–390. doi: 10.1083/jcb.19.2.369. [DOI] [PMC free article] [PubMed] [Google Scholar]
- 15.Bremel R D, Weber A. Nat New Biol. 1972;238:97–101. doi: 10.1038/newbio238097a0. [DOI] [PubMed] [Google Scholar]
- 16.Sugi H, Kobayashi T, Gross T, Noguchi K, Karr T, Harrington W F. Proc Natl Acad Sci USA. 1992;89:6134–6137. doi: 10.1073/pnas.89.13.6134. [DOI] [PMC free article] [PubMed] [Google Scholar]
- 17.Sugi H, Oiwa K, Chaen S. In: Mechanism of Myofilament Sliding in Muscle Contraction. Sugi H, Pollack G H, editors. New York: Plenum; 1993. pp. 303–311. [Google Scholar]
- 18.Sugi H. Jpn J Physiol. 1993;43:435–454. doi: 10.2170/jjphysiol.43.435. [DOI] [PubMed] [Google Scholar]


