Abstract
The effect of phosphorus addition on survival of Escherichia coli in an experimental drinking water distribution system was investigated. Higher phosphorus concentrations prolonged the survival of culturable E. coli in water and biofilms. Although phosphorus addition did not affect viable but not culturable (VBNC) E. coli in biofilms, these structures could act as a reservoir of VBNC forms of E. coli in drinking water distribution systems.
Pathogens may enter the distribution system either through the source water or at any point within the distribution system (16). In the network enteric microorganisms, such as Escherichia coli, may survive and even exhibit metabolic activity in biofilms on the surfaces of pipes and reservoirs (22, 5). This phenomenon compromises the use of E. coli as a reliable indicator for fecal pollution. Due to its very low infection dose the accumulation and subsequent release of pathogenic E. coli from a biofilm to the water phase are increasing the health risk of tap water consumption. The survival and culturability of E. coli in water distribution networks are dependent on many environmental factors, including the disinfectant type and dose (14), the presence of predators (20), the pipe material, the temperature (21), the amount of corrosion products (4), the iron (1), heavy metal, and oxygen concentrations (18), and the water saturation (7). However, the role of nutrients, which in drinking water are normally present at low concentrations, in the survival of E. coli is not fully understood. Phosphorus (P) is an important nutrient and part of biomolecules in bacterial cells (e.g., DNA, polyphosphates, phospholipids, and ATP). In some drinking waters P regulates bacterial growth (12); thus, removal of this nutrient during water treatment (e.g., during chemical coagulation) may lower the bacterial numbers in the water and biofilms (9). P may also influence many mechanisms of E. coli survival, including transport of nutrients into the cell, biofilm formation, and motility. At concentrations below 5 μg liter−1 the mechanisms of nutrient uptake and energy conservation in E. coli change (3). Thus, reducing the P concentration below this level may decrease the potential for E. coli survival in drinking water distribution systems. However, the same effect may be obtained by increasing the levels of P (the growth-limiting nutrient) because this may enhance antagonism reactions by the faster-growing indigenous microbial population (2). The aim of this study was to evaluate the effect of P on survival of E. coli in drinking water distribution networks. Two forms of E. coli, culturable and viable but not culturable (VBNC), were investigated.
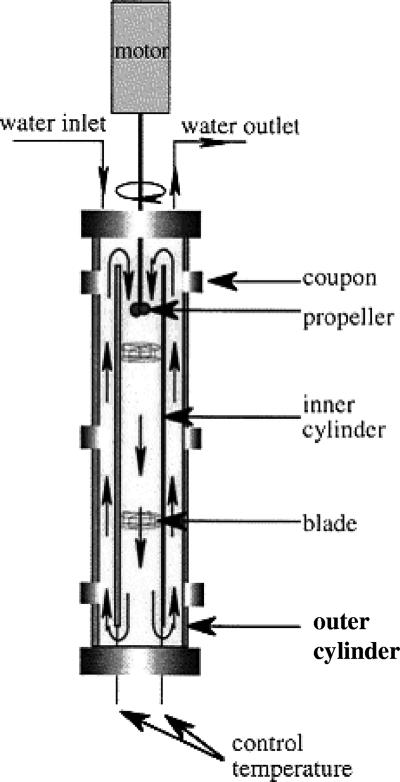
A model biofilm reactor (Fig. 1), a Propella reactor (Xenard, Mechanique de Precision, Seichamps, France) with a distribution pipe that was 100 mm in diameter and 500 mm long, was used to simulate a drinking water distribution system. The inner surface of the pipe was made of high-density polyethylene. The reactor had a volume of 2.23 liters and a high-density polyethylene pipe surface area of 1,604 cm2. It was continuously supplied with tap water from a local drinking water network (surface water after chemical coagulation, followed by biofiltration) at a flow rate of 186 ml h−1. The water velocity, 0.2 m s−1, was controlled with a marine propeller, which pushed the water through an inner pipe, providing a flux parallel to the pipe wall. The temperature was maintained around 15°C (Table 1). The biofilm on the pipe wall was studied using 15 stainless steel coupons (1.7 cm2) which were inserted into the inner surface of the pipe. E. coli ATCC 25922 was subcultured overnight on R2A medium (Lab M, International Diagnostics Group, plc, United Kingdom) at 36°C. A bacterial suspension was prepared in sterile phosphate-buffered saline (130 mM NaCl, 7 mM N2HPO4, 3 mM NaH2PO4; pH 7.2) and centrifuged (3,000 rpm; Nüvefuge CN 090; Nüve, Ankara, Turkey) for 10 min at 20°C. The pellet was washed twice in phosphate-buffered saline to limit carbon and phosphorus contamination from the culture medium and then starved by incubation in sterile drinking water for 12 h at 20°C. The number of E. coli cells in suspension was determined using an epifluorescence microscope (Leica DM LB; Leica Microsystems GmbH, Wetzlar, Germany) equipped with a 50-W mercury lamp at a magnification of ×1,000 after staining with DAPI (4′,6′-diamidino-2-phenylindole). The investigation was performed in duplicate with two identical Propella reactors (reactors A and B) at a temperature of 15°C. Before the experiment we ensured that bacterial growth was reproducible in both reactors and that the reactors were not releasing bacterial nutrients. The systems were not modified during the experiment. The natural microbial flora that was present in the drinking water colonized the inner surface and contributed to the formation of a biofilm. Weekly, water was obtained from the inlets and outlets of the reactors and biofilm coupons were sampled to monitor the biofilm formation in the reactors and to control biofilm development. In reactor B, H3PO4 was continuously added to maintain the P concentration at about 20 μg liter−1 during the entire experiment. After 2 weeks, the two experimental systems were colonized with bacteria at similar concentrations (Table 1). Then 10 ml of an E. coli suspension was added to each reactor over a period of 2 h to obtain final concentrations of 3 × 10⁷ and 4 × 10⁷ cells cm−2 (total E. coli) or 2 × 10⁷ and 3 × 10⁷ cells cm−2 (culturable E. coli) in the water and biofilm, respectively. The concentration of inoculated culturable cells was determined by multiplying the total number of E. coli cells by the experimentally obtained Colisure/DAPI ratio for overnight cultured and washed E. coli cells. The two reactor systems were analyzed 24, 48, 96, 144, 240, and 408 h after inoculation. At each time, outlet water samples (12 ml) and three coupons were collected. For the biofilm analysis, stainless steel coupons were aseptically removed from the sampling devices and put in 25 ml of sterile ultrapure water (Elga PureLab Ultra; Veolia Water Ltd., United Kingdom). Adherent cells were removed by gentle sonication (ColeParmer) for 2 min at 20 μA and 22 KHz. Heterotrophic plate counts in water and biofilm samples were estimated by the spread plate method (17), where samples were spread on R2A agar plates and incubated for 7 days at 22 ± 2°C before the CFU were counted. The total bacterial number was determined using epifluorescence microscopy and DAPI staining. At least 300 cells were counted, showing that the coefficient of variation of the bacterial number between the counted fields was less than 30%. The Image Pro Plus 4.5.1 software (Media Cybernetic, Inc., Silver Spring, MD) was used for image processing. The ATP concentration was determined with a luciferin-luciferase assay (Pi-102 luminometer; Hygiena International Limited). The number of metabolically active E. coli cells was determined by direct viable counting (DVC) (8) in combination with fluorescence in situ hybridization (FISH). The biofilm suspension was resuscitated in 0.5× R2A medium containing 10 μg ml−1 pipemidic acid {8-ethyl-5,8-dihydro-5-oxo-2-(1-piperazinyl)-pyrido[2,3-d]pyrimidine-6-carboxylic acid} for 8 h at 20°C. The antibiotic stopped cell proliferation, and in the presence of nutrients metabolically active cells became elongated. Then 30% formamide was added at a final concentration of 3 to 4%. Cells were concentrated on 25-mm-diameter 0.2-μm-pore-size filters (Anodisc; Whatman plc.), followed by FISH with the E. coli 16 rRNA-specific peptide nucleotide acid probe 5′ TCA ATG AGC AAA GGT 3′ (15) labeled with the cyanine dye Cy3 (excitation wavelength, 550 nm; emission wavelength, 570 nm) and flanked with solubility enhancers (Applied Biosystems). Samples were covered with a hybridization buffer (50 mM Tris-HCl buffer [pH 7.5], 50% dextran sulfate, 10% [wt/vol] 0.1 mM NaCl, 30% [vol/vol] formamide, 30% [vol/vol] tetrasodium pyrophosphate, 0.2% [wt/vol] polyvinylpyrrolidone, 0.2% [wt/vol] Ficoll 400, 5 mM Na2EDTA, 0.1% [vol/vol] Triton X-100) containing 200 nM probe and incubated for 90 min at 57°C, followed by incubation in washing buffer (5 mM Tris, 15 mM NaCl, 1% Triton X-100; pH 10) for 30 min at 57°C. Hybridized cells whose size had increased at least 1.5-fold were assumed to be metabolically active and were counted with an epifluorescence microscope. The bacterial numbers during DVC incubation increased approximately 10-fold. In parallel, culturable E. coli cells in outlet water (washout) and in sonicated biofilm samples were quantified using the Colisure method (IDEXX Laboratories, Inc., United States) (6). At least three dilutions were prepared for each sample to obtain the optimal bacterial number for analyses. Unless stated otherwise, general water quality parameters were determined with standard methods. The concentration of potentially assimilable organic carbon was determined as described by Miettinen et al. (13). The concentration of microbially available phosphorus, the fraction of total P which supports bacterial growth, was determined with a bioassay developed by Lehtola et al. (10).
FIG. 1.
Cross-sectional view of the Propella reactor.
TABLE 1.
Chemical and biological characteristics of inlet and outlet water and biofilms in Propella reactors before introduction of E. coli
| Position | Parameter (units) | Reactor(s) | Mean | SD | No. of determinations |
|---|---|---|---|---|---|
| Inlet | Dissolved O2 concn (mg liter−1) | A and B | 22.8 | 2.9 | 20 |
| UV absorbance at 254 nm | 0.045 | 0.007 | 20 | ||
| NH4 concn (mg liter−1) | 0.07a | 0.02 | 18 | ||
| NO3 concn (mg liter−1) | 2.0 | 0.3 | 10 | ||
| Conductivity (μs cm−1) | 295 | 98 | 10 | ||
| Total organic carbon concn (mg liter−1) | 5.00 | 1.43 | 18 | ||
| Total chlorine concn (mg liter−1) | <0.1 | 1 | |||
| ATP concn (relative light units) | 210 | 40 | 3 | ||
| pH | 7.3 | 0 | 3 | ||
| Heterophilic plate count on day 7 (CFU ml−1) | 4,502 | 8,759 | 2 | ||
| Temp (°C) | A | 15.5 | 0.8 | 120 | |
| B | 14.8 | 0.9 | 120 | ||
| Ptotal (mg liter−1) | A | <0.01 | 0 | 6 | |
| B | 0.031 | 0.005 | 6 | ||
| Microbially available phosphorus concn (μg liter−1) | A | 0.86 | 0.3 | 4 | |
| B | 11.15 | 1 | |||
| Outlet | ATP concn (relative light units) | A | 2,342 | 344 | 3 |
| B | 2,707 | 1,520 | 3 | ||
| Biofilm | Total bacterial no. (cells cm−1) | A | 1.4E+7 | 6.9E+6 | 3 |
| B | 1.1E+7 | 6.8E+6 | 3 | ||
| ATP concn (relative light units) | A | 1,614 | 448 | 3 | |
| B | 2,356 | 195 | 3 |
Value below detection level.
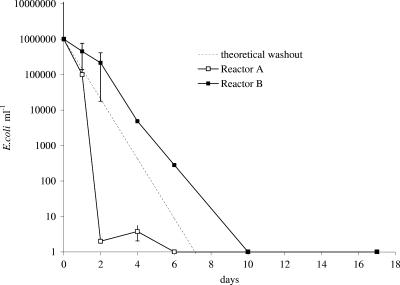
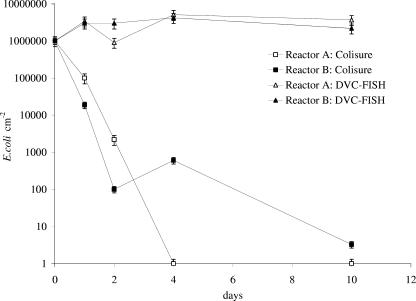
The results showed that the chemical and bacteriological characteristics of water (total organic carbon concentrations, pH, total chlorine concentration, and bacterial counts) in both reactors were relatively stable during the entire investigation, and the only significant difference was a difference in P concentration. The microbially available phosphorus concentration was less than 1 μg liter−1 in reactor A (with no P added) and was about 10 times higher in reactor B (with P added). According to ATP and total bacterial count measurements (Table 1), addition of P did not significantly increase the bacterial numbers in biofilms. The possible reason for this is explained elsewhere (19). The concentration of culturable E. coli (determined with the Colisure method) in the outlet water from reactor A decreased rapidly after inoculation, and after 6 days no culturable E. coli was detected in the outflow from the reactor (Fig. 2). Addition of P in reactor B increased the number of culturable E. coli cells in water at the outlet, and no culturable cells were detected after 10 days. The total number of E. coli cells (determined with the DVC-FISH procedure) (Fig. 3) in the biofilms of both reactors did not change significantly during the entire experiment (Fig. 4), whereas the concentration of culturable E. coli in the biofilms decreased rapidly. Addition of P in the reactor prolonged the survival of culturable E. coli cells in biofilms by extending the period of bacterial complete washout from 4 to more than 10 days.
FIG. 2.
E. coli bacteria in outlet water of Propella reactors A and B (with 20 μg liter−1 phosphorus added). E. coli numbers were determined with the Colisure method.
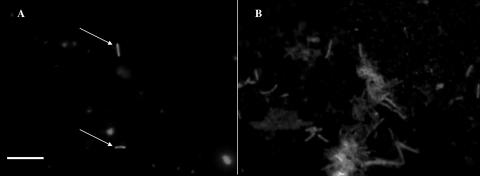
FIG. 3.
(A) Metabolically active E. coli (arrows) as determined with DVC-FISH. (B) All bacteria as determined with DAPI (after the DVC-FISH procedure) in a sonicated biofilm sample. Bar = 10 μm.
FIG. 4.
E. coli in the biofilms of Propella reactors A and B (with 20 μg liter−1 phosphorus added). E. coli numbers were determined with the Colisure method and the DVC-FISH method.
In summary, this study showed that a higher concentration of P in water increased the cultivability of E. coli in biofilms of water distribution systems. It is known that P is effectively removed during conventional water treatment processes by the chemical coagulation method. Therefore, it is more likely that water supply systems which use this water treatment technology provide less favorable conditions for the survival of E. coli and perhaps also for the occurrence of coliforms. It is also known that an important reason for the occurrence of coliforms in a water supply is the high concentration of iron which has been released from corroded cast iron pipes (1). Our findings suggest that the use of phosphate-based corrosion inhibition should be critically evaluated as it may introduce P into the water, thus creating more favorable conditions for the survival of enteric bacteria. This study also showed that a biofilm serves as a reservoir for E. coli, where it remains in the VBNC form. Although the bacteria are no longer capable of growing on conventional bacteriological media, they can conserve pathogenic factors and genes (11); thus, we suggest that more attention should be paid to analyses of VBNC forms of E. coli in water distribution networks.
Acknowledgments
This work was undertaken as part of a research project which is supported by the European Union within the Fifth Framework Programme, “Energy, environment and sustainable development program” (grant EVK1-2002-00108 [SAFER]).
We thank Bill Keevil, Sandra Wilks, Ilkka Miettinen, and Markku Lehtola for helpful discussions.
Footnotes
Published ahead of print on 6 April 2007.
REFERENCES
- 1.Appenzeller, B. M. R., C. Yanez, F. Jorand, and J. C. Block. 2005. Advantage provided by iron for Escherichia coli growth and cultivability in drinking water. Appl. Environ. Microbiol. 71:5621-5623. [DOI] [PMC free article] [PubMed] [Google Scholar]
- 2.Banning, N., S. Toze, and B. J. Mee. 2003. Persistence of biofilm-associated Escherichia coli and Pseudomonas aeruginosa in groundwater and treated effluent in a laboratory model system. Microbiology 149:47-55. [DOI] [PubMed] [Google Scholar]
- 3.Batté, M., L. Mathieu, P. Laurent, and M. Prévost. 2003. Influence of phosphate and disinfection on the composition of biofilms produced from drinking water, as measured by fluorescence in situ hybridization. Can. J. Microbiol. 49:741-753. [DOI] [PubMed] [Google Scholar]
- 4.Camper, A. K., W. L. Jones, and J. T. Hayes. 1996. Effect of growth conditions and substratum composition on the persistence of coliforms in mixed-population biofilms. Appl. Environ. Microbiol. 62:4014-4018. [DOI] [PMC free article] [PubMed] [Google Scholar]
- 5.Fass, S., M. L. Dincher, D. J. Reasoner, D. Gateland, and J. C. Block. 1996. Fate of Escherichia coli experimentally injected in a drinking water distribution pilot system. Water Res. 30:2215-2221. [Google Scholar]
- 6.Garcia-Armisen, T., P. Lebaron, and P. Servais. 2005. β-d-Glucuronidase activity assay to assess viable Escherichia coli abundance in freshwaters. Lett. Appl. Microbiol. 40:278-282. [DOI] [PubMed] [Google Scholar]
- 7.Grandjean, D., S. Fass, D. Tozza, J. Cavard, V. Lahoussine, S. Saby, H. Guilloteau, and J. C. Block. 2005. Coliform culturability in over- versus undersaturated drinking waters. Water Res. 39:1878-1886. [DOI] [PubMed] [Google Scholar]
- 8.Kogure, K., U. Simidu, and N. Taga. 1979. A tentative direct microscopic method for counting living marine bacteria. Can. J. Microbiol. 25:415-420. [DOI] [PubMed] [Google Scholar]
- 9.Lehtola, M. J., I. T. Miettinen, T. Vartinainen, and P. J. Martikainen. 1999. A new sensitive bioassay for determination of microbially available phosphorus in water. Appl. Environ. Microbiol. 65:2032-2034. [DOI] [PMC free article] [PubMed] [Google Scholar]
- 10.Lehtola, M. J., T. Juhna, I. T. Miettinen, T. Vartiainen, and P. J. Martikainen. 2004. Formation of biofilms in drinking water distribution networks, a case study in two cities in Finland and Latvia. J. Ind. Microbiol. Biotechnol. 31:489-494. [DOI] [PubMed] [Google Scholar]
- 11.Lleo, M. M., S. Pierobon, M. C. Tafi, C. Signoretto, and P. Canepari. 2000. mRNA detection by reverse transcription-PCR for monitoring viability over time in an Enterococcus faecalis viable but nonculturable population maintained in a laboratory microcosm. Appl. Environ. Microbiol. 66:4564-4567. [DOI] [PMC free article] [PubMed] [Google Scholar]
- 12.Miettinen, I. T., T. K. Vartiainen, and P. J. Martikainen. 1997. Phosphorus and bacterial growth in drinking water. Appl. Environ. Microbiol. 63:3242-3245. [DOI] [PMC free article] [PubMed] [Google Scholar]
- 13.Miettinen, I. T., T. K. Vartiainen, and P. J. Martikainen. 1999. Determination of assimilable organic carbon in humus-rich drinking waters. Water Res. 33:2277-2282. [Google Scholar]
- 14.Momba, M. N. B., T. Cloete, S. Venter, and R. Kfir. 1998. Evaluation of the impact of disinfection processes on the formation of biofilms in potable surface water distribution systems. Water Sci. Technol. 38:283-289. [Google Scholar]
- 15.Perry-O'Keefe, H., S. Rigby, K. Oliveira, D. Sorensen, H. Stender, J. Coull, and J. J. Hyldig-Nielsen. 2001. Identification of indicator microorganisms using a standardized PNA FISH method. J. Microbiol. Methods 47:281-292. [DOI] [PubMed] [Google Scholar]
- 16.Ratnayake, N., and I. N. Jayatilake. 1999. Study of transport of contaminants in a pipe network using the model EPANET. Water Sci. Technol. 40:115-120. [Google Scholar]
- 17.Reasoner, D. J., and E. E. Geldreich. 1985. A new medium for the enumeration and subculture of bacteria from potable water. Appl. Environ. Microbiol. 49:1-7. [DOI] [PMC free article] [PubMed] [Google Scholar]
- 18.Roslev, P., L. A. Bjergbæk, and M. Hesselsoe. 2004. Effect of oxygen on survival of faecal pollution indicators in drinking water. J. Appl. Microbiol. 96:938-945. [DOI] [PubMed] [Google Scholar]
- 19.Rubulis, J., and T. Juhna. 2006. Effect of phosphorus on biofilm growth in a completely mixed biofilm reactor. Biofilms 2:14-15. [Google Scholar]
- 20.Sibille, I., T. Sime-Ngando, L. Mathieu, and J. C. Block. 1998. Protozoan bacterivory and Escherichia coli survival in drinking water distribution systems. Appl. Environ. Microbiol. 64:197-202. [DOI] [PMC free article] [PubMed] [Google Scholar]
- 21.Silhan, J., C. B. Corfitzen, and H. J. Albrechtsen. 2006. Effect of temperature and pipe material on biofilm formation and survival of Escherichia coil in used drinking water pipes: a laboratory-based study. Water Sci. Technol. 54:49-56. [DOI] [PubMed] [Google Scholar]
- 22.Williams, M. M., and E. B. Braun-Howland. 2003. Growth of Escherichia coli in model distribution system biofilms exposed to hypochlorous acid or monochloramine. Appl. Environ. Microbiol. 69:5463-5471. [DOI] [PMC free article] [PubMed] [Google Scholar]


