Abstract
The dynamics at the plasma membrane resulting from secretory vesicle docking and fusion and compensatory endocytosis has been difficult to observe in living cells primarily due to limited resolution at the light microscopic level. Using the atomic force microscope, we have been able to image and record changes in plasma membrane structure at ultrahigh resolution after stimulation of secretion from isolated pancreatic acinar cells. “Pits” measuring 500–2000 nm and containing 3–20 depressions measuring 100–180 nm in diameter were observed only at the apical region of acinar cells. The time course of an increase and decrease in “depression” size correlated with an increase and decrease of amylase secretion from live acinar cells. Depression dynamics and amylase release were found to be regulated in part by actin. No structural changes were identified at the basolateral region of these cells. Our results suggest depressions to be the fusion pores identified earlier in mast cells by freeze-fracture electron microscopy and by electrophysiological measurements. The atomic force microscope has enabled us to observe plasma membrane dynamics of the exocytic process in living cells in real time.
Keywords: exocytic fusion pore dynamics
Our current understanding of secretory vesicle fusion with the plasma membrane is derived from morphological (1–4), electrophysiological (5–10), and biochemical studies (1, 11–14). Morphological studies have been performed at both light and electron microscopic levels, primarily on chemically fixed or quick-frozen tissues. Ultrastructural studies on quick-freeze and freeze-fractures of stimulated mast cells demonstrate the presence of depressions, approximately 100 nm in diameter, which invaginate, subsequently making contact and fusing with the secretory vesicle membrane. The result is the formation of a continuous channel connecting the granule interior with the extracellular space (2). Electron microscopy of quick-freeze and fracture of the neuromuscular junctions following stimulation of the nerves demonstrates the presence of 30- to >150-nm diameter openings at the presynaptic plasma membrane (15). Similarly, patch-clamp experiments have shown that secretory granules can transiently fuse with the plasma membrane and release their secretory products (3, 4, 7, 16, 17). Capacitance measurements of mast cells following stimulation of secretion demonstrate the release of secretory products from a secretory vesicle that do not undergo complete fusion (7). Patch-clamp measurements of the activity of individual fusion pores in mast cells further suggest the presence of a pore through the bilayered plasma membrane that becomes continuous with the secretory vesicle membrane following stimulation of secretion (9).
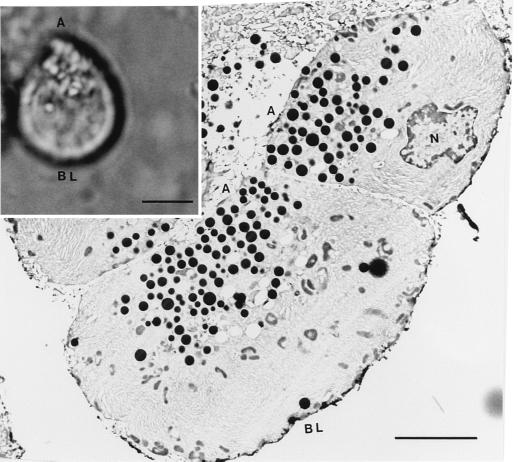
Although these studies have revealed a wealth of information on exocytosis, little is known about plasma membrane components and the dynamics of their involvement in the secretory process of a living cell. Using the BioScope atomic force microscope (BAFM) (18) and a newly designed perfusion chamber mounted on an inverted microscope, we have been able to observe and study the involvement of a new group of plasma membrane structures in living cells. These structures were unidentifiable earlier in fixed or frozen tissue preparations, probably due to membrane perturbations during processing. The crucial advantage of using the atomic force microscope in our study was that live cells could be imaged at nanometer resolution (19–23) as they underwent exocytosis. Pancreatic acinar cells were chosen for the present study due to the presence of a slow secretory process (minutes) (1, 24, 25), compared with neuroendocrine cells (seconds to milliseconds) (26) or neurons (microseconds) (12, 27). In such a slow secretory cell, one is more likely to identify the sequence of events leading to the fusion of secretory vesicles with the plasma membrane, which are unidentifiable in a fast secretor. When isolated acinar cells (Fig. 1) are exposed to a secretagogue, they release their secretory contents to the extracellular space in membrane-bound vesicles called zymogen granules (ZGs). One of the major components of the secreted material is amylase, which has been measured in our study to estimate the percent of total secretion from these cells (24). Mastoparan, an amphiphilic tetradecapeptide from wasp venom, is known to stimulate heterotrimeric Gi and Go proteins (28, 29). Recently, we have demonstrated the involvement of Gi and Go proteins in secretion from the rat exocrine pancreas (unpublished observation). Exposure of pancreatic acinar cells to Mas7, an active mastoparan analog, results in stimulation of secretion. The inactive mastoparan analog Mas17 has no effect on secretion from isolated pancreatic acinar cells. Time-course studies of amylase secretion and BAFM imaging of the plasma membrane were carried out on stimulated and unstimulated cells.
Figure 1.
Rat pancreatic acinar cells seen at the light (Inset) and electron microscope level. The polarity of isolated acinar cells with clearly identifiable apical (A) and basolateral (BL) regions is seen in the differential interference contrast image. The nucleus (N) is present toward the basolateral region, and the zymogen granules (ZGs), ranging in size from 0.1 to 1 μm, are concentrated at the apical end of the cells. (Bar = 5 μm.)
MATERIALS AND METHODS
Isolation and Preparation of Acinar Cells for Atomic Force Microscopy.
Pancreatic acinar cells and hemi-acini were isolated using a minor modification of our published procedure (24). For each experiment, a male Sprague Dawley rat weighing 80–100 g was euthanized by ether inhalation. The pancreas was then dissected out and chopped into 0.5-mm3 pieces, which were mildly agitated for 15 min at 37°C in a siliconized glass tube with 5 ml of oxygenated buffer A (98 mM NaCl/4.8 mM KCl/2 mM CaCl2/1.2 mM MgCl2/0.1% bovine serum albumin/0.01% soybean trypsin inhibitor/25 mM Hepes, pH 7.4) containing 1000 units of collagenase. The suspension of acini was filtered through a 224-μm Spectra-Mesh (Spectrum Laboratory Products) polyethylene filter to remove large clumps of acini and undissociated tissue. The acini were washed six times, 50 ml per wash, with ice-cold buffer A. Isolated rat pancreatic acini and acinar cells were plated on Cell-Tak-coated (Collaborative Biomedical Products) glass coverslips. Two to three hours after plating, cells were imaged by the atomic force microscope before and during stimulation of secretion. Isolated acinar cells and small acinar preparations were used in the study because fusions of regulated secretory vesicles with the plasma membrane in pancreatic acini are confined to the apical region and are impossible to image by the atomic force microscope in whole tissue or large acinar preparations. Additionally, the secretagogue Mas7 has immediate and uniform access to all the acinar cells.
Isolated Pancreatic Acini for Light and Electron Microscopy.
After isolation of the rat pancreatic acini and acinar cells, they were resuspended in oxygenated buffer A and placed on a Cell-Tak-coated glass slide. Cells were observed and photographed using an Olympus 8MAX microscope. For electron microscopy, purified acinar cells in buffer A were centrifuged at 2000 × g for 2 min and the acinar pellet was resuspended in fixative. Cells were fixed in 4% buffered formaldehyde (PFA) for 2 h and in 8% PFA overnight, and the pellets were then embedded in 10% aqueous gelatin, infiltrated in 2.3 M sucrose containing 20% poly(vinylpyrrolidone), frozen by immersion in liquid nitrogen, and processed for cryosectioning (30). After the frozen block was sectioned at −140°C and the sections were transferred to coated specimen grids, they were dried in the presence of uranyl acetate and methyl cellulose and examined in a Philips 410 transmission electron microscope operating at 80 kV.
Atomic Force Microscopy.
The atomic force microscope is a powerful instrument to observe and obtain three-dimensional images at the nanometer resolution range of living cells. Several studies using the atomic force microscope have previously been carried out on living cells. In the BAFM, a fine silicon or silicon nitride tip scans the surface of a sample. Any deflection of the tip due to surface topology is recorded. The BAFM reconstructs an image of the surface from the x, y, and z scan data, to develop a three-dimensional topology of any surface at the nanometer level. Cells attached to a Cell-Tak-coated glass coverslip were placed in a thermally controlled fluid chamber that allowed both rapid fluid exchange and the direct visualization of the living cells by an inverted microscope. The newly designed BAFM (Digital Instruments, Santa Barbara, CA) was used in conjunction with an inverted optical microscope (Olympus IX70). Images of the plasma membrane in these cells were obtained by the BAFM, working in the “contact” mode and using a very low vertical imaging force from <1 to 3 nN. The procedure for atomic force microscope imaging in the contact mode for biological material has been described elsewhere (31, 32). Silicon and silicon nitride tips were used with spring constants of 0.25 and 0.06 N·m−1, respectively. To determine the effect of force on the plasma membrane topology, control experiments where performed, where a scanning force of up to 10 nN over a 60-min period demonstrated no significant changes at the plasma membrane.
Atomic Force Imaging of Acinar Cells Following Exposure to Mas7 or Cytochalasin B.
For performing atomic force microscopy on stimulated cells, acinar cells were scanned for 10–60 min by the BAFM cantilever prior to Mas7 stimulation of secretion. Pancreatic acinar cells were then stimulated to secrete bu using 20 μM Mas7 (20 μl of a 2 mM stock of Mas7 was added to 2 ml of the buffer A incubation mixture). No significant thermal effects following the 20-μl additions to the fluid chamber were observed. Similarly, cells were scanned following a 30-min exposure to 20 μM cytochalasin B. Twenty microliters of a 2 mM stock of cytochalasin B was added to 2 ml of the buffer A incubation mixture at room temperature.
Amylase Measurement Following Exposure of Acinar Cells to Mas7 or Cytochalasin B.
Exocytosis from acinar cells was measured by determining the percentage of total cellular amylase release, following exposure of cells to a secretagogue or cytochalasin B. Amylase, one of the major contents of ZGs, was measured by the procedure of Bernfeld (33). In a typical amylase assay, rat pancreatic acini dissociated as single cells and clumps of 2–6 cells were used. Fifty to 75 cells in 200 μl of total reaction mixture (buffer A) in the presence or absence of Mas7 or cytochalasin B were incubated at room temperature. Following incubation, the cells were centrifuged at 2000 × g for 2 min in an Eppendorf microcentrifuge. The supernatant containing the secreted amylase was assayed. The cells in the remaining 100 μl of incubation mixture were sonicated, and the sonicate was diluted and assayed for amylase. From the above measurements, the total cellular amylase and percent release from the cells were calculated. Five microliters of the supernatant or lysed cell fractions was added to 95 μl of ice-cold amylase assay buffer (10 mM NaH2PO4/10 mM Na2HPO4/20 mM NaCl) placed in 12 × 75 mm glass tubes in an ice bath. The reaction was started by adding 100 μl of a 10-mg/ml potato starch amylase assay buffer solution. The mixture was vortexed and incubated for 15 min at 37°C. Following the incubation, the mixture was cooled in an ice bath and 400 μl of a color reagent (44 mM 3,5-dinitrosalicylic acid, 200 mM KOH, and 20 mM sodium potassium tartarate) was added. The mixture in glass tubes was covered and lowered into a boiling water bath for 25 min followed by cooling and the addition of 1.4 ml of distilled water. The mixture was then brought to room temperature and transferred to a plastic cuvette, and absorbance at 530 nm was measured with a spectrophotometer (Beckman DU-64).
RESULTS
Identification of “Pits” and “Depressions” at the Apical Plasma Membrane of Live and Resting Acinar Cells.
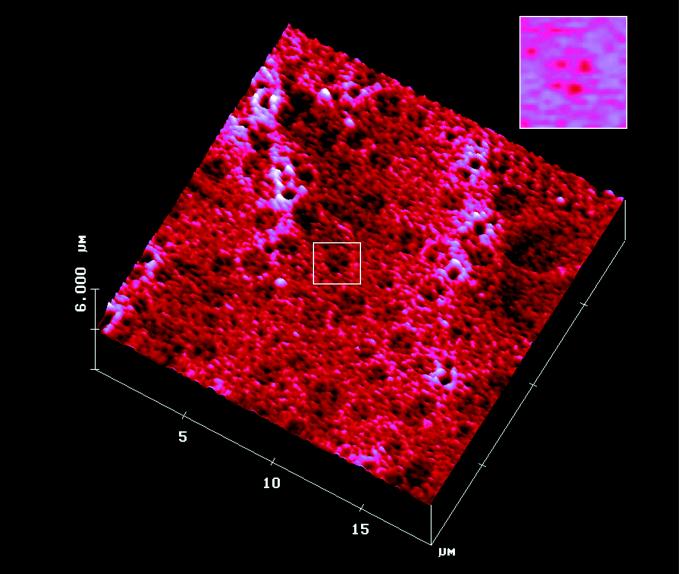
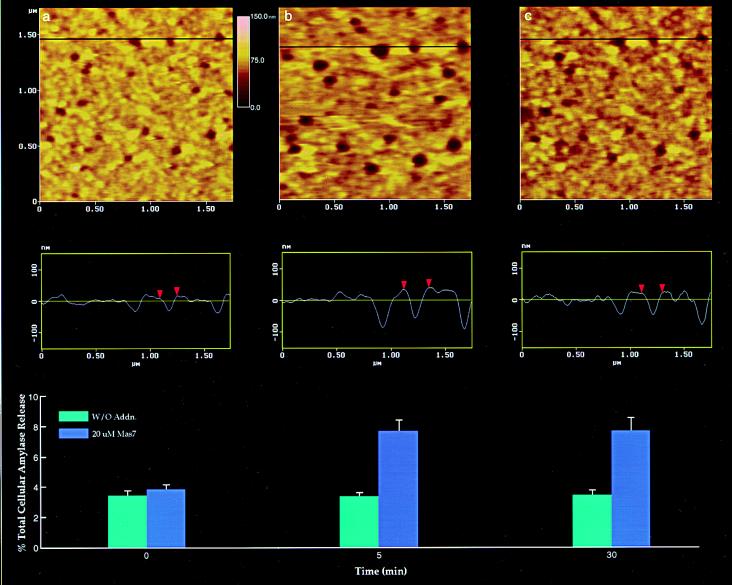
The exposed apical region and the basolateral plasma membrane of isolated pancreatic acini and single cells were imaged by the BAFM. Whole cell images by the BAFM were difficult and almost impossible to obtain due to the large changes in height at different points on the cell, resulting in the loss of contact by the scanning cantilever (34). Fig. 2 is an image of the exposed apical cell plasma membrane in an acinus comprising 6 cells. At this resolution, the surface topology reveals microscopic projections as well as approximately 500- to 2000-nm pits that contain several depressions ranging from 100 nm to 200 nm in diameter. The pits and depressions were found to be present only at apical regions of the isolated acinar cell surface. At higher magnification, the depressions within pits are clearly identified (Fig. 2 Inset). Typically, the apical and basolateral regions of single acinar cells or acini composed of 2–4 cells were imaged by the BAFM. Scanning small surface areas (1–10 μm2) provided us with better-resolution images for accurate measurements of depressions. In Fig. 3a, a pit approximately 1.8 μm in diameter depicting 20 depressions is shown to illustrate depression size, range, and dynamics. Typically, pits have 2–6 depressions.
Figure 2.
Topology of the apical cell surface of isolated pancreatic acini observed by atomic force microscopy. Scattered pits at the apical plasma membrane surface with papillae-like projections are seen. One pit (Inset) with four depressions is shown. A number of large pore-like structures are also identified.
Figure 3.
Dynamics of depressions following stimulation of secretion. (a) Several depressions within a pit are shown. The scan line across three depressions in the top panel is represented graphically in the middle panel and defines the diameter and relative depth of the depressions; the middle depression is represented by red arrowheads. The bottom panel represents % total cellular amylase release in the presence and absence of the secretagogue Mas7. (b) Notice an increase in the depression diameter and relative depth, correlating with an increase in total cellular amylase release at 5 min after stimulation of secretion. (c) At 30 min after stimulation of secretion, there is a decrease in diameter and depth of the depressions and no further increase in amylase release over the 5-min time point. No significant changes in amylase secretion or depression diameter were observed in control acini, in either the presence or the absence of the nonstimulatory mastoparan analogue Mas17, throughout the times examined. High-resolution images of pits and their depressions were obtained before and after stimulation with Mas7, for up to 30 min.
Pits or depressions were unidentified in isolated acinar preparations comprising 10–15 cells, where the apical secretory region faced inward toward the lumen, rendering it inaccessible to the BAFM cantilever. Only the basolateral parts of acinar cells in these large acini preparations were exposed to the scanning cantilever. The apical region of acinar cells could be accessed only in isolated cells or in partial acini comprising only 3–6 cells with an exposed lumen. This observation suggests that pits are located at the apical plasma membrane of pancreatic acinar cells, where regulated secretory vesicles have been implicated to dock and fuse (35, 36).
Dynamics at the Apical Plasma Membrane of Live Acinar Cells Following Stimulation of Secretion by Mas7.
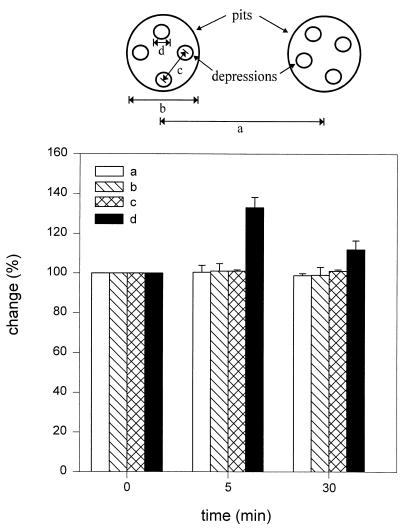
In this study, dynamics of structures at the apical plasma membrane of acinar cells were examined following stimulation of secretion by the secretagogue Mas7. Changes were observed only in the depressions (Fig. 3). Diameters of pits and depressions, and the distance between depressions within a pit as well as the distance between pits, were calculated (Fig. 4). Trypan blue staining of isolated pancreatic acinar cells used in each experiment was performed to assess any physical damage. This staining confirmed that cells were intact after completion of scanning by the BAFM cantilever.
Figure 4.
Changes were observed only in the depressions following stimulation of secretion. An analysis of the dimensions a–d (n = 28), schematically represented at the top and graphically presented below, demonstrates a significant increase (P < 0.001 by paired Student t test) in the depression diameter at 5 min and a return toward prestimulatory levels after 30 min. No changes (100%) in a–c are seen throughout the times examined. Pit and depression diameters were estimated using section analysis software from Digital Instruments. Each single pit or depression was measured twice, once in the scan direction and once at 90° to the first.
Following exposure of cells to 20 μM Mas7, a time-dependent increase in depression diameter was observed. Five minutes after stimulation of secretion, the diameter of the depressions increased significantly (P < 0.001) from the original 156.7 ± 3.9 nm (mean ± SEM, n = 28) (Fig. 3a, top and middle panels) to 211.23 ± 5.6 nm (Fig. 3b, top and middle panels). The approximate 35% increase in depression diameter (Fig. 4) was followed by a return toward control levels. Within 30 min, the depressions measured 171.5 ± 4.9 nm in diameter (Fig. 3c, top and middle panels), approximately a 20% decrease from the depression diameter observed 5 min after stimulation of secretion (Fig. 4). The enlargement of the depression diameter following exposure of cells to Mas7 correlated with a 129% increase in amylase secretion after 5 min over unstimulated control cells (the bottom panels of Fig. 3 a and b). No further increase in amylase secretion beyond 5 min after Mas7 exposure was seen. Examination of the diameter of pits and depressions, and the distance between depressions within a pit as well as the distance between pits, revealed no significant changes except in the depression diameter after stimulation of secretion (Fig. 4). No changes in membrane topology at the basolateral region of acinar cells were detected following stimulation of secretion by Mas7 (data not shown).
Plasma Membrane Depressions Regulated by Actin.
Exposure of acinar cells to cytochalasin B, a fungal toxin that inhibits actin polymerization, results in a 50–60% loss of stimulable amylase secretion. A significant decrease in depression diameter from 153.46 ± 3.07 nm to 125.88 ± 4.65 nm (P < 0.001) was observed following treatment of acinar cells with 20 μM cytochalasin B for 30 min at room temperature. Little increase in depression diameter (160.62 ± 3.6 nm), but a larger increase in relative depth of depression, was observed 5 min after Mas7 treatment of cytochalasin B pretreated acinar cells. Actin, therefore, may be an important component in maintenance and regulation of depression structure and dynamics involved in the exocytic process in pancreatic acinar cells.
DISCUSSION
Depressions Are Probably the Exocytic Fusion Pores.
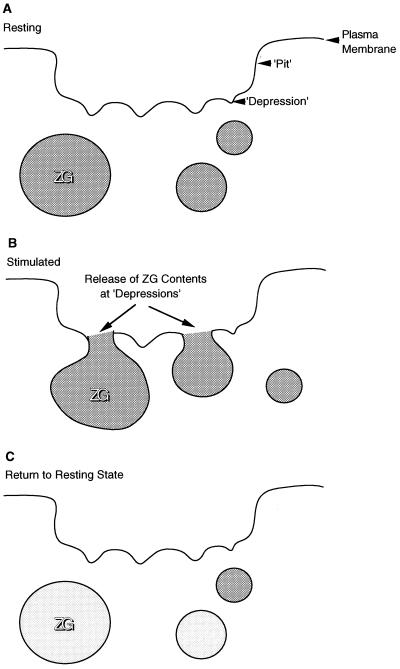
It is clearly suggested from these studies that the plasma membrane-associated depressions within pits may be involved in the exo/endocytic process. To determine whether the changes in depressions observed following stimulation of secretion are due to secretory vesicle fusion or to compensatory endocytosis, two hypothetical scenarios can be envisioned. One is that secretory vesicles dock and fuse with the plasma membrane away from the depressions, while the depressions facilitate compensatory endocytosis. The other is that secretory vesicles dock and fuse at the depressions, resulting in distention of the depression depth and diameter as demonstrated in our study. Since we do not observe any change in distance between depressions and pits following stimulation of secretion, this further argues against the first possibility, where incorporation of secretory vesicle with the plasma membrane would result in a transient increase in distance. It is likely that depressions may be the “fusion pores” in acinar cells. Since ZGs range in size from 0.1 to 1 μm in diameter (unpublished observation), the total fusion of a vesicle at a depression would extend the diameter of the depression severalfold larger than what is observed following stimulation of secretion. We therefore postulate that secretory vesicles transiently fuse at these plasma membrane depressions and release their contents at the apical membrane face. Furthermore, it could be argued that since no decrease from control levels in depression diameter or depth was observed throughout all times examined following stimulation of secretion, the depressions should be discounted as possible endocytic components. A hypothetical model involving depressions acting as transient docking and fusion stations of secretory vesicles is depicted schematically in Fig. 5. These plasma membrane-associated depressions are probably the so-called “exocytic fusion pores” observed in mast cells and at the neuromuscular junction when freeze-fracture electron microscopy (2–4) is used and as suggested by electrophysiological measurements (5–9). The BAFM has allowed us for the first time to observe, in real time, the dynamics of the plasma membrane-associated depressions involved in exocytosis in living cells.
Figure 5.
Schematic diagram depicting depressions as secretory vesicle docking and fusion sites at the apical plasma membrane of the pancreatic acinar cell. The depressions within pits are shown as permanent structures on the plasma membrane (a). Following stimulation of secretion, there is an increase in the depth and diameter of depressions, which then fuse with the ZG membrane, resulting in the release of vesicle contents (b). Following secretion, there is a gradual return to the resting state (c).
Although a relative increase in depth of depressions is identifiable following stimulation of secretion (Fig. 3b, middle panel), absolute depth measurements are not possible due to limitation in access of the BAFM cantilever into the depressions’ interior. Future development of finer cantilevers may make absolute depth measurements of the depressions possible. The measured size of the imaged depressions and pits may represent different elasticity at the plasma membrane due to differences in lipid content. Following stimulation of secretion, the detected dilation at depressions may be due to an increase in lipid content at the site. No irreversible fusion events were detected. The reason may be that the study was performed at room temperature or due to the nature of the secretagogue or both. At room temperature only very slow and transient fusion may occur, in contrast to exocytosis at 37°C.
A group of large pore-like structures ranging from 0.25 to 1 μm in diameter appear intermittently at the apical cell surface, and they do not change significantly in shape or size following stimulated secretion. The presence and function of these large-diameter pores is unknown at this time.
Actin Involvement in Depression Dynamics.
Earlier studies by Bauduin et al. (37) demonstrated that high concentrations of cytochalasin B inhibit secretion from the exocrine pancreas. Previous studies in pancreatic acinar cells and other cell types also demonstrated a requirement for actin filaments in exocytosis (37–41). A recent study by Muallem et al. (42) further demonstrates this role of actin and implicates its participation at a late step of exocytosis in the exocrine pancreas. The Muallem et al. (42) study demonstrates that high concentrations of actin-depolymerizing proteins inhibit exocytosis by agonists of several downstream effectors, suggesting that a minimal cytoskeletal structure is required for this process. From results of this study, the authors suggest actin participation in the secretory process to be a step close to or downstream of ZG docking at the plasma membrane. These studies further support our findings that actin regulates depressions, which may be the exocytic fusion pores, regulating amylase release. Our study’s demonstration of an increase in amylase release during dilation of the depressions (Mas7 exposure) and a decrease in amylase release following constriction of the depressions (cytochalasin B exposure) further argues in favor of depressions being the exocytic fusion pores in live acinar cells.
Acknowledgments
We thank Joseph F. Hoffman, James D. Jamieson, Gerhard H. Giebisch, and Fred J. Sigworth for valuable advice and discussion. We thank Digital Instruments for their continued technical support and Birgit Heil for help in preparing the hypothetical model. This work was supported by grants from the National Institutes of Health and the Ohse Award (to B.P.J.), the National Institutes of Health and the Whitaker Foundation (to J.P.G.), and a postdoctoral fellowship from the Deutsche Forschungsgemeinschaft (to S.W.S.).
Footnotes
Abbreviations: BAFM, BioScope atomic force microscope; ZG, zymogen granule.
References
- 1.Jamieson J D. In: Current Topics in Membranes and Transport. Bronner F, Kleinzeller A, editors. New York: Academic; 1972. pp. 273–338. [Google Scholar]
- 2.Chandler D E, Heuser J E. J Cell Biol. 1980;86:666–674. doi: 10.1083/jcb.86.2.666. [DOI] [PMC free article] [PubMed] [Google Scholar]
- 3.Breckenridge L J, Almers W. Nature (London) 1987;328:814–817. doi: 10.1038/328814a0. [DOI] [PubMed] [Google Scholar]
- 4.Breckenridge L J, Almers W. Proc Natl Acad Sci USA. 1987;84:1945–1949. doi: 10.1073/pnas.84.7.1945. [DOI] [PMC free article] [PubMed] [Google Scholar]
- 5.Almers W, Tse F W. Neuron. 1990;4:813–818. doi: 10.1016/0896-6273(90)90134-2. [DOI] [PubMed] [Google Scholar]
- 6.Chow R H, von Rüden L, Neher E. Nature (London) 1992;356:60–63. doi: 10.1038/356060a0. [DOI] [PubMed] [Google Scholar]
- 7.Alvarez de Toledo G, Fernández-Chaócn R, Fernández J M. Nature (London) 1993;363:554–558. doi: 10.1038/363554a0. [DOI] [PubMed] [Google Scholar]
- 8.Curran M J, Cohen F S, Chandler D E, Munson P J, Zimmerberg J. J Membr Biol. 1993;133:61–75. doi: 10.1007/BF00231878. [DOI] [PubMed] [Google Scholar]
- 9.Monck J R, Oberhauser A F, Fernandez J M. Mol Membr Biol. 1995;12:151–156. doi: 10.3109/09687689509038511. [DOI] [PubMed] [Google Scholar]
- 10.Lindau M, Almers W. Curr Opin Cell Biol. 1995;7:509–517. doi: 10.1016/0955-0674(95)80007-7. [DOI] [PubMed] [Google Scholar]
- 11.Rothman J E. Nature (London) 1994;372:55–63. doi: 10.1038/372055a0. [DOI] [PubMed] [Google Scholar]
- 12.Südhof T C. Nature (London) 1995;375:645–653. doi: 10.1038/375645a0. [DOI] [PubMed] [Google Scholar]
- 13.Schmid S L, Damke H. FASEB J. 1995;9:1445–1453. doi: 10.1096/fasebj.9.14.7589986. [DOI] [PubMed] [Google Scholar]
- 14.Burgoyne R D. J Physiol Pharmacol. 1995;46:273–283. [PubMed] [Google Scholar]
- 15.Heuser J E, Reese T S. J Cell Biol. 1981;88:564–580. doi: 10.1083/jcb.88.3.564. [DOI] [PMC free article] [PubMed] [Google Scholar]
- 16.Fernandez J M, Neher E, Gomperts B D. Nature (London) 1984;312:453–455. doi: 10.1038/312453a0. [DOI] [PubMed] [Google Scholar]
- 17.Zimmerberg J, Curran M, Cohen F S, Brodwick M. Proc Natl Acad Sci USA. 1987;84:1585–1589. doi: 10.1073/pnas.84.6.1585. [DOI] [PMC free article] [PubMed] [Google Scholar]
- 18.Binnig G, Quate C. Phys Rev Lett. 1986;56:930–934. doi: 10.1103/PhysRevLett.56.930. [DOI] [PubMed] [Google Scholar]
- 19.Henderson E, Haydon P G, Sakaguchi D S. Science. 1992;257:1944–1946. doi: 10.1126/science.1411511. [DOI] [PubMed] [Google Scholar]
- 20.Oberleithner H, Giebisch G, Geibel J. Pflügers Arch. 1993;425:506–510. doi: 10.1007/BF00374878. [DOI] [PubMed] [Google Scholar]
- 21.Parpura V, Haydon P G, Henderson E. J Cell Sci. 1993;104:427–432. doi: 10.1242/jcs.104.2.427. [DOI] [PubMed] [Google Scholar]
- 22.Fritz M, Radmacher M, Gaub H E. Biophys J. 1994;66:1328–1334. doi: 10.1016/S0006-3495(94)80963-4. [DOI] [PMC free article] [PubMed] [Google Scholar]
- 23.Lal R, Drake B, Blumberg D, Saner D R, Hansma P K, Feinstein S C. Am J Physiol. 1995;269:C275–C285. doi: 10.1152/ajpcell.1995.269.1.C275. [DOI] [PubMed] [Google Scholar]
- 24.Jena B P, Padfield P J, Ingebritsen T S, Jamieson J D. J Biol Chem. 1991;266:17744–17746. [PubMed] [Google Scholar]
- 25.Jena B P, Gumkowski F D, Konieczko E M, Fischer von Mollard G, Jahn R, Jamieson J D. J Cell Biol. 1994;124:43–53. doi: 10.1083/jcb.124.1.43. [DOI] [PMC free article] [PubMed] [Google Scholar]
- 26.Monck J R, Fernandez J M. J Cell Biol. 1992;119:1395– 1404. doi: 10.1083/jcb.119.6.1395. [DOI] [PMC free article] [PubMed] [Google Scholar]
- 27.Almers W. Annu Rev Physiol. 1990;52:607–624. doi: 10.1146/annurev.ph.52.030190.003135. [DOI] [PubMed] [Google Scholar]
- 28.Vitale N, Mukai H, Rouot B, Thiersé D, Aunis D, Bader M-F. J Biol Chem. 1993;268:14715–14723. [PubMed] [Google Scholar]
- 29.Konrad R J, Young R A, Record R D, Smith R M, Butkerait P, Mannings D, Jarett L, Wolf B A. J Biol Chem. 1995;270:12869–12876. doi: 10.1074/jbc.270.21.12869. [DOI] [PubMed] [Google Scholar]
- 30.Webster P, Vanacore L, Cohn J A, Marino C. Am J Pathol. 1993;267:C340–C348. doi: 10.1152/ajpcell.1994.267.2.C340. [DOI] [PubMed] [Google Scholar]
- 31.Hansma H G, Hoh J H. Annu Rev Biophys Biomol Struct. 1994;23:115–139. doi: 10.1146/annurev.bb.23.060194.000555. [DOI] [PubMed] [Google Scholar]
- 32.Schoenenberger C-A, Hoh J H. Biophys J. 1994;67:929– 936. doi: 10.1016/S0006-3495(94)80556-9. [DOI] [PMC free article] [PubMed] [Google Scholar]
- 33.Bernfeld P. Methods Enzymol. 1955;1:149–188. [Google Scholar]
- 34.Ricci D, Grattarola M. J Microsc (Oxford) 1994;176:254–261. doi: 10.1111/j.1365-2818.1994.tb03523.x. [DOI] [PubMed] [Google Scholar]
- 35.Amsterdam A, Jamieson J D. J Cell Biol. 1974;63:1037–1056. doi: 10.1083/jcb.63.3.1037. [DOI] [PMC free article] [PubMed] [Google Scholar]
- 36.Bolender R P. J Cell Biol. 1974;61:269–287. doi: 10.1083/jcb.61.2.269. [DOI] [PMC free article] [PubMed] [Google Scholar]
- 37.Bauduin H, Stock C, Vincent D, Grenier J F. J Cell Biol. 1975;66:165–181. doi: 10.1083/jcb.66.1.165. [DOI] [PMC free article] [PubMed] [Google Scholar]
- 38.Brady S, Lasek R, Allen D, Yin H L, Stossel T P. Nature (London) 1984;310:56–58. doi: 10.1038/310056a0. [DOI] [PubMed] [Google Scholar]
- 39.Fath K R, Burgess D R. J Cell Biol. 1993;120:117–127. doi: 10.1083/jcb.120.1.117. [DOI] [PMC free article] [PubMed] [Google Scholar]
- 40.Kuznetsov S A, Langford G M, Weiss D G. Nature (London) 1992;356:722–725. doi: 10.1038/356722a0. [DOI] [PubMed] [Google Scholar]
- 41.Whitters E A, Cleves A E, McGee A E, Skinner H B, Bankaitis V A. J Cell Biol. 1993;122:79–94. doi: 10.1083/jcb.122.1.79. [DOI] [PMC free article] [PubMed] [Google Scholar]
- 42.Muallem S, Kwiatkowska K, Xu X, Yin H L. J Cell Biol. 1995;128:589–598. doi: 10.1083/jcb.128.4.589. [DOI] [PMC free article] [PubMed] [Google Scholar]


